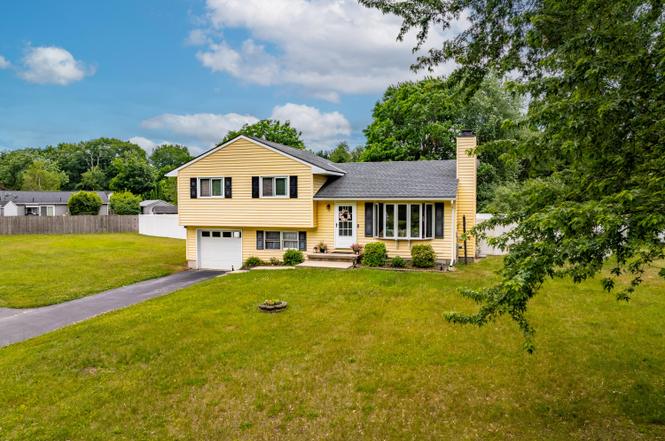
63 Rossman Cir · Stottville, NY
Flood risk 1/10 · Minimal
- FEMA flood zone
- X
- Chance of flooding over 30 yrs
- 0.0%
- Est. flood insurance / yr
- $473 – $860
Fire risk 2/10 · Minimal
- Est. fire insurance / yr
- $691 – $1,283
Heat risk 4/10 · Minor
- Hot days now (above 98°F)
- 7 days/yr
- Hot days in 30 yrs
- 16 days/yr
Wind risk 3/10 · Minor
- Chance of severe wind over 30 yrs
- 7.0%
Air-quality risk 2/10 · Minimal
- Unhealthy air days now
- 1 days/yr
- Unhealthy air days in 30 yrs
- 1 days/yr
Risk factors via First Street. Map © Google.
Why this score? — see what drove the D grade
The composite is a weighted blend of 9 inputs, each scored 0–100. Each bar is that input's sub-score; the figure is the points it added to the 100-point composite (weight × sub-score).
- Appreciation +10.0/10.0
- ARV discount +7.5/15.0
- Cash flow +6.9/30.0
- Rent growth +5.0/5.0
- Schools +4.8/10.0
- Livability +2.9/5.0
- Condition / age +2.5/5.0
- 1% rule +1.3/10.0
- DSCR +1.1/10.0
$429,000
🖨 Deal sheet (PDF) 📄 Offer letter ✓ Due diligence
Listing remarks MLS
Welcome to 63 Rossman Circle, a beautifully maintained 3-bedroom, 1 and a half bath home set on over a half an acre in the highly regarded Ichabod Crane School District. Thoughtfully updated over the years, this property offers the peace of mind that comes from consistent care and investment. Major improvements include a newer roof, HVAC system, hot water heater, water softener, seamless gutters with leaf guards, vinyl fencing, deck, appliances, and numerous exterior enhancements. The backyard is a true highlight. Fully fenced and designed for both relaxation and entertaining, it features a beautiful in-ground pool with a resurfaced floor, newer liner, updated motor, and safety cover. The spacious deck overlooks the pool and yard, creating an ideal setting for summer gatherings, outdoor dining, or simply enjoying the season at home. Inside, the home offers comfortable living spaces along with a versatile finished area in the basement, perfect for a home office, fitness room, playroom, media room, or additional living space. Conveniently located just minutes from Hudson, Kinderhook, shopping, dining, and major commuter routes, this move-in ready property offers the perfect balance of comfort, outdoor enjoyment, and everyday convenience.
Key facts
- Seamless gutters
- Newer roof
- Water softener
Tags
Property features AI
Exterior
- Parking: Attached garage (1 car total parking)
- Utilities: Public water; Septic tank sewer
- Home design: Single family residence; Living area includes finished space plus below-grade finished area
- Construction: Vinyl siding construction; Basement with Bilco doors, full and unfinished
- Exterior features: Back yard with fencing (fenced); Paved driveway; Exterior lighting
Interior
- Kitchen: Kitchen on second level; Includes dishwasher, microwave, oven, range and refrigerator
- Bedrooms: Bedrooms located on the third level (three bedrooms)
- Bathrooms: One full bathroom on the third level; One half bathroom on the first level
- Heating & cooling: Electric heating with heat pump; Air conditioning via AC pump
- Interior features: Contains 8 total rooms; Fireplace (1)
- Laundry & utility: Washer and dryer included
Neighborhood map
What this means for you Summary
Snapshot
- This is a 3-bed/1.5-bath single-family listed at $429k.
Deal economics
- At list price, monthly cash flow is $-655 ($-8k/yr) — negative.
- To cash-flow at today's rent, offer at most $313k (27.0% below list).
- To meet the 1% rule (rent ≥ 1% of price), the offer needs to be $269k (37.2% below list).
- Recommended offer: $269k (37.2% below list) — sets the bar for 1% rule.
Location & tenants
- Location reads 58/100 on livability (#1,070 in NY) — a working-class tenant base; expect higher turnover. Strengths: crime A, housing A-; Watch: employment D+, amenities F, commute F.
- Kinderhook Central School District (rural): math 49% / reading 59% proficiency, ranked #294 of 590 in NY (top 50%) — acceptable for families but not a draw, mixed tenant base, ~2y average lease.
- Zoned schools: Ichabod Crane Elementary School (math 62% / reading 67%, grade B, #591 of 2,108 statewide, top 31%, 486 students, 40% FRL); Ichabod Crane Middle School (math 34% / reading 57%, grade D+, #337 of 729 statewide, top 47%, 650 students, 44% FRL); Ichabod Crane Senior High School (math 98% / reading 64%, grade A, #485 of 1,100 statewide, top 45%, 555 students, 37% FRL) — zoned schools average 40% FRL vs 21% district-wide (19 pts higher); higher-poverty schools than district average — tighter screening recommended.
- Market conditions: Rents rising fast (+10.9%/yr); 162 active listings in the ZIP; 1 comparable units currently listed for rent nearby; 136 units permitted in Columbia County in 2024 (0 in 5+ unit buildings).
- This rent runs 44% of the median local income ($73k/yr) — at the standard rent-burdened threshold; future hikes will face affordability resistance.
Forward outlook
- In year one you build about $46k of equity ($3k loan paydown + $43k appreciation (10.0% local appreciation)).
- Columbia County population projected at -22% by 2050 — secular population decline; favor cash flow + early exit over multi-decade hold.
- By year 2, paydown + projected appreciation supports a ~$74k cash-out refi (75% LTV) — recoverable capital for the next deal without selling this one.
Negotiation context
- Only 5 days on market — expect competitive offers; lowballing is unlikely to land.
- 2 sale attempts with the ask held roughly flat each time — persistent listings suggest the price (not the market) is what's stuck; bring a comps-based counter.
- Current owner paid $209k; list at $429k implies a 105% gain — meaningful room to come down on a strong offer.
Questions for the listing agent
- What do current leases actually rent for vs. the listed asking? Can we see a recent rent roll and the last 12 months of T-12 income?
- Is there a deadline driving the sale (1031 exchange, divorce, estate, relocation)? That informs how much negotiation room exists.
- Schools are F-rated, which usually means shorter tenancies and higher turnover. Who's the typical renter profile here, and what's been the actual vacancy rate?
- The area grade is low — what's the realistic commute time and amenity access for the typical tenant pool here? Any planned neighborhood developments (good or bad) we should know about?
- What's the average days-on-market for RENTAL listings here right now (not sales)? A rising rental-DOM trend means longer vacancies and softer asking-rent achievability than the comps imply.
- What's the recent tenant-quality profile in this submarket — average credit score on applications, eviction rate, late-payment / NSF rate, and stable-employment percentage? A property-management company in the area should have these aggregated.
- How much new for-sale + rental construction is in the pipeline within 1–3 miles? Heavy new supply typically softens prices + rents 12–24 months out; constrained supply supports both.
Investment metrics
- 1% rule
- 0.63% ✗
- Cap rate
- 4.46%
- Cash-on-cash
- -6.55%
- DSCR
- 0.71
- GRM
- 13.3
CMA / ARV
- ARV (on-the-fly)
- $229,744
- Comps found
- 3
Show comp detail 3 sales within ~0.75 mi
| Address | Dist | Beds/Ba | Sqft | Sold | Price | $/sf | Match |
|---|---|---|---|---|---|---|---|
| 9 Imperial Ln | 0.33mi | 2/1.0 (-1) | 1,494 (+12%) | 10mo | $312,000 | $209 | 49 |
| 219 Route 9J | 0.73mi | 2/1.5 (-1) | 1,304 (-2%) | 21mo | $225,000 | $173 | 40 |
| 43 Majestic Dr | 0.49mi | 4/1.5 (+1) | 1,524 (+15%) | 22mo | $240,000 | $157 | 29 |
Match score weights: distance 35% · size 25% · config 20% · recency 20%. Top-matched comps best support the ARV.
Projected returns pro-forma
10.0% appreciation · 8.0% rent growth · sell at horizon
- IRR
- 20.9%
- Equity multiple
- 2.72×
- Total profit
- $206,070
- Equity at exit
- $386,477
- IRR
- 20.0%
- Equity multiple
- 6.62×
- Total profit
- $674,789
- Equity at exit
- $833,453
Cash invested: $120,120 (down + closing). Projections, not guarantees.
Landlord ↔ Tenant lean methodology
- Overall (STATE)
- 15 Strongly Tenant-Friendly
- State New York
- 15 Strongly Tenant-Friendly · D+10
- County
- — inherits STATE
- City
- — inherits STATE
ZIP-level market 12534
- Home prices YoY
- 5.6%
- Rents YoY
- 10.9%
- Active inventory
- 162
- Price-to-rent
- 13.3×
Monthly cashflow live
- Estimated rent
- $2,694 medium interval (Pro) →
- Mortgage (P&I)
- −$2,250
- Tax from tax record
- −$355 /mo · $4,257/yr
- Insurance
- −$179
- HOA
- −$0
- Vacancy / Maint / Mgmt
- −$566
- Net cashflow
- $-655
Break-even live
Sensitivity live
| Price | -10% $-412 | -5% $-534 | +0% $-655 | +5% $-777 | +10% $-898 |
|---|---|---|---|---|---|
| Rent | -10% $-868 | -5% $-762 | +0% $-655 | +5% $-549 | +10% $-443 |
| Rate | -1.0pp $-439 | -0.5pp $-546 | base $-655 | +0.5pp $-767 | +1.0pp $-880 |
UW: 25.0% down · 7.5% · 30yr · 1.5% tax · 5.0% vac · 8.0% maint · 8.0% mgmt
Financing live
Cash to close
- Down payment
- $107,250
- Closing costs
- $12,870
- Reserves months
- —
- Total cash needed
- —
Loan-product check · same deal, 3 products live
Conventional
25% down · 7.5% · 30yr
- Down + closing
- —
- Monthly P&I
- —
- Monthly cashflow
- —
- DSCR
- —
- Eligible?
- —
Personal DTI + credit; lowest rate.
DSCR
20% down · 8.5% · 30yr
- Down + closing
- —
- Monthly P&I
- —
- Monthly cashflow
- —
- DSCR
- —
- Eligible?
- —
No personal income docs; deal must DSCR.
Hard money
10% down · 12.0% · 12mo
- Down + closing
- —
- Monthly P&I
- —
- Monthly cashflow
- —
- DSCR
- —
- Eligible?
- —
Short-term bridge; refi at stabilization.
Rent comps 1 comps
| Address | Beds | Baths | Sqft | Rent | $/sqft | DOM | Units | Dist |
|---|---|---|---|---|---|---|---|---|
| 1154 U.S. 9 #27 Hudson, NY | 3.0 | 2.0 | 978 | $2,300 | $2.35 | 25d | 1 | 1.00mi |
Listing history 5 events
-
2026-06-22days on market $429,000 Active 5 DOM
-
2026-06-21days on market $429,000 Active 4 DOM
-
2026-06-19days on market $429,000 Active 2 DOM
-
2026-06-18remarks 699-char remark
-
2026-06-18$429,000 Active 1 DOM
ⓘ Source: listings_history table (triggers on properties + properties_extension) + one-shot
backfill from property_details.listing_events for pre-trigger history.
Tax reassessment forecast NY · Partial reset (capped growth)
- Current annual tax
- $4,257 · $355/mo
- Projected year-2 tax
- $5,754 · $479/mo
- Expected delta
- +$1,496/yr (+$125/mo · 35.1%)
ⓘ Screening estimate from a state-policy table — verify with the county assessor before closing.
Climate risk First Street
- Flood 1/10 Low FEMA zone X · 0% chance over 30 yrs
- Wildfire 2/10 Low
- Heat 4/10 Moderate 7 d/yr ≥98°F today · 16 d/yr by 30 yrs out
- Wind 3/10 Moderate 7% chance of damaging wind over 30 yrs
- Air quality 2/10 Low 1 unhealthy d/yr today · 1 by 30 yrs out
Nearby sold comps map
Loading sold comps map…
Walkable amenities ~0.75 mi
Loading nearby amenities…
Taxation est. · year 1
- Rental income
- $32,323
- − Mortgage interest
- −$24,031
- − Property taxes
- −$4,257
- − Insurance
- −$2,145
- − Repairs & maintenance
- −$2,586
- − Management
- −$2,586
- − Depreciation
- −$12,480
- Taxable loss
- −$15,762
- Est. tax savings @ 24.0%
- +$3,783
- After-tax cash flow
- $-4,081/yr
For passive investors: Depreciation is non-cash, so a rental often shows a tax loss while cash-flowing — sheltering income. Rental losses are passive: they offset passive income freely, and up to $25,000/yr can offset ordinary (W-2) income if you actively participate and your MAGI is under $100k (phasing out to $0 by $150k); unused losses carry forward. On sale, claimed depreciation is recaptured at up to 25%, and gains may owe capital-gains tax (a 1031 exchange can defer both). Figures are a year-1 estimate at your 24.0% rate — not tax advice; consult a CPA.
Schools (NCES district)
- District
- Kinderhook Central School District
- NCES district ID
- 3615210
- Math proficiency
- 49% ▼ -10.00%
- Reading proficiency
- 59% ▲ 1.00%
- Median HH income
- $68,409
- Composite
- 47.82/100
- National rank
- #2223
- State rank
- #294 of 590 in NY
Livability — Stottville
- Score
- 58/100
- State rank
- #1070
- US rank
- #21454
Category grades
Schools grade is shown separately in the Schools card above.
Census & demographics
- County
- Columbia County · 17,176 people
- City population
- 184
- Metro
- Hudson, NY
- Population (ZIP)
- 17,176
- Household income
- $72,741
- Rent vs Own
- Severe rent burden
- 1083.0
Population outlook (Columbia County) Hauer SSP2
- Today (2025)
- 58,662 people
- By 2030
- 56,557 · -3.6%
- By 2040
- 51,324 · -12.5%
- By 2050
- 45,790 · -21.9%
- By 2075
- 35,232 · -39.9%
- By 2100
- 25,846 · -55.9%
Race, ethnicity, and origin ACS 2023
- Neighborhood character
- Predominantly White (74%)
- Race & ethnicity
- White 74% Two or more races 7% Black 7% Hispanic / Latino 7% Asian 6%
- Hispanic origin (detail)
- Mexican 2% Puerto Rican 1%
- Common ancestry
- Lithuanian 4% Romanian 4% Iranian 3%
- Foreign-born
- 10% · Canada, China
- Languages at home
- 88% English-only · Spanish 5% Other Indo-European 3% Chinese 1%
Political lean MEDSL · Columbia
- 2024 margin
- D (+14.7) · D 57.4% · R 42.6%
- 2008→2024 swing
- +1.3pp toward D · 2008: 13.4pp · 2024: 14.7pp
- All cycles
- 2024: D+14.7 2020: D+16.7 2016: D+1.4 2012: D+11.7 2008: D+13.4
Not yet ingested
- Civics
- —
Market trends
- HPI YoY
- ▲ 25.98%
- Current HPI
- 490.0412
- Rent YoY
- ▲ 10.88%
- Metro
- Hudson, NY
- State GDP YoY
- ▲ 2.60%
- F500 in state
- 92
Industry mix (Fortune 500 HQ in NY)
| Industry | F500 HQs | Revenue |
|---|---|---|
| Financial Services | 10 | $950B |
|
||
| Consumer Goods | 9 | $162B |
|
||
| Insurance | 4 | $225B |
|
||
| Telecommunications | 2 | $144B |
|
||
| Pharmaceuticals | 2 | $112B |
|
||
| Media / Entertainment | 2 | $69B |
|
||
Price history
+105.3% since first listed3 events — show timeline
- 2026-06-17 Listed $429,000 HVCRMLS
- 2026-06-17 Listed $429,000 Global MLS
- 2005-11-29 Sold (Public Records) $209,000 Public Records
Property tax history
-0.5%/yrLatest (2025): $4,257 · -2.3% YoY. Source: county tax records.
Cash-flow waterfall
monthlySold comps — $/sqft
last 12 mo · ≤1 miLoading sold comps…