327 Shady Ln · Meridianville, AL
Flood risk 1/10 · Minimal
- FEMA flood zone
- X (unshaded)
- Chance of flooding over 30 yrs
- 0.0%
- Est. flood insurance / yr
- $507 – $1,088
Fire risk 4/10 · Minor
- Est. fire insurance / yr
- $916 – $1,700
Heat risk 5/10 · Moderate
- Hot days now (above 105°F)
- 7 days/yr
- Hot days in 30 yrs
- 19 days/yr
Wind risk 4/10 · Minor
- Chance of severe wind over 30 yrs
- 18.0%
Air-quality risk 1/10 · Minimal
- Unhealthy air days now
- 0 days/yr
- Unhealthy air days in 30 yrs
- 0 days/yr
Risk factors via First Street. Map © Google.
Why this score? — see what drove the D grade
The composite is a weighted blend of 9 inputs, each scored 0–100. Each bar is that input's sub-score; the figure is the points it added to the 100-point composite (weight × sub-score).
- Cash flow +10.8/30.0
- Appreciation +10.0/10.0
- ARV discount +4.8/15.0
- Schools +3.7/10.0
- Livability +3.2/5.0
- DSCR +3.1/10.0
- Rent growth +2.5/5.0
- Condition / age +2.5/5.0
- 1% rule +2.2/10.0
$236,000
🖨 Deal sheet (PDF) 📄 Offer letter ✓ Due diligence
Listing remarks MLS
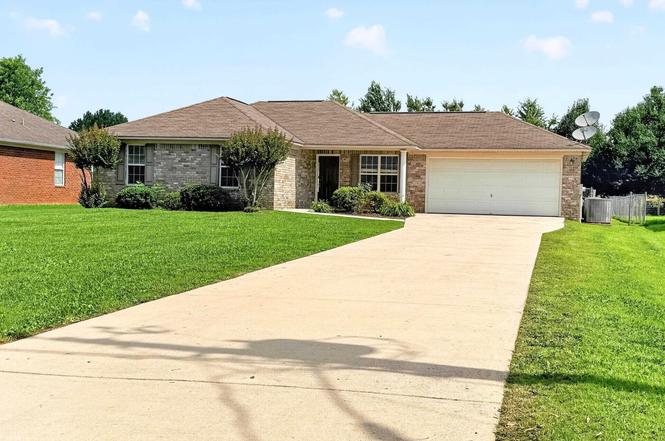
FULL BRICK, 4 BED AND 2 BATH HOME. KITCHEN WITH NEW COUNTERS AND FLOORING OPENS TO THE BREAKFAST AREA. INVITING LIVING ROOM WITH NEW FLOORING. 2 FULL BATHS WITH ONE IN THE ISOLATED MASTER SUITE. COVERED FRONT PORCH WITH FENCED BACKYARD WITH PATIO.
Key facts
- Full brick
- Open layout
- Brick construction
Tags
Property features AI
Finance
- HOA & community: No association; Subdivision: Metes And Bounds
Exterior
- Parking: Attached garage
- Utilities: Public water; Electric heating and central cooling
- Home design: Single-family residence; Built in 2003; Brick and vinyl siding exterior; Slab foundation
- Construction: One-story; Brick and vinyl siding construction; Slab foundation; Built in 2003
- Exterior features: Public water
Interior
- Bathrooms: 2 full bathrooms
- Heating & cooling: Central cooling; Electric heating
- Interior features: One-level living
Neighborhood map
What this means for you Summary
Snapshot
- This is a 4-bed/1.0-bath single-family listed at $236k.
Deal economics
- At list price, monthly cash flow is $-110 ($-1k/yr) — negative.
- To cash-flow at today's rent, offer at most $217k (8.2% below list).
- To meet the 1% rule (rent ≥ 1% of price), the offer needs to be $170k (27.8% below list).
- Recommended offer: $170k (27.8% below list) — sets the bar for 1% rule.
- Cap rate 5.7% vs local median 3.6% in Meridianville — top-decile yield for the area; either an underpriced asset or a hidden risk that comps aren't pricing in. Stress-test before assuming the spread holds.
Location & tenants
- Location reads 65/100 on livability (#118 in AL) — a middle-class / working-renter tenant base. Strengths: cost of living A+, housing A+, crime A; Watch: amenities F, commute F, health & safety F.
- Madison County (rural): math 27% / reading 56% proficiency, ranked #19 of 129 in AL (top 15%) — families likely to look elsewhere, expect single-tenant / working-renter base with shorter leases.
- Zoned schools: Madison Cross Roads Elementary School (math 14% / reading 48%, grade F, #360 of 627 statewide, top 58%, 1,035 students, 59% FRL); Sparkman Middle School (math 18% / reading 53%, grade F, #81 of 257 statewide, top 33%, 859 students, 60% FRL); Sparkman High School (math 28% / reading 37%, grade F, #58 of 305 statewide, top 19%, 1,738 students, 37% FRL) — zoned schools average 52% FRL vs 29% district-wide (23 pts higher); higher-poverty schools than district average — tighter screening recommended.
- Market conditions: 260 active listings in the ZIP; 3 comparable units currently listed for rent nearby; rentals at typical pace (median 25d on market — plan ~3-4 weeks tenant-placement turnaround); 4,709 units permitted in Madison County in 2024 (1,186 in 5+ unit buildings).
Forward outlook
- In year one you build about $25k of equity ($2k loan paydown + $24k appreciation (10.0% local appreciation)).
- Madison County population projected at +18% by 2050 — long-run rental-demand tailwind backs the buy-and-hold thesis.
- By year 2, paydown + projected appreciation supports a ~$41k cash-out refi (75% LTV) — recoverable capital for the next deal without selling this one.
Negotiation context
- Only 2 days on market — expect competitive offers; lowballing is unlikely to land.
- 3 sale attempts since 14y ago with the ask held roughly flat each time — persistent listings suggest the price (not the market) is what's stuck; bring a comps-based counter.
- Current owner paid $150k; list at $236k implies a 57% gain — meaningful room to come down on a strong offer.
Risks & watch-outs
- Climate carrying-cost: extreme-heat days projected 7→19/yr by 2055 (HVAC capex compounding) — expect insurance premiums to compound above CPI over the hold.
Questions for the listing agent
- What do current leases actually rent for vs. the listed asking? Can we see a recent rent roll and the last 12 months of T-12 income?
- Is there a deadline driving the sale (1031 exchange, divorce, estate, relocation)? That informs how much negotiation room exists.
- The area grade is low — what's the realistic commute time and amenity access for the typical tenant pool here? Any planned neighborhood developments (good or bad) we should know about?
- What's the average days-on-market for RENTAL listings here right now (not sales)? A rising rental-DOM trend means longer vacancies and softer asking-rent achievability than the comps imply.
- What's the recent tenant-quality profile in this submarket — average credit score on applications, eviction rate, late-payment / NSF rate, and stable-employment percentage? A property-management company in the area should have these aggregated.
- How much new for-sale + rental construction is in the pipeline within 1–3 miles? Heavy new supply typically softens prices + rents 12–24 months out; constrained supply supports both.
Investment metrics
- 1% rule
- 0.72% ✗
- Cap rate
- 5.73%
- Cash-on-cash
- -2.00%
- DSCR
- 0.91
- GRM
- 11.5
CMA / ARV
- ARV (on-the-fly)
- $222,775
- Comps found
- 4
Show comp detail 4 sales within ~0.75 mi
| Address | Dist | Beds/Ba | Sqft | Sold | Price | $/sf | Match |
|---|---|---|---|---|---|---|---|
| 339 Shady Ln | 0.03mi | 4/2.0 | 1,300 (+2%) | 3mo | $212,000 | $163 | 89 |
| 321 Shady Ln | 0.02mi | 3/2.0 (-1) | 1,263 (-1%) | 8mo | $196,310 | $155 | 82 |
| 509 Shady Ln | 0.28mi | 3/2.0 (-1) | 1,343 (+6%) | 16mo | $237,000 | $176 | 56 |
| 202 Travis Dr | 0.40mi | 3/2.0 (-1) | 1,085 (-15%) | 12mo | $189,900 | $175 | 38 |
Match score weights: distance 35% · size 25% · config 20% · recency 20%. Top-matched comps best support the ARV.
Projected returns pro-forma
10.0% appreciation · 3.0% rent growth · sell at horizon
- IRR
- 22.8%
- Equity multiple
- 2.84×
- Total profit
- $121,445
- Equity at exit
- $212,607
- IRR
- 20.4%
- Equity multiple
- 6.49×
- Total profit
- $362,983
- Equity at exit
- $458,496
Cash invested: $66,080 (down + closing). Projections, not guarantees.
Landlord ↔ Tenant lean methodology
- Overall (STATE)
- 90 Strongly Landlord-Friendly
- State Alabama
- 90 Strongly Landlord-Friendly · R+15
- County
- — inherits STATE
- City
- — inherits STATE
ZIP-level market 35750
- Home prices YoY
- 8.2%
- Active inventory
- 260
- Price-to-rent
- 11.5×
Monthly cashflow live
- Estimated rent
- $1,705 medium interval (Pro) →
- Mortgage (P&I)
- −$1,238
- Tax from tax record
- −$121 /mo · $1,451/yr
- Insurance
- −$98
- HOA
- −$0
- Vacancy / Maint / Mgmt
- −$358
- Net cashflow
- $-110
Break-even live
Sensitivity live
| Price | -10% $24 | -5% $-43 | +0% $-110 | +5% $-177 | +10% $-244 |
|---|---|---|---|---|---|
| Rent | -10% $-245 | -5% $-177 | +0% $-110 | +5% $-43 | +10% $25 |
| Rate | -1.0pp $9 | -0.5pp $-50 | base $-110 | +0.5pp $-171 | +1.0pp $-233 |
UW: 25.0% down · 7.5% · 30yr · 1.5% tax · 5.0% vac · 8.0% maint · 8.0% mgmt
Financing live
Cash to close
- Down payment
- $59,000
- Closing costs
- $7,080
- Reserves months
- —
- Total cash needed
- —
Loan-product check · same deal, 3 products live
Conventional
25% down · 7.5% · 30yr
- Down + closing
- —
- Monthly P&I
- —
- Monthly cashflow
- —
- DSCR
- —
- Eligible?
- —
Personal DTI + credit; lowest rate.
DSCR
20% down · 8.5% · 30yr
- Down + closing
- —
- Monthly P&I
- —
- Monthly cashflow
- —
- DSCR
- —
- Eligible?
- —
No personal income docs; deal must DSCR.
Hard money
10% down · 12.0% · 12mo
- Down + closing
- —
- Monthly P&I
- —
- Monthly cashflow
- —
- DSCR
- —
- Eligible?
- —
Short-term bridge; refi at stabilization.
Rent comps 3 comps
| Address | Beds | Baths | Sqft | Rent | $/sqft | DOM | Units | Dist |
|---|---|---|---|---|---|---|---|---|
| 108 Jude Ln Hazel Green, AL | 3.0 | 2.0 | 1720 | $1,823 | $1.06 | 25d | 1 | 0.86mi |
| 170 Stafford Rd Hazel Green, AL | 3.0 | 2.0 | 1068 | $1,350 | $1.26 | 25d | 1 | 1.42mi |
| 166 Stafford Rd Hazel Green, AL | 3.0 | 2.0 | 1300 | $1,450 | $1.12 | 45d | 1 | 1.43mi |
Listing history 2 events
-
2026-06-22remarks 319-char remark
-
2026-06-22$236,000 Active 2 DOM
ⓘ Source: listings_history table (triggers on properties + properties_extension) + one-shot
backfill from property_details.listing_events for pre-trigger history.
Tax reassessment forecast AL · Resets to sale price
- Current annual tax
- $1,451 · $121/mo
- Projected year-2 tax
- $1,451 · $121/mo
- Expected delta
- $0/yr ($0/mo · 0.0%)
ⓘ Screening estimate from a state-policy table — verify with the county assessor before closing.
Climate risk First Street
- Flood 1/10 Low FEMA zone X (unshaded) · 0% chance over 30 yrs
- Wildfire 4/10 Moderate
- Heat 5/10 Major 7 d/yr ≥105°F today · 19 d/yr by 30 yrs out
- Wind 4/10 Moderate 18% chance of damaging wind over 30 yrs
- Air quality 1/10 Low 0 unhealthy d/yr today · 0 by 30 yrs out
Nearby sold comps map
Loading sold comps map…
Walkable amenities ~0.75 mi
Loading nearby amenities…
Taxation est. · year 1
- Rental income
- $20,458
- − Mortgage interest
- −$13,220
- − Property taxes
- −$1,451
- − Insurance
- −$1,180
- − Repairs & maintenance
- −$1,637
- − Management
- −$1,637
- − Depreciation
- −$6,865
- Taxable loss
- −$5,531
- Est. tax savings @ 24.0%
- +$1,327
- After-tax cash flow
- $7/yr
For passive investors: Depreciation is non-cash, so a rental often shows a tax loss while cash-flowing — sheltering income. Rental losses are passive: they offset passive income freely, and up to $25,000/yr can offset ordinary (W-2) income if you actively participate and your MAGI is under $100k (phasing out to $0 by $150k); unused losses carry forward. On sale, claimed depreciation is recaptured at up to 25%, and gains may owe capital-gains tax (a 1031 exchange can defer both). Figures are a year-1 estimate at your 24.0% rate — not tax advice; consult a CPA.
Schools (NCES district)
- District
- Madison County
- NCES district ID
- 0102220
- Math proficiency
- 27% ▼ -32.00%
- Reading proficiency
- 56% ▼ -1.00%
- Median HH income
- $66,058
- Composite
- 37.15/100
- National rank
- #4483
- State rank
- #19 of 129 in AL
Livability — Meridianville
- Score
- 65/100
- State rank
- #118
- US rank
- #12516
Category grades
Schools grade is shown separately in the Schools card above.
Census & demographics
- County
- Madison County · 380,832 people
- City population
- 14,103
- Metro
- Huntsville, AL
- Population (ZIP)
- 13,413
- Household income
- $68,389
- Rent vs Own
- Severe rent burden
- 162.0
Population outlook (Madison County) Hauer SSP2
- Today (2025)
- 392,086 people
- By 2030
- 409,788 · +4.5%
- By 2040
- 440,557 · +12.4%
- By 2050
- 460,990 · +17.6%
- By 2075
- 502,872 · +28.3%
- By 2100
- 513,623 · +31.0%
Race, ethnicity, and origin ACS 2023
- Neighborhood character
- Predominantly White (71%)
- Race & ethnicity
- White 71% Black 19% Asian 5% Two or more races 3% Hispanic / Latino 2%
- Common ancestry
- Slovak 1% Serbian 1% Romanian 1%
- Foreign-born
- 3% · Canada
- Languages at home
- 95% English-only · Spanish 2% Chinese 1% Korean 1%
Political lean MEDSL · Madison
- 2024 margin
- Lean R (+9.0) · D 44.7% · R 53.7% · Other 1.6%
- 2008→2024 swing
- +6.0pp toward D · 2008: -14.9pp · 2024: -9.0pp
- All cycles
- 2024: R+9.0 2020: R+8.0 2016: R+16.8 2012: R+18.7 2008: R+14.9
Not yet ingested
- Civics
- —
Market trends
- HPI YoY
- ▲ 33.59%
- Current HPI
- 444.7418
- Rent YoY
- —
- Metro
- Huntsville, AL
- State GDP YoY
- ▲ 2.94%
- F500 in state
- 4
Industry mix (Fortune 500 HQ in AL)
| Industry | F500 HQs | Revenue |
|---|---|---|
| Financial Services | 1 | $8B |
|
||
| Healthcare | 1 | $5B |
|
||
Price history
+118.7% since first listed10 events — show timeline
- 2026-06-19 Listed $236,000 VMLS
- 2021-04-22 Sold (Public Records) $150,000 Public Records
- 2021-04-14 Sold (MLS) $150,000 VMLS
- 2021-03-03 Contingent — VMLS
- 2021-02-25 Delisted — VMLS
- 2021-01-22 Contingent — VMLS
- 2021-01-21 Listed $150,000 VMLS
- 2012-09-18 Sold (Public Records) $107,900 Public Records
- 2012-09-17 Sold (MLS) $107,900 VMLS
- 2012-06-13 Listed $107,900 VMLS
Property tax history
+16.6%/yrLatest (2024): $1,451 · +0.0% YoY. Source: county tax records.
Cash-flow waterfall
monthlySold comps — $/sqft
last 12 mo · ≤1 miLoading sold comps…