2815 Burke Ave · West Plains, MO
Flood risk No data
- FEMA flood zone
- —
- Chance of flooding over 30 yrs
- —
- Est. flood insurance / yr
- —
Fire risk No data
- Est. fire insurance / yr
- —
Heat risk No data
- Hot days now (above threshold)
- —
- Hot days in 30 yrs
- —
Wind risk No data
- Chance of severe wind over 30 yrs
- —
Air-quality risk No data
- Unhealthy air days now
- —
- Unhealthy air days in 30 yrs
- —
Risk factors via First Street. Map © Google.
Why this score? — see what drove the D grade
The composite is a weighted blend of 9 inputs, each scored 0–100. Each bar is that input's sub-score; the figure is the points it added to the 100-point composite (weight × sub-score).
- ARV discount +15.0/15.0
- Cash flow +10.1/30.0
- Livability +3.9/5.0
- Schools +3.4/10.0
- DSCR +2.9/10.0
- Rent growth +2.5/5.0
- Condition / age +2.5/5.0
- 1% rule +1.9/10.0
- Appreciation +0.0/10.0
$150,000
🖨 Deal sheet 📄 Offer letter ✓ Due diligence
Listing remarks MLS
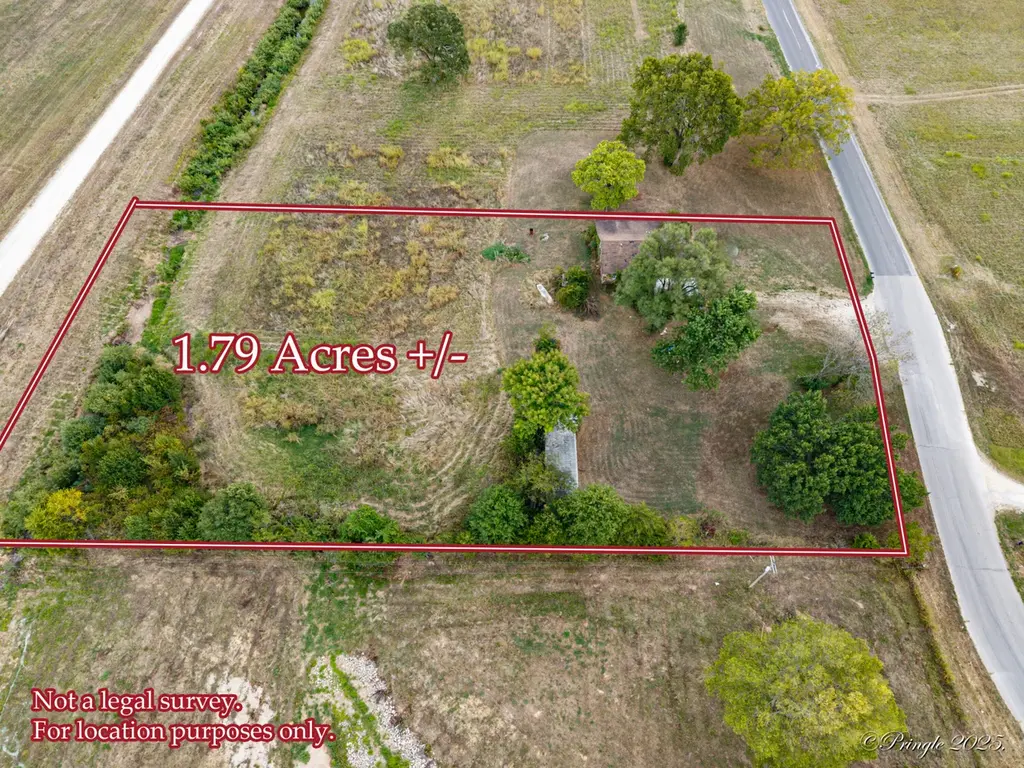
1.79+/- acres zoned R3 for multifamily housing. The property does include a house selling as is. The house is occupied but is valued at very little.
Key facts
- 1.79 acre lot
- Built 1930
- Listed 260 days
Neighborhood map
What this means for you Summary
Snapshot
- This is a 2-bed/1.0-bath other listed at $150k.
Deal economics
- At list price, monthly cash flow is $-89 ($-1k/yr) — negative.
- To cash-flow at today's rent, offer at most $134k (10.5% below list).
- To meet the 1% rule (rent ≥ 1% of price), the offer needs to be $104k (30.9% below list).
- Recommended offer: $104k (30.9% below list) — sets the bar for 1% rule.
- Cap rate 5.6% vs local median 3.1% in West Plains — top-decile yield for the area; either an underpriced asset or a hidden risk that comps aren't pricing in. Stress-test before assuming the spread holds.
Location & tenants
- Location reads 77/100 on livability (#34 in MO, #2,977 nationally) — a middle-class / working-renter tenant base. Strengths: cost of living A+, health & safety A+, housing A-; Watch: crime C-, commute C-, schools D.
- West Plains R-VII (rural): math 36% / reading 46% proficiency, ranked #152 of 324 in MO (top 47%) — families likely to look elsewhere, expect single-tenant / working-renter base with shorter leases.
- Market conditions: 315 active listings in the ZIP; 53 units permitted in Howell County in 2024 (0 in 5+ unit buildings).
Forward outlook
- Local home prices are declining (-3.0%/yr); year-one equity from $1k of loan paydown is wiped out by about $4k of value loss. Plan a longer hold.
- Howell County population projected at -18% by 2050 — secular population decline; favor cash flow + early exit over multi-decade hold.
Negotiation context
- It's been on market 261 days — a 12% lower offer ($132k) is reasonable based on typical stale-listing flexibility.
Risks & watch-outs
- Watch-outs: built in 1930 — expect roof / HVAC / electrical / plumbing capex.
Questions for the listing agent
- What do current leases actually rent for vs. the listed asking? Can we see a recent rent roll and the last 12 months of T-12 income?
- It's been on market 261 days. Have you received any prior offers? Is the seller open to a 31% concession, seller financing, or rate buy-down credit?
- Built in 1930 — when were the roof, HVAC, electrical panel, plumbing, and water heater last replaced?
- Why hasn't it sold? Are there any deal-killer items the seller is aware of (foundation, flood, title, zoning, code violations)?
- Is there a deadline driving the sale (1031 exchange, divorce, estate, relocation)? That informs how much negotiation room exists.
- Schools are D-rated, which usually means shorter tenancies and higher turnover. Who's the typical renter profile here, and what's been the actual vacancy rate?
- The area grade is low — what's the realistic commute time and amenity access for the typical tenant pool here? Any planned neighborhood developments (good or bad) we should know about?
- What's the average days-on-market for RENTAL listings here right now (not sales)? A rising rental-DOM trend means longer vacancies and softer asking-rent achievability than the comps imply.
- What's the recent tenant-quality profile in this submarket — average credit score on applications, eviction rate, late-payment / NSF rate, and stable-employment percentage? A property-management company in the area should have these aggregated.
- How much new for-sale + rental construction is in the pipeline within 1–3 miles? Heavy new supply typically softens prices + rents 12–24 months out; constrained supply supports both.
Investment metrics
- 1% rule
- 0.69% ✗
- Cap rate
- 5.58%
- Cash-on-cash
- -2.55%
- DSCR
- 0.89
- GRM
- 12.1
CMA / ARV
- ARV (median comp)
- $197,586
- List price
- $150,000
- Delta
- -24.08%
- Verdict
- UNDERPRICED
- Comps
- 20 within 1.0 mi
Projected returns pro-forma
-3.0% appreciation · 3.0% rent growth · sell at horizon
- IRR
- -20.6%
- Equity multiple
- 0.28×
- Total profit
- $-30,045
- Equity at exit
- $22,365
- IRR
- -13.9%
- Equity multiple
- 0.20×
- Total profit
- $-33,728
- Equity at exit
- $12,969
Cash invested: $42,000 (down + closing). Projections, not guarantees.
Landlord ↔ Tenant lean methodology
- Overall (STATE)
- 81 Strongly Landlord-Friendly
- State Missouri
- 81 Strongly Landlord-Friendly · R+10
- County
- — inherits STATE
- City
- — inherits STATE
ZIP-level market 65775
- Home prices YoY
- -16.4%
- Active inventory
- 315
- Price-to-rent
- 12.1×
Monthly cashflow live
- Estimated rent
- $1,036 medium interval (Pro) →
- Mortgage (P&I)
- −$787
- Tax from tax record
- −$59 /mo · $705/yr
- Insurance
- −$62
- HOA
- −$0
- Vacancy / Maint / Mgmt
- −$218
- Net cashflow
- $-89
Break-even live
UW: 25.0% down · 7.5% · 30yr · 1.5% tax · 5.0% vac · 8.0% maint · 8.0% mgmt
Financing live
Cash to close
- Down payment
- $37,500
- Closing costs
- $4,500
- Reserves months
- —
- Total cash needed
- —
Loan-product check · same deal, 3 products live
Conventional
25% down · 7.5% · 30yr
- Down + closing
- —
- Monthly P&I
- —
- Monthly cashflow
- —
- DSCR
- —
- Eligible?
- —
Personal DTI + credit; lowest rate.
DSCR
20% down · 8.5% · 30yr
- Down + closing
- —
- Monthly P&I
- —
- Monthly cashflow
- —
- DSCR
- —
- Eligible?
- —
No personal income docs; deal must DSCR.
Hard money
10% down · 12.0% · 12mo
- Down + closing
- —
- Monthly P&I
- —
- Monthly cashflow
- —
- DSCR
- —
- Eligible?
- —
Short-term bridge; refi at stabilization.
Listing history 18 events
-
2026-06-18days on market $150,000 Active 261 DOM
-
2026-06-17days on market $150,000 Active 260 DOM
-
2026-06-16days on market $150,000 Active 259 DOM
-
2026-06-15days on market $150,000 Active 258 DOM
-
2026-06-13days on market $150,000 Active 256 DOM
-
2026-06-12days on market $150,000 Active 255 DOM
-
2026-06-09days on market $150,000 Active 252 DOM
-
2026-06-08days on market $150,000 Active 251 DOM
-
2026-06-07days on market $150,000 Active 250 DOM
-
2026-06-07days on market $150,000 Active 249 DOM
-
2026-06-04days on market $150,000 Active 246 DOM
-
2026-06-02days on market $150,000 Active 245 DOM
-
2026-06-01days on market $150,000 Active 244 DOM
-
2026-05-31days on market $150,000 Active 243 DOM
-
2025-09-30$150,000 Active 148-char remark
Show marketing remark (148 chars)
1.79+/- acres zoned R3 for multifamily housing. The property does include a house selling as is. The house is occupied but is valued at very little.
-
2025-09-22soldstatus
-
2015-05-22soldstatus
-
1979-06-21soldstatus
ⓘ Source: listings_history table (triggers on properties + properties_extension) + one-shot
backfill from property_details.listing_events for pre-trigger history.
Tax reassessment forecast MO · Resets to sale price
- Current annual tax
- $705 · $59/mo
- Projected year-2 tax
- $1,455 · $121/mo
- Expected delta
- +$750/yr (+$62/mo · 106.3%)
ⓘ Screening estimate from a state-policy table — verify with the county assessor before closing.
Nearby sold comps map
Loading sold comps map…
Walkable amenities ~0.75 mi
Loading nearby amenities…
Taxation est. · year 1
- Rental income
- $12,437
- − Mortgage interest
- −$8,402
- − Property taxes
- −$705
- − Insurance
- −$750
- − Repairs & maintenance
- −$995
- − Management
- −$995
- − Depreciation
- −$4,364
- Taxable loss
- −$3,774
- Est. tax savings @ 24.0%
- +$906
- After-tax cash flow
- $-163/yr
For passive investors: Depreciation is non-cash, so a rental often shows a tax loss while cash-flowing — sheltering income. Rental losses are passive: they offset passive income freely, and up to $25,000/yr can offset ordinary (W-2) income if you actively participate and your MAGI is under $100k (phasing out to $0 by $150k); unused losses carry forward. On sale, claimed depreciation is recaptured at up to 25%, and gains may owe capital-gains tax (a 1031 exchange can defer both). Figures are a year-1 estimate at your 24.0% rate — not tax advice; consult a CPA.
Schools (NCES district)
- District
- West Plains R-VII
- NCES district ID
- 2931680
- Math proficiency
- 36% ▼ -5.00%
- Reading proficiency
- 46% ▲ 1.00%
- Median HH income
- $32,206
- Composite
- 33.59/100
- National rank
- #5419
- State rank
- #152 of 324 in MO
Livability — West Plains
- Score
- 77/100
- State rank
- #34
- US rank
- #2977
Category grades
Schools grade is shown separately in the Schools card above.
Census & demographics
- Census place
- West Plains, MO
- Population (ZIP)
- 24,950
Population outlook (Howell County) Hauer SSP2
- Today (2025)
- 38,462 people
- By 2030
- 37,240 · -3.2%
- By 2040
- 34,495 · -10.3%
- By 2050
- 31,450 · -18.2%
- By 2075
- 23,660 · -38.5%
- By 2100
- 16,373 · -57.4%
Race, ethnicity, and origin ACS 2023
- Neighborhood character
- Predominantly White (94%)
- Race & ethnicity
- White 94% Two or more races 4% Hispanic / Latino 2%
- Common ancestry
- Lithuanian 2% Portuguese 2% Slovak 1%
- Foreign-born
- 1% · Canada
- Languages at home
- 97% English-only · Spanish 1% German/W. Germanic 1%
Political lean MEDSL · Howell
- 2024 margin
- Solid R (+66.8) · D 16.2% · R 83.0%
- 2008→2024 swing
- -36.0pp toward R · 2008: -30.8pp · 2024: -66.8pp
- All cycles
- 2024: R+66.8 2020: R+64.2 2016: R+63.2 2012: R+43.8 2008: R+30.8
Not yet ingested
- Civics
- —
Market trends
- HPI YoY
- ▼ -44.99%
- Current HPI
- 228.8763
- Rent YoY
- —
- Metro
- —
- State GDP YoY
- ▲ 1.84%
- F500 in state
- 20
Industry mix (Fortune 500 HQ in MO)
| Industry | F500 HQs | Revenue |
|---|---|---|
| Healthcare | 1 | $163B |
|
||
| Insurance | 1 | $21B |
|
||
| Industrial Technology | 1 | $17B |
|
||
| Retail | 1 | $16B |
|
||
| Industrial Distribution | 1 | $10B |
|
||
| Utilities | 1 | $9B |
|
||
Price history
4 events — show timeline
- 2025-09-30 Listed $150,000 SOMO
- 2025-09-22 Sold (Public Records) — Public Records
- 2015-05-22 Sold (Public Records) — Public Records
- 1979-06-21 Sold (Public Records) — Public Records
Property tax history
-3.9%/yrLatest (2025): $705 · +9.6% YoY. Source: county tax records.
Cash-flow waterfall
monthlySold comps — $/sqft
last 12 mo · ≤1 miLoading sold comps…