 Multi-family
Pkg Highway 25 · Lynn, AR
Flood risk No data
- FEMA flood zone
- —
- Chance of flooding over 30 yrs
- —
- Est. flood insurance / yr
- —
Fire risk No data
- Est. fire insurance / yr
- —
Heat risk No data
- Hot days now (above threshold)
- —
- Hot days in 30 yrs
- —
Wind risk No data
- Chance of severe wind over 30 yrs
- —
Air-quality risk No data
- Unhealthy air days now
- —
- Unhealthy air days in 30 yrs
- —
Risk factors via First Street. Map © Google.
Why this score? — see what drove the F grade
The composite is a weighted blend of 9 inputs, each scored 0–100. Each bar is that input's sub-score; the figure is the points it added to the 100-point composite (weight × sub-score).
- ARV discount +7.5/15.0
- Appreciation +5.0/10.0
- Schools +3.9/10.0
- Livability +2.8/5.0
- Cash flow +2.5/30.0
- Rent growth +2.5/5.0
- Condition / age +2.2/5.0
- 1% rule +0.0/10.0
- DSCR +0.0/10.0
$340,000
🖨 Deal sheet 📄 Offer letter ✓ Due diligence
Multi-family units
County records classify this as Multi-Family (5+ Unit). Listing-text estimate: 1 unit. estimate disagrees with records
5+ unit building — per-unit beds/baths from public records are typically unavailable; the breakdown below (if shown) is an estimate from the listing text.
Listing remarks MLS
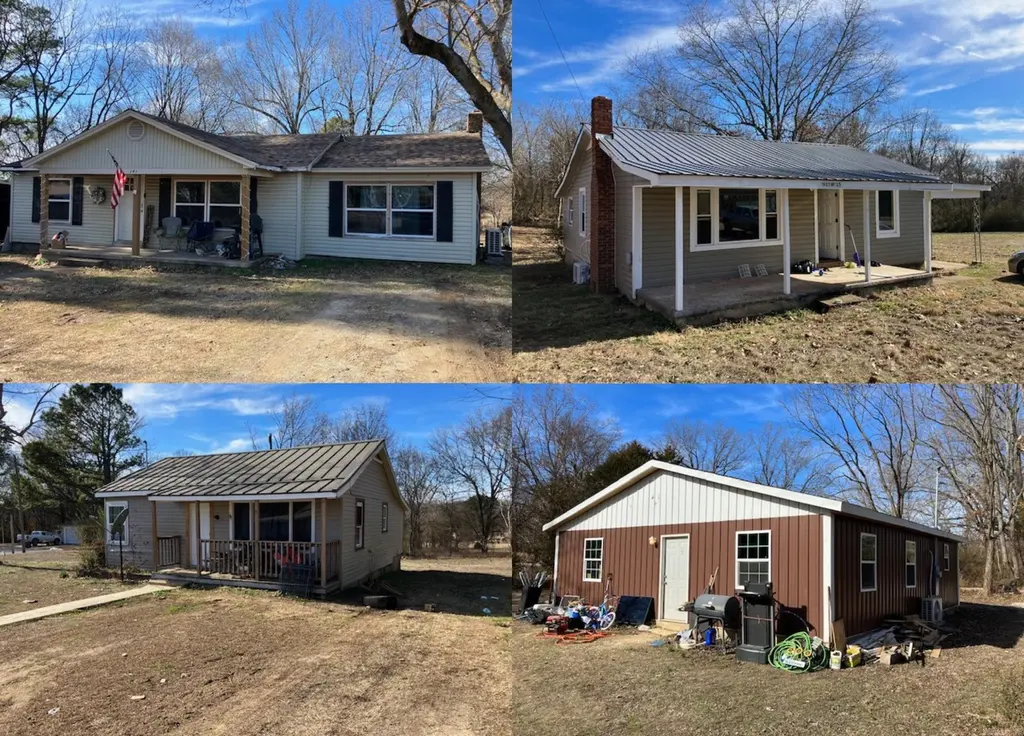
Here is an opportunity to start or add to your real estate portfolio with a package of six single family houses on four separate parcels. This package deal consist of two one bedroom, 3 two bedroom, and one 3 bedroom houses all currently rented. Gross income is $3500/monthly. All houses are in city limits and have city utilities. Addresses are 229 Hwy 25, 190 Hwy 25, 141 Hwy 25, and 653 Hwy 25.
Key facts
- 1 acre lot
- 4 parking spots
- Built 1985
Neighborhood map
What this means for you Summary
Snapshot
- This is a 11-bed/?-bath multifamily listed at $340k. Condition is rated fair.
Deal economics
- At list price, monthly cash flow is $-1k ($-14k/yr) — negative.
- To cash-flow at today's rent, offer at most $169k (50.2% below list).
- To meet the 1% rule (rent ≥ 1% of price), the offer needs to be $148k (56.5% below list).
- Recommended offer: $148k (56.5% below list) — sets the bar for 1% rule.
Location & tenants
- Location reads 56/100 on livability (#397 in AR) — a working-class tenant base; expect higher turnover. Strengths: cost of living A+, housing A+; Watch: schools D, employment D, crime F.
- Hillcrest School District (rural): math 47% / reading 46% proficiency, ranked #31 of 238 in AR (top 13%) — families likely to look elsewhere, expect single-tenant / working-renter base with shorter leases.
- Market conditions: 3 active listings in the ZIP; 63 units permitted in Lawrence County in 2024 (15 in 5+ unit buildings).
Forward outlook
- In year one you build about $13k of equity ($2k loan paydown + $10k appreciation (3.0% local appreciation)).
- Lawrence County population projected at -23% by 2050 — secular population decline; favor cash flow + early exit over multi-decade hold.
- By year 3, paydown + projected appreciation supports a ~$31k cash-out refi (75% LTV) — recoverable capital for the next deal without selling this one.
Negotiation context
- It's been on market 128 days — a 12% lower offer ($299k) is reasonable based on typical stale-listing flexibility.
Questions for the listing agent
- What do current leases actually rent for vs. the listed asking? Can we see a recent rent roll and the last 12 months of T-12 income?
- It's been on market 128 days. Have you received any prior offers? Is the seller open to a 56% concession, seller financing, or rate buy-down credit?
- Have any recent inspections been done? Can we get a copy of the seller's disclosures and any deferred-maintenance estimates?
- Why hasn't it sold? Are there any deal-killer items the seller is aware of (foundation, flood, title, zoning, code violations)?
- Is there a deadline driving the sale (1031 exchange, divorce, estate, relocation)? That informs how much negotiation room exists.
- Schools are D-rated, which usually means shorter tenancies and higher turnover. Who's the typical renter profile here, and what's been the actual vacancy rate?
- Crime grade is F in this area — have there been break-ins, vandalism, or insurance claims at this property in the last 3 years? What carrier currently insures it and at what premium?
- The area grade is low — what's the realistic commute time and amenity access for the typical tenant pool here? Any planned neighborhood developments (good or bad) we should know about?
- What's the average days-on-market for RENTAL listings here right now (not sales)? A rising rental-DOM trend means longer vacancies and softer asking-rent achievability than the comps imply.
- What's the recent tenant-quality profile in this submarket — average credit score on applications, eviction rate, late-payment / NSF rate, and stable-employment percentage? A property-management company in the area should have these aggregated.
- How much new apartment / multifamily construction is in the pipeline within 1–3 miles? Heavy new supply (>2% of stock underway) typically softens rents 12–24 months out; light construction supports rent growth.
Investment metrics
- 1% rule
- 0.44% ✗
- Cap rate
- 2.13%
- Cash-on-cash
- -14.88%
- DSCR
- 0.34
- GRM
- 19.1
CMA / ARV
No comps found within radius.
Projected returns pro-forma
3.0% appreciation · 3.0% rent growth · sell at horizon
- IRR
- -6.2%
- Equity multiple
- 0.64×
- Total profit
- $-34,186
- Equity at exit
- $152,879
- IRR
- -1.1%
- Equity multiple
- 0.83×
- Total profit
- $-16,273
- Equity at exit
- $235,604
Cash invested: $95,200 (down + closing). Projections, not guarantees.
Landlord ↔ Tenant lean methodology
- Overall (STATE)
- 92 Strongly Landlord-Friendly
- State Arkansas
- 92 Strongly Landlord-Friendly · R+14
- County
- — inherits STATE
- City
- — inherits STATE
ZIP-level market 72440
- Active inventory
- 3
- Price-to-rent
- 19.1×
Monthly cashflow live
- Estimated rent
- $1,480 medium interval (Pro) →
- Mortgage (P&I)
- −$1,783
- Tax est. 1.5%
- −$425 /mo · $5,100/yr
- Insurance
- −$142
- HOA
- −$0
- Vacancy / Maint / Mgmt
- −$311
- Net cashflow
- $-1,180
Break-even live
UW: 25.0% down · 7.5% · 30yr · 1.5% tax · 5.0% vac · 8.0% maint · 8.0% mgmt
Financing live
Cash to close
- Down payment
- $85,000
- Closing costs
- $10,200
- Reserves months
- —
- Total cash needed
- —
Loan-product check · same deal, 3 products live
Conventional
25% down · 7.5% · 30yr
- Down + closing
- —
- Monthly P&I
- —
- Monthly cashflow
- —
- DSCR
- —
- Eligible?
- —
Personal DTI + credit; lowest rate.
DSCR
20% down · 8.5% · 30yr
- Down + closing
- —
- Monthly P&I
- —
- Monthly cashflow
- —
- DSCR
- —
- Eligible?
- —
No personal income docs; deal must DSCR.
Hard money
10% down · 12.0% · 12mo
- Down + closing
- —
- Monthly P&I
- —
- Monthly cashflow
- —
- DSCR
- —
- Eligible?
- —
Short-term bridge; refi at stabilization.
Listing history 16 events
-
2026-06-19days on market $340,000 Active 128 DOM
-
2026-06-18days on market $340,000 Active 127 DOM
-
2026-06-17days on market $340,000 Active 126 DOM
-
2026-06-16days on market $340,000 Active 125 DOM
-
2026-06-15days on market $340,000 Active 124 DOM
-
2026-06-14days on market $340,000 Active 122 DOM
-
2026-06-12days on market $340,000 Active 121 DOM
-
2026-06-09days on market $340,000 Active 118 DOM
-
2026-06-08days on market $340,000 Active 117 DOM
-
2026-06-07days on market $340,000 Active 116 DOM
-
2026-06-04days on market $340,000 Active 112 DOM
-
2026-06-02days on market $340,000 Active 111 DOM
-
2026-06-01days on market $340,000 Active 110 DOM
-
2026-05-31days on market $340,000 Active 109 DOM
-
2026-05-31days on market $340,000 Active 108 DOM
-
2026-02-09$340,000 New Listing 397-char remark
Show marketing remark (397 chars)
Here is an opportunity to start or add to your real estate portfolio with a package of six single family houses on four separate parcels. This package deal consist of two one bedroom, 3 two bedroom, and one 3 bedroom houses all currently rented. Gross income is $3500/monthly. All houses are in city limits and have city utilities. Addresses are 229 Hwy 25, 190 Hwy 25, 141 Hwy 25, and 653 Hwy 25.
ⓘ Source: listings_history table (triggers on properties + properties_extension) + one-shot
backfill from property_details.listing_events for pre-trigger history.
Nearby sold comps map
Loading sold comps map…
Walkable amenities ~0.75 mi
Loading nearby amenities…
Taxation est. · year 1
- Rental income
- $17,764
- − Mortgage interest
- −$19,045
- − Property taxes
- −$5,100
- − Insurance
- −$1,700
- − Repairs & maintenance
- −$1,421
- − Management
- −$1,421
- − Depreciation
- −$9,891
- Taxable loss
- −$20,814
- Est. tax savings @ 24.0%
- +$4,995
- After-tax cash flow
- $-9,167/yr
For passive investors: Depreciation is non-cash, so a rental often shows a tax loss while cash-flowing — sheltering income. Rental losses are passive: they offset passive income freely, and up to $25,000/yr can offset ordinary (W-2) income if you actively participate and your MAGI is under $100k (phasing out to $0 by $150k); unused losses carry forward. On sale, claimed depreciation is recaptured at up to 25%, and gains may owe capital-gains tax (a 1031 exchange can defer both). Figures are a year-1 estimate at your 24.0% rate — not tax advice; consult a CPA.
Condition & rehab AI · 7 photos
This multi-family property requires moderate repairs and maintenance to improve its curb appeal and interior condition, which could significantly increase its resale and rental value.
Repairs flagged
- Moderate Exterior siding — Weathered and needs repainting
- Minor Landscaping — Overgrown and could benefit from trimming
Value-add opportunities
- Both Paint exterior siding — Enhances curb appeal and value
- Both Trim landscaping — Improves curb appeal and value
- Both Paint interior walls and trim — Enhances interior appearance and value
- Both Replace windows — Improves energy efficiency and value
Renovation cost estimate screening
| Repair item | Severity | Est. cost |
|---|---|---|
| Exterior siding · Weathered and needs repainting | Moderate | $3,000–15,000 |
| Landscaping · Overgrown and could benefit from trimming | Minor | $500–3,000 |
| Total estimated repair cost · 2 items | $3,500–18,000 |
Value-add ROI direction
- Both Paint exterior siding — Enhances curb appeal and value ↑
- Both Trim landscaping — Improves curb appeal and value ↑
- Both Paint interior walls and trim — Enhances interior appearance and value ↑
- Both Replace windows — Improves energy efficiency and value ↑
ⓘ Cost ranges are severity-bucket heuristics (US national rule-of-thumb). Get contractor quotes + a written scope before underwriting a rehab budget.
Schools (NCES district)
- District
- Hillcrest School District
- NCES district ID
- 0500071
- Math proficiency
- 47% ▲ 5.00%
- Reading proficiency
- 46% ▼ -9.00%
- Median HH income
- $38,660
- Composite
- 38.81/100
- National rank
- #4112
- State rank
- #31 of 238 in AR
Livability — Lynn
- Score
- 56/100
- State rank
- #397
- US rank
- #23066
Category grades
Schools grade is shown separately in the Schools card above.
Census & demographics
- Census place
- Lynn, AR
- Population (ZIP)
- 166
Population outlook (Lawrence County) Hauer SSP2
- Today (2025)
- 15,453 people
- By 2030
- 14,697 · -4.9%
- By 2040
- 13,247 · -14.3%
- By 2050
- 11,937 · -22.8%
- By 2075
- 9,466 · -38.7%
- By 2100
- 7,441 · -51.8%
Race, ethnicity, and origin ACS 2023
- Neighborhood character
- Predominantly White (95%)
- Race & ethnicity
- White 95% Hispanic / Latino 5%
- Common ancestry
- Lithuanian 1%
Political lean MEDSL · Lawrence
- 2024 margin
- Solid R (+64.0) · D 16.9% · R 81.0% · Other 2.1%
- 2008→2024 swing
- -43.1pp toward R · 2008: -20.9pp · 2024: -64.0pp
- All cycles
- 2024: R+64.0 2020: R+59.6 2016: R+49.8 2012: R+31.6 2008: R+20.9
Not yet ingested
- Civics
- —
Market trends
- HPI YoY
- —
- Current HPI
- —
- Rent YoY
- —
- Metro
- —
- State GDP YoY
- ▲ 3.80%
- F500 in state
- 10
Industry mix (Fortune 500 HQ in AR)
| Industry | F500 HQs | Revenue |
|---|---|---|
| Retail | 1 | $681B |
|
||
| Food / Agriculture | 1 | $53B |
|
||
| Retail / Energy | 1 | $22B |
|
||
| Transportation / Logistics | 1 | $12B |
|
||
| Energy | 1 | $4B |
|
||
Price history
1 event — show timeline
- 2026-02-09 Listed $340,000 CARMLS
Cash-flow waterfall
monthlySold comps — $/sqft
last 12 mo · ≤1 miLoading sold comps…