500 W Village Green Cir W #203 · Palm Springs, FL
Flood risk 4/10 · Minor
- FEMA flood zone
- X (unshaded)
- Chance of flooding over 30 yrs
- 0.22%
- Est. flood insurance / yr
- $507 – $1,088
Fire risk 1/10 · Minimal
- Est. fire insurance / yr
- $947 – $1,759
Heat risk No data
- Hot days now (above threshold)
- —
- Hot days in 30 yrs
- —
Wind risk 10/10 · Severe
- Chance of severe wind over 30 yrs
- 99.0%
Air-quality risk 2/10 · Minimal
- Unhealthy air days now
- 0 days/yr
- Unhealthy air days in 30 yrs
- 2 days/yr
Risk factors via First Street. Map © Google.
Why this score? — see what drove the C+ grade
The composite is a weighted blend of 9 inputs, each scored 0–100. Each bar is that input's sub-score; the figure is the points it added to the 100-point composite (weight × sub-score).
- Cash flow +26.0/30.0
- 1% rule +10.0/10.0
- DSCR +8.7/10.0
- ARV discount +7.5/15.0
- Schools +4.3/10.0
- Livability +3.7/5.0
- Condition / age +2.5/5.0
- Rent growth +1.9/5.0
- Appreciation +0.0/10.0
$89,000
🖨 Deal sheet 📄 Offer letter ✓ Due diligence
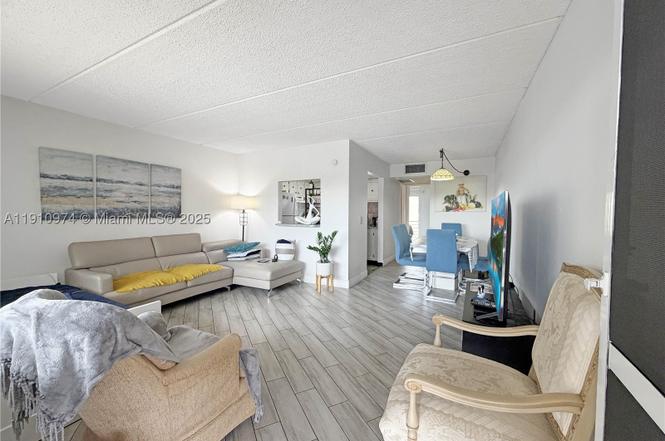
Listing remarks
Welcome to your charming new home in the heart of a friendly 55+ community in West Palm Beach! This cozy 1-bedroom, 1-bath apartment offering a relaxed and peaceful lifestyle. Step inside and you'll find a bright and inviting living space perfect for enjoying your golden years. This unit has all the essentials for comfortable living, and the association fee of $370/month makes an affordable choice. Located in a well-maintained complex, you'll enjoy easy access to local amenities. Just a short drive away, you'll find grocery stores, charming cafes, and medical facilities, ensuring everything you need is close. For recreation, residents have access to on-site amenities like a community pool,
Key facts
- Community pool
- Landscaped grounds
- Local amenities
Tags
Property features AI
Finance
- Other: Pets allowed with restrictions or possible restrictions (conditional; currently listed as No)
- Financial info: Association fee: $370 monthly
- HOA & community: Monthly association fee; Association fee includes: pool(s), roof, and water; Association amenities: bike storage, cabana, clubhouse, elevator(s), barbecue, picnic area; Senior community
Exterior
- Parking: Guest parking available; One designated parking space
- Security: Complex is fenced
- Home design: Attached property; 3 total stories; Entry located on level 2; Effective year built
- Construction: Block construction
- Exterior features: Balcony; Courtyard; Open balcony/patio
Interior
- Kitchen: Microwave; Refrigerator
- Bedrooms: Bedroom located on the main level
- Flooring: Tile
- Bathrooms: 1 full bathroom
- Heating & cooling: Central heating; Central air conditioning
- Interior features: Bedroom on main level; Tile flooring
Neighborhood map
What this means for you Summary
Snapshot
- This is a 1-bed/1.0-bath condo listed at $89k.
Deal economics
- At list price, monthly cash flow is $221 ($3k/yr) — positive.
- The deal already cash-flows at list — no discount required.
- Meets the 1% rule at list price ($2k rent vs $89k).
- Recommended offer: $78k (12.0% below list) — sets the bar for market timing.
Location & tenants
- Location reads 73/100 on livability (#297 in FL) — a middle-class / working-renter tenant base. Strengths: cost of living A+, housing A+, health & safety A; Watch: employment D+, schools D-, amenities F.
- Palm Beach (suburban): math 46% / reading 53% proficiency, ranked #34 of 73 in FL (top 47%) — families likely to look elsewhere, expect single-tenant / working-renter base with shorter leases.
- Market conditions: Rents soft (-2.5%/yr); 274 active listings in the ZIP; 27 comparable units currently listed for rent nearby; rentals at typical pace (median 22d on market — plan ~3-4 weeks tenant-placement turnaround); 3,974 units permitted in Palm Beach County in 2024 (1,012 in 5+ unit buildings).
- This rent runs 31% of the median local income ($62k/yr) — at the standard rent-burdened threshold; future hikes will face affordability resistance.
Forward outlook
- Local home prices are declining (-3.0%/yr); year-one equity from $615 of loan paydown is wiped out by about $3k of value loss. Plan a longer hold.
- Palm Beach County population projected at +30% by 2050 — long-run rental-demand tailwind backs the buy-and-hold thesis.
Negotiation context
- It's been on market 209 days — a 12% lower offer ($78k) is reasonable based on typical stale-listing flexibility.
Risks & watch-outs
- Watch-outs: HOA is 23% of rent.
- Climate carrying-cost: severe wind risk, 99% chance of damaging wind over 30y — expect insurance premiums to compound above CPI over the hold.
Questions for the listing agent
- It's been on market 209 days. Have you received any prior offers? Is the seller open to a 12% concession, seller financing, or rate buy-down credit?
- Built in 1974 — when were the roof, HVAC, electrical panel, plumbing, and water heater last replaced?
- What does the HOA fee cover, when was the last increase, and are there any pending special assessments or reserve-fund shortfalls?
- Any open or pending special assessments — roof, HVAC, plumbing, elevator, façade? What's the per-unit balance and payoff schedule, and is the seller paying it off at close or rolling it to the buyer?
- Why hasn't it sold? Are there any deal-killer items the seller is aware of (foundation, flood, title, zoning, code violations)?
- Is there a deadline driving the sale (1031 exchange, divorce, estate, relocation)? That informs how much negotiation room exists.
- Schools are D-rated, which usually means shorter tenancies and higher turnover. Who's the typical renter profile here, and what's been the actual vacancy rate?
- What's the average days-on-market for RENTAL listings here right now (not sales)? A rising rental-DOM trend means longer vacancies and softer asking-rent achievability than the comps imply.
- What's the recent tenant-quality profile in this submarket — average credit score on applications, eviction rate, late-payment / NSF rate, and stable-employment percentage? A property-management company in the area should have these aggregated.
- How much new apartment / multifamily construction is in the pipeline within 1–3 miles? Heavy new supply (>2% of stock underway) typically softens rents 12–24 months out; light construction supports rent growth.
Investment metrics
- 1% rule
- 1.80% ✓
- Cap rate
- 9.27%
- Cash-on-cash
- 10.65%
- DSCR
- 1.47
- GRM
- 4.6
CMA / ARV
No comps found within radius.
Projected returns pro-forma
-3.0% appreciation · 0.0% rent growth · sell at horizon
- IRR
- -5.4%
- Equity multiple
- 0.81×
- Total profit
- $-4,741
- Equity at exit
- $13,270
- IRR
- -2.2%
- Equity multiple
- 0.88×
- Total profit
- $-2,951
- Equity at exit
- $7,695
Cash invested: $24,920 (down + closing). Projections, not guarantees.
Landlord ↔ Tenant lean methodology
- Overall (STATE)
- 87 Strongly Landlord-Friendly
- State Florida
- 87 Strongly Landlord-Friendly · R+3
- County
- — inherits STATE
- City
- — inherits STATE
ZIP-level market 33461
- Rents YoY
- -2.5%
- Active inventory
- 274
- Price-to-rent
- 4.6×
Monthly cashflow live
- Estimated rent
- $1,600 high interval (Pro) →
- Mortgage (P&I)
- −$467
- Tax from tax record
- −$169 /mo · $2,031/yr
- Insurance
- −$37
- HOA
- −$370
- Vacancy / Maint / Mgmt
- −$336
- Net cashflow
- $221
Break-even live
UW: 25.0% down · 7.5% · 30yr · 1.5% tax · 5.0% vac · 8.0% maint · 8.0% mgmt
Financing live
Cash to close
- Down payment
- $22,250
- Closing costs
- $2,670
- Reserves months
- —
- Total cash needed
- —
Loan-product check · same deal, 3 products live
Conventional
25% down · 7.5% · 30yr
- Down + closing
- —
- Monthly P&I
- —
- Monthly cashflow
- —
- DSCR
- —
- Eligible?
- —
Personal DTI + credit; lowest rate.
DSCR
20% down · 8.5% · 30yr
- Down + closing
- —
- Monthly P&I
- —
- Monthly cashflow
- —
- DSCR
- —
- Eligible?
- —
No personal income docs; deal must DSCR.
Hard money
10% down · 12.0% · 12mo
- Down + closing
- —
- Monthly P&I
- —
- Monthly cashflow
- —
- DSCR
- —
- Eligible?
- —
Short-term bridge; refi at stabilization.
Rent comps 27 comps
| Address | Beds | Baths | Sqft | Rent | $/sqft | DOM | Units | Dist |
|---|---|---|---|---|---|---|---|---|
| 500 Village Green Cir W Palm Springs, FL | 1.0–2.0 | 1.0–1.5 | 739 | $1,400 | $1.89 | 24d | 2 | 0.00mi |
| 555 Purdy Ln Palm Springs, FL | 1.0 | 1.0 | 650 | $1,375 | $2.12 | 5d | 1 | 0.02mi |
| 600 Village Green Ct #203 Palm Springs, FL | 1.0 | 1.0 | 650 | $1,300 | $2.00 | 4d | 1 | 0.07mi |
| 555 Kirk Rd Palm Springs, FL | 1.0 | 1.0 | 625 | $2,268 | $3.63 | 8d | 1 | 0.16mi |
| 555 Kirk Rd Palm Springs, FL | 1.0 | 1.0 | 670 | $2,352 | $3.51 | 14d | 1 | 0.16mi |
| 4403 Anna Ln Unit B Palm Springs, FL | 1.0 | 1.0 | 740 | $1,600 | $2.16 | 8d | 1 | 0.31mi |
| 436 Fontana Dr Lake Worth, FL | 1.0 | 1.0 | 550 | $1,450 | $2.64 | 24d | 1 | 0.33mi |
| 436 Fontana Dr Lake Worth, FL | 1.0 | 1.0 | 550 | $1,375 | $2.50 | 22d | 1 | 0.33mi |
| 300 Bonnie Blvd #144 Palm Springs, FL | 1.0 | 1.0 | 702 | $1,350 | $1.92 | 24d | 1 | 0.62mi |
| 200 Bonnie Blvd #132 Palm Springs, FL | 1.0 | 1.0 | 577 | $1,500 | $2.60 | 22d | 1 | 0.67mi |
| 246 Cypress Ln Lake Worth Beach, FL | 1.0–2.0 | 1.0 | 850 | $1,550 | $1.82 | 24d | 2 | 0.67mi |
| 240 Alemeda Dr Palm Springs, FL | 1.0–2.0 | 1.0–2.0 | 825 | $1,650 | $2.00 | 24d | 3 | 0.70mi |
| 2550 Lakehaven Rd West Palm Beach, FL | 1.0 | 1.0 | 400 | $1,500 | $3.75 | 24d | 1 | 0.75mi |
| 3263 Kirk Rd #2 Lake Worth, FL | 1.0 | 1.0 | 619 | $1,650 | $2.67 | 24d | 1 | 0.98mi |
| 3263 Kirk Rd #2 Lake Worth, FL | 1.0 | 1.0 | 619 | $1,650 | $2.67 | 8d | 1 | 0.98mi |
| 2966 Ashley Dr E Unit C West Palm Beach, FL | 1.0 | 1.0 | 611 | $1,375 | $2.25 | 24d | 1 | 0.99mi |
| 2085 S Congress Ave Palm Springs, FL | 1.0–3.0 | 1.0–2.0 | 963 | $2,055 | $2.13 | 2d | 14 | 1.08mi |
| 2951 Ashley Dr W West Palm Beach, FL | 1.0 | 1.5 | 662 | $1,525 | $2.30 | 21d | 1 | 1.10mi |
| 2951 Ashley Dr W Unit D West Palm Beach, FL | 1.0 | 1.5 | 662 | $1,450 | $2.19 | 17d | 1 | 1.10mi |
| 3874 7th Ave N Unit 3878 Lake Worth Beach, FL | 1.0 | 1.0 | 528 | $1,600 | $3.03 | 24d | 1 | 1.21mi |
| 2854 Crosley Dr E Unit J West Palm Beach, FL | 1.0 | 1.0 | 612 | $1,300 | $2.12 | 24d | 1 | 1.25mi |
| 2805 Crosley Dr E Unit E West Palm Beach, FL | 1.0 | 1.5 | 662 | $1,250 | $1.89 | 24d | 1 | 1.27mi |
| 2723 Dudley Dr W Unit G West Palm Beach, FL | 1.0 | 1.0 | 611 | $1,300 | $2.13 | 24d | 1 | 1.34mi |
| 965 Manor Dr Palm Springs, FL | 2.0 | 1.0 | 687 | $1,722 | $2.51 | 1d | 5 | 1.39mi |
| 2607 Dudley Dr W Unit L West Palm Beach, FL | 1.0 | 1.0 | 611 | $1,300 | $2.13 | 8d | 1 | 1.40mi |
| 3654 Coconut Rd Palm Springs, FL | 1.0 | 1.0 | 600 | $1,500 | $2.50 | 24d | 1 | 1.44mi |
| 3890 Lakewood Rd #1 Lake Worth, FL | 1.0 | 1.0 | 433 | $1,500 | $3.46 | 11d | 1 | 1.49mi |
HOA detail condo
- Monthly dues
- $370 · $4,440/yr
- Likely covers
- pool
- Assessments
- None detected in remarks — confirm with the listing agent.
Listing history 16 events
-
2026-06-17status $89,000 Pending 209 DOM
-
2026-06-16days on market $89,000 Active 209 DOM
-
2026-06-15days on market $89,000 Active 208 DOM
-
2026-06-13days on market $89,000 Active 206 DOM
-
2026-06-09days on market $89,000 Active 202 DOM
-
2026-06-07days on market $89,000 Active 200 DOM
-
2026-06-04days on market $89,000 Active 197 DOM
-
2026-06-03days on market $89,000 Active 196 DOM
-
2026-06-01days on market $89,000 Active 194 DOM
-
2026-05-31days on market $89,000 Active 193 DOM
-
2026-04-22price $89,000
-
2026-01-20price $92,000
-
2025-10-22$125,000 Active
-
2022-09-06soldstatus $102,000
-
2017-12-07soldstatus $40,000
-
1974-01-01soldstatus $16,000
ⓘ Source: listings_history table (triggers on properties + properties_extension) + one-shot
backfill from property_details.listing_events for pre-trigger history.
Tax reassessment forecast FL · Resets to sale price
- Current annual tax
- $2,031 · $169/mo
- Projected year-2 tax
- $2,031 · $169/mo
- Expected delta
- $0/yr ($0/mo · -0.0%)
ⓘ Screening estimate from a state-policy table — verify with the county assessor before closing.
Climate risk First Street
- Flood 4/10 Moderate FEMA zone X (unshaded) · 22% chance over 30 yrs
- Wildfire 1/10 Low
- Wind 10/10 Extreme 99% chance of damaging wind over 30 yrs
- Air quality 2/10 Low 0 unhealthy d/yr today · 2 by 30 yrs out
Nearby sold comps map
Loading sold comps map…
Walkable amenities ~0.75 mi
Loading nearby amenities…
Taxation est. · year 1
- Rental income
- $19,203
- − Mortgage interest
- −$4,985
- − Property taxes
- −$2,031
- − Insurance
- −$445
- − Repairs & maintenance
- −$1,536
- − Management
- −$1,536
- − HOA
- −$4,440
- − Depreciation
- −$2,589
- Taxable income
- $1,640
- Est. tax owed @ 24.0%
- −$394
- After-tax cash flow
- $2,260/yr
For passive investors: Depreciation is non-cash, so a rental often shows a tax loss while cash-flowing — sheltering income. Rental losses are passive: they offset passive income freely, and up to $25,000/yr can offset ordinary (W-2) income if you actively participate and your MAGI is under $100k (phasing out to $0 by $150k); unused losses carry forward. On sale, claimed depreciation is recaptured at up to 25%, and gains may owe capital-gains tax (a 1031 exchange can defer both). Figures are a year-1 estimate at your 24.0% rate — not tax advice; consult a CPA.
Schools (NCES district)
- District
- Palm Beach
- NCES district ID
- 1201500
- Math proficiency
- 46% ▼ -16.00%
- Reading proficiency
- 53% ▼ -4.00%
- Median HH income
- $53,943
- Composite
- 42.72/100
- National rank
- #3160
- State rank
- #34 of 73 in FL
Livability — Palm Springs
- Score
- 73/100
- State rank
- #297
- US rank
- #5045
Category grades
Schools grade is shown separately in the Schools card above.
Census & demographics
- Census place
- Palm Springs, FL
- County
- Palm Beach County · 1,438,312 people
- City population
- 49,443
- Metro
- Miami-Fort Lauderdale-Pompano Beach, FL
- Population (ZIP)
- 49,443
- Household income
- $61,963
- Rent vs Own
- Severe rent burden
- 2663.0
Population outlook (Palm Beach County) Hauer SSP2
- Today (2025)
- 1,637,487 people
- By 2030
- 1,743,255 · +6.5%
- By 2040
- 1,948,712 · +19.0%
- By 2050
- 2,132,979 · +30.3%
- By 2075
- 2,530,027 · +54.5%
- By 2100
- 2,706,979 · +65.3%
Race, ethnicity, and origin ACS 2023
- Neighborhood character
- Diverse neighborhood (Simpson 0.59)
- Race & ethnicity
- Hispanic / Latino 59% Two or more races 26% White 20% Black 17% Asian 2%
- Hispanic origin (detail)
- Mexican 11% Puerto Rican 6% Cuban 16% Dominican 2%
- Common ancestry
- Hispanic 9% Romanian 1% Lithuanian 1%
- Foreign-born
- 52% · Canada, Jamaica
- Languages at home
- 31% English-only · Spanish 54% French/Haitian/Cajun 10% Other Indo-European 2%
Political lean MEDSL · Palm Beach
- 2024 margin
- Toss-up / Even · D 50.0% · R 49.2%
- 2008→2024 swing
- -22.1pp toward R · 2008: 22.9pp · 2024: 0.8pp
- All cycles
- 2024: D+0.8 2020: D+12.8 2016: D+15.3 2012: D+17.0 2008: D+22.9
Not yet ingested
- Civics
- —
Market trends
- HPI YoY
- ▼ -269.03%
- Current HPI
- 493.0041
- Rent YoY
- ▼ -2.47%
- Metro
- Miami-Fort Lauderdale-Pompano Beach, FL
- State GDP YoY
- ▲ 3.28%
- F500 in state
- 36
Industry mix (Fortune 500 HQ in FL)
| Industry | F500 HQs | Revenue |
|---|---|---|
| Industrial Technology | 2 | $29B |
|
||
| Insurance | 2 | $17B |
|
||
| Retail | 1 | $60B |
|
||
| Technology Distribution | 1 | $58B |
|
||
| Homebuilding | 1 | $35B |
|
||
| Technology Manufacturing | 1 | $35B |
|
||
Price history
+456.2% since first listed6 events — show timeline
- 2026-04-22 Price Changed $89,000 MARMLS
- 2026-01-20 Price Changed $92,000 MARMLS
- 2025-10-22 Listed $125,000 MARMLS
- 2022-09-06 Sold (Public Records) $102,000 Public Records
- 2017-12-07 Sold (Public Records) $40,000 Public Records
- 1974-01-01 Sold (Public Records) $16,000 Public Records
Property tax history
+9.2%/yrLatest (2025): $2,031 · +6.6% YoY. Source: county tax records.
Cash-flow waterfall
monthlySold comps — $/sqft
last 12 mo · ≤1 miLoading sold comps…