82 Johns Hopkins Dr · Kenner, LA
Flood risk No data
- FEMA flood zone
- —
- Chance of flooding over 30 yrs
- —
- Est. flood insurance / yr
- —
Fire risk No data
- Est. fire insurance / yr
- —
Heat risk No data
- Hot days now (above threshold)
- —
- Hot days in 30 yrs
- —
Wind risk No data
- Chance of severe wind over 30 yrs
- —
Air-quality risk No data
- Unhealthy air days now
- —
- Unhealthy air days in 30 yrs
- —
Risk factors via First Street. Map © Google.
Why this score? — see what drove the B- grade
The composite is a weighted blend of 9 inputs, each scored 0–100. Each bar is that input's sub-score; the figure is the points it added to the 100-point composite (weight × sub-score).
- Cash flow +30.0/30.0
- 1% rule +10.0/10.0
- DSCR +10.0/10.0
- ARV discount +7.5/15.0
- Livability +3.9/5.0
- Schools +2.5/10.0
- Condition / age +2.5/5.0
- Rent growth +1.5/5.0
- Appreciation +0.0/10.0
$115,000
🖨 Deal sheet (PDF) 📄 Offer letter ✓ Due diligence
Listing remarks MLS
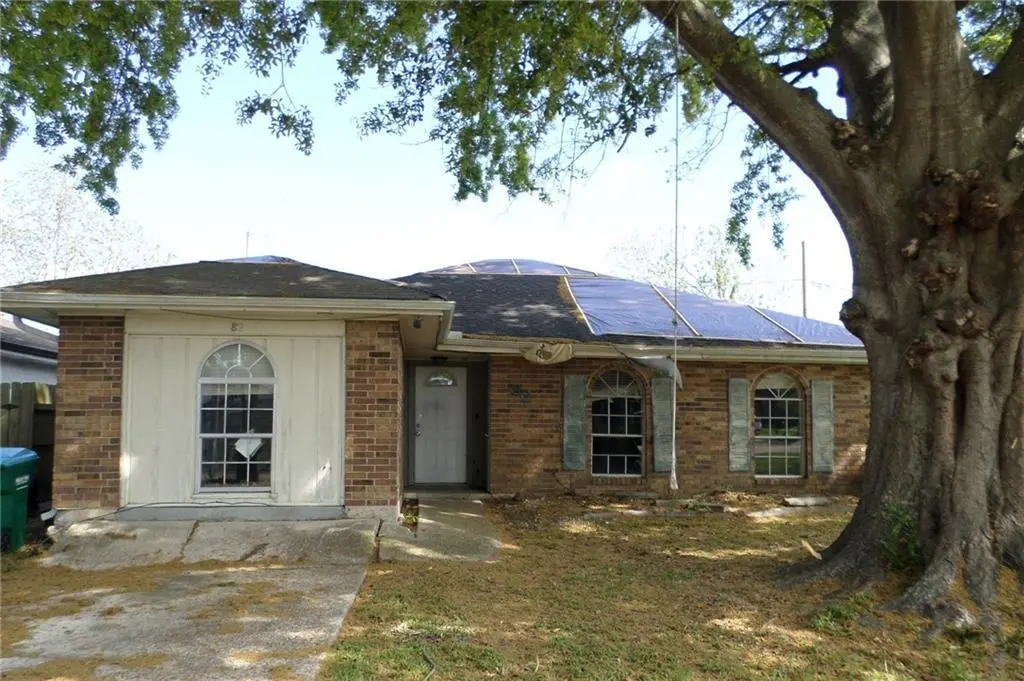
Investor Alert!! This property needs a total rebuild. Extensive termite and water damage. Cash sale or approved construction loan. Will not qualify for any other loan types. Poor condition. Extensive termite damage. Has been treated but damage remains. Sold strictly as is. No repairs or replacements will be made. Utilities are not on and will not be turned on for inspections. Hold Harmless must be signed by each person entering the building. No exceptions.
Key facts
- Parking
- Pool
- Built 1975
Property features AI
Finance
- Other: In-ground pool
Exterior
- Parking: Driveway
- Utilities: Public water; Public sewer
- Home design: One-story; Brick construction; Shingle roof; Slab foundation
- Construction: Built with brick
- Exterior features: Fenced yard; City lot with rectangular shape; Lot size per title
Interior
- Bathrooms: 2 full bathrooms
- Interior features: Total of 8 rooms; Property listed in poor condition
Neighborhood map
What this means for you Summary
Snapshot
- This is a 3-bed/2.0-bath single-family listed at $115k.
Deal economics
- At list price, monthly cash flow is $781 ($9k/yr) — positive.
- The deal already cash-flows at list — no discount required.
- Meets the 1% rule at list price ($2k rent vs $115k).
- Recommended offer: $112k (3.0% below list) — sets the bar for market timing.
- Cap rate 14.4% vs local median 5.3% in Kenner — top-decile yield for the area; either an underpriced asset or a hidden risk that comps aren't pricing in. Stress-test before assuming the spread holds.
Location & tenants
- Location reads 78/100 on livability (#6 in LA, #2,414 nationally) — a middle-class / working-renter tenant base. Strengths: cost of living A+, housing A+, health & safety A+; Watch: amenities C-, employment C-, crime D.
- Jefferson Parish (suburban): math 24% / reading 34% proficiency, ranked #44 of 98 in LA (top 45%) — low school quality limits family demand, transient renter base, plan for 1-2y turnover; 70% free/reduced lunch — lower-income household profile, screen leases tightly.
- Zoned schools: John James Audubon School (math 22% / reading 35%, grade F, #350 of 646 statewide, top 55%, 648 students, 61% FRL); Tom Benson School (math 11% / reading 14%, grade F, #546 of 646 statewide, top 85%, 753 students, 60% FRL); Bonnabel Magnet Academy High School (math 12% / reading 21%, grade F, #214 of 265 statewide, top 81%, 1,478 students, 52% FRL).
- Market conditions: Rents falling (-4.2%/yr); 292 active listings in the ZIP; 40 comparable units currently listed for rent nearby; rentals at typical pace (median 16d on market — plan ~3-4 weeks tenant-placement turnaround); 518 units permitted in Jefferson Parish in 2024 (43 in 5+ unit buildings).
- This rent runs 36% of the median local income ($67k/yr) — at the standard rent-burdened threshold; future hikes will face affordability resistance.
Forward outlook
- Local home prices are declining (-3.0%/yr); year-one equity from $795 of loan paydown is wiped out by about $3k of value loss. Plan a longer hold.
- At projected returns (-3.0% appreciation + 0.0% rent growth), your $32k cash investment doubles in ~5 years — after that, you're playing with house money.
Negotiation context
- It's been on market 47 days — a 3% lower offer ($112k) is reasonable based on typical stale-listing flexibility.
- 5 sale attempts since 30y ago with the ask held roughly flat each time — persistent listings suggest the price (not the market) is what's stuck; bring a comps-based counter.
Questions for the listing agent
- It's been on market 47 days. Have you received any prior offers? Is the seller open to a 3% concession, seller financing, or rate buy-down credit?
- Built in 1975 — when were the roof, HVAC, electrical panel, plumbing, and water heater last replaced?
- Is there a deadline driving the sale (1031 exchange, divorce, estate, relocation)? That informs how much negotiation room exists.
- Crime grade is D in this area — have there been break-ins, vandalism, or insurance claims at this property in the last 3 years? What carrier currently insures it and at what premium?
- What's the average days-on-market for RENTAL listings here right now (not sales)? A rising rental-DOM trend means longer vacancies and softer asking-rent achievability than the comps imply.
- What's the recent tenant-quality profile in this submarket — average credit score on applications, eviction rate, late-payment / NSF rate, and stable-employment percentage? A property-management company in the area should have these aggregated.
- How much new for-sale + rental construction is in the pipeline within 1–3 miles? Heavy new supply typically softens prices + rents 12–24 months out; constrained supply supports both.
Investment metrics
- 1% rule
- 1.73% ✓
- Cap rate
- 14.44%
- Cash-on-cash
- 29.11%
- DSCR
- 2.30
- GRM
- 4.8
CMA / ARV
- ARV (median comp)
- $259,100
- List price
- $115,000
- Delta
- -55.62%
- Verdict
- UNDERPRICED
- Comps
- 20 within 1.0 mi
Show comp detail 12 sales within ~0.75 mi
| Address | Dist | Beds/Ba | Sqft | Sold | Price | $/sf | Match |
|---|---|---|---|---|---|---|---|
| 7 S Catahoula Ct | 0.23mi | 3/2.0 | 1,562 (-1%) | 4mo | $334,800 | $214 | 84 |
| 204 Johns Hopkins Dr | 0.21mi | 3/1.5 | 1,550 (-2%) | 4mo | $89,000 | $57 | 82 |
| 82 Kilgore Pl | 0.05mi | 3/2.0 | 1,410 (-11%) | 2mo | $234,900 | $167 | 78 |
| 3305 Grandlake Blvd | 0.28mi | 3/2.0 | 1,642 (+4%) | 3mo | $218,400 | $133 | 78 |
| 98 Houston Pl | 0.27mi | 3/2.0 | 1,660 (+5%) | 3mo | $235,000 | $142 | 76 |
| 25 Furman Cir | 0.30mi | 3/2.0 | 1,500 (-5%) | 5mo | $229,000 | $153 | 73 |
| 3333 Grandlake Blvd | 0.42mi | 3/2.0 | 1,650 (+4%) | 1mo | $299,000 | $181 | 73 |
| 413 Baroni Dr | 0.43mi | 2/2.0 (-1) | 1,540 (-2%) | 0mo | $235,000 | $153 | 71 |
| 361 W Louisiana State St | 0.31mi | 3/1.5 | 1,350 (-15%) | 1mo | $196,000 | $145 | 59 |
| 333 Bertolino Dr | 0.44mi | 3/2.0 | 1,770 (+12%) | 1mo | $235,000 | $133 | 58 |
| 2 Bradley Pl | 0.42mi | 3/2.0 | 1,378 (-13%) | 4mo | $275,900 | $200 | 56 |
| 3541 Tulane Dr | 0.65mi | 4/2.0 (+1) | 1,455 (-8%) | 3mo | $210,000 | $144 | 48 |
Match score weights: distance 35% · size 25% · config 20% · recency 20%. Top-matched comps best support the ARV.
Projected returns pro-forma
-3.0% appreciation · 0.0% rent growth · sell at horizon
- IRR
- 20.1%
- Equity multiple
- 1.79×
- Total profit
- $25,311
- Equity at exit
- $17,147
- IRR
- 26.2%
- Equity multiple
- 2.98×
- Total profit
- $63,662
- Equity at exit
- $9,943
Cash invested: $32,200 (down + closing). Projections, not guarantees.
Landlord ↔ Tenant lean methodology
- Overall (STATE)
- 90 Strongly Landlord-Friendly
- State Louisiana
- 90 Strongly Landlord-Friendly · R+12
- County
- — inherits STATE
- City
- — inherits STATE
ZIP-level market 70065
- Rents YoY
- -4.2%
- Active inventory
- 292
- Price-to-rent
- 4.8×
Monthly cashflow live
- Estimated rent
- $1,992 high interval (Pro) →
- Mortgage (P&I)
- −$603
- Tax from tax record
- −$142 /mo · $1,699/yr
- Insurance
- −$48
- HOA
- −$0
- Vacancy / Maint / Mgmt
- −$418
- Net cashflow
- $781
Break-even live
Sensitivity live
| Price | -10% $846 | -5% $814 | +0% $781 | +5% $749 | +10% $716 |
|---|---|---|---|---|---|
| Rent | -10% $624 | -5% $703 | +0% $781 | +5% $860 | +10% $939 |
| Rate | -1.0pp $839 | -0.5pp $810 | base $781 | +0.5pp $751 | +1.0pp $721 |
UW: 25.0% down · 7.5% · 30yr · 1.5% tax · 5.0% vac · 8.0% maint · 8.0% mgmt
Financing live
Cash to close
- Down payment
- $28,750
- Closing costs
- $3,450
- Reserves months
- —
- Total cash needed
- —
Loan-product check · same deal, 3 products live
Conventional
25% down · 7.5% · 30yr
- Down + closing
- —
- Monthly P&I
- —
- Monthly cashflow
- —
- DSCR
- —
- Eligible?
- —
Personal DTI + credit; lowest rate.
DSCR
20% down · 8.5% · 30yr
- Down + closing
- —
- Monthly P&I
- —
- Monthly cashflow
- —
- DSCR
- —
- Eligible?
- —
No personal income docs; deal must DSCR.
Hard money
10% down · 12.0% · 12mo
- Down + closing
- —
- Monthly P&I
- —
- Monthly cashflow
- —
- DSCR
- —
- Eligible?
- —
Short-term bridge; refi at stabilization.
Rent comps 40 comps
| Address | Beds | Baths | Sqft | Rent | $/sqft | DOM | Units | Dist |
|---|---|---|---|---|---|---|---|---|
| 70 Furman Cir Kenner, LA | 4.0 | 2.5 | 1800 | $2,500 | $1.39 | 4d | 1 | 0.36mi |
| 129 Auburn Pl Kenner, LA | 3.0 | 2.0 | 1200 | $1,800 | $1.50 | 3d | 1 | 0.50mi |
| 121 W Esplanade Ave Kenner, LA | 1.0–2.0 | 1.0–2.0 | 950 | $1,600 | $1.68 | 3d | 1 | 0.58mi |
| 2838 Kingston St Unit A Kenner, LA | 3.0 | 1.5 | 1500 | $1,600 | $1.07 | 6d | 1 | 0.66mi |
| 2804 Salem St Kenner, LA | 2.0 | 2.0 | 1450 | $1,400 | $0.97 | 45d | 1 | 0.72mi |
| 3120 Phoenix St Unit D Kenner, LA | 2.0 | 1.5 | 1075 | $1,100 | $1.02 | 45d | 1 | 0.79mi |
| 3600 W Loyola Dr Unit 298 Kenner, LA | 2.0 | 2.0 | 1586 | $1,750 | $1.10 | 23d | 1 | 0.79mi |
| 3600 W Loyola Dr Unit 271 Kenner, LA | 2.0 | 2.0 | 1586 | $1,855 | $1.17 | 3d | 1 | 0.79mi |
| 3600 W Loyola Dr Unit 159 Kenner, LA | 2.0 | 2.0 | 1052 | $1,520 | $1.44 | 45d | 1 | 0.79mi |
| 3600 W Loyola Dr Unit 182 Kenner, LA | 2.0 | 2.0 | 1052 | $1,515 | $1.44 | 45d | 1 | 0.79mi |
| 3600 W Loyola Dr Unit 270 Kenner, LA | 2.0 | 2.0 | 1570 | $1,860 | $1.18 | 3d | 1 | 0.79mi |
| 3655 W Loyola Dr Kenner, LA | 1.0–2.0 | 1.0–2.0 | 1169 | $2,345 | $2.01 | 3d | 35 | 0.89mi |
| 135 27th St Kenner, LA | 3.0 | 2.0 | 1205 | $1,200 | $1.00 | 6d | 1 | 0.90mi |
| 2611 Richland St Kenner, LA | 3.0 | 2.5 | 1443 | $2,200 | $1.52 | 3d | 1 | 0.91mi |
| 3655 Loyola Dr Unit F361 Kenner, LA | 2.0 | 2.0 | 1330 | $2,395 | $1.80 | 25d | 1 | 0.92mi |
| 3655 Loyola Dr Unit C224 Kenner, LA | 2.0 | 2.0 | 1367 | $2,305 | $1.69 | 3d | 1 | 0.92mi |
| 3655 Loyola Dr Unit C229 Kenner, LA | 2.0 | 2.0 | 1349 | $2,335 | $1.73 | 45d | 1 | 0.92mi |
| 3655 Loyola Dr Unit C329 Kenner, LA | 2.0 | 2.0 | 1349 | $2,320 | $1.72 | 45d | 1 | 0.92mi |
| 3655 Loyola Dr Apt F261 Kenner, LA | 2.0 | 2.0 | 1330 | $2,425 | $1.82 | 16d | 1 | 0.92mi |
| 3655 Loyola Dr Unit F158 Kenner, LA | 2.0 | 2.0 | 1367 | $2,445 | $1.79 | 16d | 1 | 0.92mi |
| 3655 Loyola Dr Unit D236 Kenner, LA | 2.0 | 2.0 | 1367 | $2,320 | $1.70 | 3d | 1 | 0.92mi |
| 3655 Loyola Dr Unit C223 Kenner, LA | 2.0 | 2.0 | 1330 | $2,295 | $1.73 | 3d | 1 | 0.92mi |
| 2604 Richland St Unit 1 Kenner, LA | 3.0 | 2.0 | 1442 | $1,500 | $1.04 | 6d | 1 | 0.93mi |
| 187 Avant Garde Cir #187 Kenner, LA | 2.0 | 1.5 | 1050 | $1,500 | $1.43 | 16d | 1 | 0.95mi |
| 215 Avant Garde Cir Kenner, LA | 2.0 | 2.0 | 1200 | $1,500 | $1.25 | 4d | 1 | 0.96mi |
| 3655 Loyola Dr Unit F460 Kenner, LA | 2.0 | 2.0 | 1330 | $2,280 | $1.71 | 3d | 1 | 0.97mi |
| 3600 Loyola Dr Unit 353 Kenner, LA | 2.0 | 2.0 | 1100 | $1,445 | $1.31 | 45d | 1 | 1.01mi |
| 3700 Loyola Dr Unit 377 Kenner, LA | 2.0 | 2.0 | 1110 | $1,495 | $1.35 | 45d | 1 | 1.01mi |
| 3608 E Louisiana State Dr Kenner, LA | 3.0 | 2.0 | 1800 | $2,275 | $1.26 | 3d | 1 | 1.03mi |
| 511 27th St Kenner, LA | 3.0 | 2.0 | 1200 | $1,575 | $1.31 | 6d | 1 | 1.05mi |
| 2755 Huntsville St Apt C Kenner, LA | 3.0 | 2.0 | 1216 | $1,575 | $1.30 | 6d | 1 | 1.07mi |
| 2755 Huntsville St Unit B Kenner, LA | 3.0 | 1.5 | 1500 | $1,650 | $1.10 | 45d | 1 | 1.07mi |
| 2617 Phoenix St Kenner, LA | 3.0 | 2.0 | 1350 | $1,800 | $1.33 | 45d | 1 | 1.14mi |
| 2752 Jasper St Unit A Kenner, LA | 3.0 | 1.5 | 1400 | $1,450 | $1.04 | 45d | 1 | 1.14mi |
| 2603 Panama St Kenner, LA | 3.0 | 1.5 | 1400 | $1,400 | $1.00 | 25d | 1 | 1.19mi |
| 3800 Grandlake Blvd Kenner, LA | 1.0–2.0 | 1.0–2.0 | 950 | $1,535 | $1.62 | 6d | 1 | 1.20mi |
| 3808 Tulane Dr Kenner, LA | 3.0 | 2.0 | 1220 | $2,000 | $1.64 | 45d | 1 | 1.21mi |
| 3816 W Louisiana State Dr Kenner, LA | 3.0 | 2.0 | 1400 | $1,800 | $1.29 | 13d | 1 | 1.23mi |
| 3345 Cannes Pl Kenner, LA | 3.0 | 2.0 | 1923 | $2,700 | $1.40 | 45d | 1 | 1.23mi |
| 3318 Cannes Pl Kenner, LA | 3.0 | 2.0 | 1700 | $2,100 | $1.24 | 45d | 1 | 1.24mi |
Listing history 22 events
-
2026-06-21days on market $115,000 Active 47 DOM
-
2026-06-18days on market $115,000 Active 44 DOM
-
2026-06-17days on market $115,000 Active 43 DOM
-
2026-06-16days on market $115,000 Active 42 DOM
-
2026-06-15days on market $115,000 Active 41 DOM
-
2026-06-13days on market $115,000 Active 39 DOM
-
2026-06-10days on market $115,000 Active 36 DOM
-
2026-06-09days on market $115,000 Active 35 DOM
-
2026-06-08days on market $115,000 Active 34 DOM
-
2026-06-07days on market $115,000 Active 33 DOM
-
2026-06-03days on market $115,000 Active 29 DOM
-
2026-06-02days on market $115,000 Active 28 DOM
-
2026-06-01days on market $115,000 Active 27 DOM
-
2026-05-31days on market $115,000 Active 26 DOM
-
2026-05-04$115,000 Active 463-char remark
Show marketing remark (460 chars)
Investor Alert!! This property needs a total rebuild. Extensive termite and water damage. Cash sale or approved construction loan. Will not qualify for any other loan types. Poor condition. Extensive termite damage. Has been treated but damage remains. Sold strictly as is. No repairs or replacements will be made. Utilities are not on and will not be turned on for inspections. Hold Harmless must be signed by each person entering the building. No exceptions.
-
2026-05-04$115,000 Active 460-char remark
Show marketing remark (460 chars)
Investor Alert!! This property needs a total rebuild. Extensive termite and water damage. Cash sale or approved construction loan. Will not qualify for any other loan types. Poor condition. Extensive termite damage. Has been treated but damage remains. Sold strictly as is. No repairs or replacements will be made. Utilities are not on and will not be turned on for inspections. Hold Harmless must be signed by each person entering the building. No exceptions.
-
2015-10-05soldstatus $159,900
-
2015-07-26$159,900
-
2004-09-01soldstatus $136,000
-
1996-05-24soldstatus $84,500
-
1996-03-08$88,900
-
1996-03-08$88,900
ⓘ Source: listings_history table (triggers on properties + properties_extension) + one-shot
backfill from property_details.listing_events for pre-trigger history.
Tax reassessment forecast LA · Resets to sale price
- Current annual tax
- $1,699 · $142/mo
- Projected year-2 tax
- $1,699 · $142/mo
- Expected delta
- $0/yr ($0/mo · 0.0%)
ⓘ Screening estimate from a state-policy table — verify with the county assessor before closing.
Nearby sold comps map
Loading sold comps map…
Walkable amenities ~0.75 mi
Loading nearby amenities…
Taxation est. · year 1
- Rental income
- $23,905
- − Mortgage interest
- −$6,442
- − Property taxes
- −$1,699
- − Insurance
- −$575
- − Repairs & maintenance
- −$1,912
- − Management
- −$1,912
- − Depreciation
- −$3,345
- Taxable income
- $8,019
- Est. tax owed @ 24.0%
- −$1,925
- After-tax cash flow
- $7,450/yr
For passive investors: Depreciation is non-cash, so a rental often shows a tax loss while cash-flowing — sheltering income. Rental losses are passive: they offset passive income freely, and up to $25,000/yr can offset ordinary (W-2) income if you actively participate and your MAGI is under $100k (phasing out to $0 by $150k); unused losses carry forward. On sale, claimed depreciation is recaptured at up to 25%, and gains may owe capital-gains tax (a 1031 exchange can defer both). Figures are a year-1 estimate at your 24.0% rate — not tax advice; consult a CPA.
Schools (NCES district)
- District
- Jefferson Parish
- NCES district ID
- 2200840
- Math proficiency
- 24% ▼ -36.00%
- Reading proficiency
- 34% ▼ -30.00%
- Median HH income
- $48,421
- Composite
- 25.19/100
- National rank
- #7511
- State rank
- #44 of 98 in LA
Livability — Kenner
- Score
- 78/100
- State rank
- #6
- US rank
- #2414
Category grades
Schools grade is shown separately in the Schools card above.
Census & demographics
- Census place
- Kenner, LA
- County
- Jefferson Parish · 426,999 people
- City population
- 66,707
- Metro
- New Orleans-Metairie, LA
- Population (ZIP)
- 48,936
- Household income
- $67,285
- Rent vs Own
- Severe rent burden
- 1906.0
Population outlook (Jefferson County) Hauer SSP2
- Today (2025)
- 451,696 people
- By 2030
- 455,451 · +0.8%
- By 2040
- 458,308 · +1.5%
- By 2050
- 461,031 · +2.1%
- By 2075
- 476,351 · +5.5%
- By 2100
- 499,377 · +10.6%
Race, ethnicity, and origin ACS 2023
- Neighborhood character
- Diverse neighborhood (Simpson 0.69)
- Race & ethnicity
- White 47% Hispanic / Latino 27% Two or more races 15% Black 15% Asian 6%
- Hispanic origin (detail)
- Mexican 2% Puerto Rican 3% Cuban 2%
- Common ancestry
- Lithuanian 9% Slovak 1% Italian 1%
- Foreign-born
- 19% · Canada, China, Vietnam
- Languages at home
- 72% English-only · Spanish 21% Other Indo-European 3% Arabic 1%
Political lean MEDSL · Jefferson
- 2024 margin
- R (+12.9) · D 42.5% · R 55.5% · Other 2.1%
- 2008→2024 swing
- +13.6pp toward D · 2008: -26.6pp · 2024: -12.9pp
- All cycles
- 2024: R+12.9 2020: R+11.1 2016: R+14.8 2012: R+18.4 2008: R+26.6
Not yet ingested
- Civics
- —
Market trends
- HPI YoY
- ▼ -214.79%
- Current HPI
- 139.5115
- Rent YoY
- ▼ -4.19%
- Metro
- New Orleans-Metairie, LA
- State GDP YoY
- ▲ 3.29%
- F500 in state
- 10
Industry mix (Fortune 500 HQ in LA)
| Industry | F500 HQs | Revenue |
|---|---|---|
| Telecommunications | 2 | $23B |
|
||
| Utilities | 1 | $12B |
|
||
| Wholesale / Distribution | 1 | $5B |
|
||
| Advertising | 1 | $2B |
|
||
Price history
+29.4% since first listed8 events — show timeline
- 2026-05-04 Listed $115,000 AcadianaMLS
- 2026-05-04 Listed $115,000 GSREIN
- 2015-10-05 Sold (Public Records) $159,900 Public Records
- 2015-07-26 Listed $159,900 AcadianaMLS
- 2004-09-01 Sold (Public Records) $136,000 Public Records
- 1996-05-24 Sold (MLS) $84,500 GSREIN
- 1996-03-08 Listed $88,900 AcadianaMLS
- 1996-03-08 Listed $88,900 GSREIN
Property tax history
+3.3%/yrLatest (2025): $1,699 · -0.4% YoY. Source: county tax records.
Cash-flow waterfall
monthlySold comps — $/sqft
last 12 mo · ≤1 miLoading sold comps…