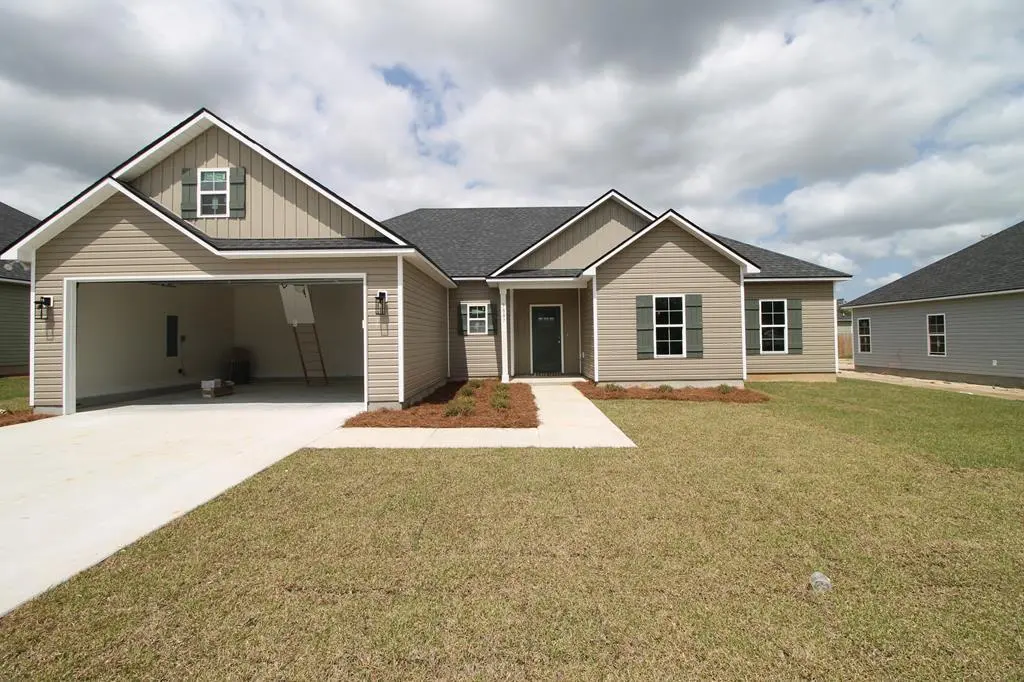
3887 Lu Ln · Hahira, GA
Flood risk 1/10 · Minimal
- FEMA flood zone
- X (unshaded)
- Chance of flooding over 30 yrs
- 0.0%
- Est. flood insurance / yr
- $507 – $1,088
Fire risk 8/10 · Major
- Est. fire insurance / yr
- $963 – $1,789
Heat risk 7/10 · Major
- Hot days now (above 108°F)
- 7 days/yr
- Hot days in 30 yrs
- 19 days/yr
Wind risk 8/10 · Major
- Chance of severe wind over 30 yrs
- 99.0%
Air-quality risk 6/10 · Moderate
- Unhealthy air days now
- 10 days/yr
- Unhealthy air days in 30 yrs
- 11 days/yr
Risk factors via First Street. Map © Google.
Why this score? — see what drove the D grade
The composite is a weighted blend of 9 inputs, each scored 0–100. Each bar is that input's sub-score; the figure is the points it added to the 100-point composite (weight × sub-score).
- Appreciation +10.0/10.0
- Cash flow +7.0/30.0
- ARV discount +7.0/15.0
- Schools +4.7/10.0
- Livability +3.4/5.0
- Rent growth +2.5/5.0
- Condition / age +2.5/5.0
- 1% rule +2.0/10.0
- DSCR +1.2/10.0
$314,900
🖨 Deal sheet (PDF) 📄 Offer letter ✓ Due diligence
Listing remarks MLS
New Construction! 4 bedroom/2bath home featuring vaulted ceiling, custom cabinets and more. Master bath has large walk in shower with his/her vanities on each side. The master bath also has split closets! LVP throughout bedrooms and living area of the home.
Key facts
- Custom cabinets
- New construction
- Vaulted ceiling
Tags
Neighborhood map
What this means for you Summary
Snapshot
- This is a 4-bed/2.0-bath single-family listed at $315k.
Deal economics
- At list price, monthly cash flow is $-459 ($-6k/yr) — negative.
- To cash-flow at today's rent, offer at most $249k (21.1% below list).
- To meet the 1% rule (rent ≥ 1% of price), the offer needs to be $220k (30.3% below list).
- Recommended offer: $220k (30.3% below list) — sets the bar for 1% rule.
Location & tenants
- Location reads 67/100 on livability (#161 in GA) — a middle-class / working-renter tenant base. Strengths: cost of living A+, housing A+; Watch: crime C-, employment D+, health & safety D.
- Lowndes County (rural): math 59% / reading 52% proficiency, ranked #8 of 174 in GA (top 5%) — acceptable for families but not a draw, mixed tenant base, ~2y average lease.
- Zoned schools: Dewar Elementary (math 61% / reading 47%, grade C, #204 of 1,228 statewide, top 17%, 859 students, 50% FRL); Hahira Middle School (math 65% / reading 63%, grade B+, #30 of 470 statewide, top 6%, 859 students, 32% FRL); Lowndes High School (math 69% / reading 51%, grade C+, #14 of 424 statewide, top 3%, 3,201 students, 39% FRL) — zoned schools at 40% FRL track the district average.
- Market conditions: 198 active listings in the ZIP; 5 comparable units currently listed for rent nearby; rentals at typical pace (median 23d on market — plan ~3-4 weeks tenant-placement turnaround); solid renter incomes; 896 units permitted in Lowndes County in 2024 (0 in 5+ unit buildings).
- This rent runs 31% of the median local income ($84k/yr) — at the standard rent-burdened threshold; future hikes will face affordability resistance.
Forward outlook
- In year one you build about $34k of equity ($2k loan paydown + $31k appreciation (10.0% local appreciation)).
- Lowndes County population projected at +10% by 2050 — modest demand growth; plan on rents tracking national, not racing it.
- By year 2, paydown + projected appreciation supports a ~$54k cash-out refi (75% LTV) — recoverable capital for the next deal without selling this one.
Negotiation context
- It's been on market 133 days — a 12% lower offer ($277k) is reasonable based on typical stale-listing flexibility.
- 2 sale attempts with the ask held roughly flat each time — persistent listings suggest the price (not the market) is what's stuck; bring a comps-based counter.
Risks & watch-outs
- Climate carrying-cost: severe wind risk, 99% chance of damaging wind over 30y; severe wildfire risk; extreme-heat days projected 7→19/yr by 2055 (HVAC capex compounding) — expect insurance premiums to compound above CPI over the hold.
Questions for the listing agent
- What do current leases actually rent for vs. the listed asking? Can we see a recent rent roll and the last 12 months of T-12 income?
- It's been on market 133 days. Have you received any prior offers? Is the seller open to a 30% concession, seller financing, or rate buy-down credit?
- What does the HOA fee cover, when was the last increase, and are there any pending special assessments or reserve-fund shortfalls?
- Why hasn't it sold? Are there any deal-killer items the seller is aware of (foundation, flood, title, zoning, code violations)?
- Is there a deadline driving the sale (1031 exchange, divorce, estate, relocation)? That informs how much negotiation room exists.
- The area grade is low — what's the realistic commute time and amenity access for the typical tenant pool here? Any planned neighborhood developments (good or bad) we should know about?
- What's the average days-on-market for RENTAL listings here right now (not sales)? A rising rental-DOM trend means longer vacancies and softer asking-rent achievability than the comps imply.
- What's the recent tenant-quality profile in this submarket — average credit score on applications, eviction rate, late-payment / NSF rate, and stable-employment percentage? A property-management company in the area should have these aggregated.
- How much new for-sale + rental construction is in the pipeline within 1–3 miles? Heavy new supply typically softens prices + rents 12–24 months out; constrained supply supports both.
Investment metrics
- 1% rule
- 0.70% ✗
- Cap rate
- 4.55%
- Cash-on-cash
- -6.24%
- DSCR
- 0.72
- GRM
- 12.0
CMA / ARV
- ARV (median comp)
- $311,488
- List price
- $314,900
- Delta
- 1.10%
- Verdict
- FAIR
- Comps
- 20 within 1.0 mi
Show comp detail 12 sales within ~0.75 mi
| Address | Dist | Beds/Ba | Sqft | Sold | Price | $/sf | Match |
|---|---|---|---|---|---|---|---|
| 3832 Bettys Pl | 0.13mi | 4/2.0 | 1,872 (-1%) | 0mo | $304,000 | $162 | 92 |
| 3879 Lu Ln | 0.00mi | 4/2.0 | 1,948 (+3%) | 4mo | $314,900 | $162 | 92 |
| 3963 Lu Ln | 0.05mi | 4/2.0 | 1,781 (-6%) | 0mo | $302,000 | $170 | 88 |
| 3950 Bettys Pl | 0.22mi | 4/2.0 | 1,851 (-2%) | 1mo | $287,500 | $155 | 85 |
| 3808 Renee Pl | 0.25mi | 4/2.0 | 1,938 (+2%) | 1mo | $321,900 | $166 | 84 |
| 3816 Renee Pl | 0.24mi | 4/2.0 | 1,927 (+2%) | 3mo | $317,600 | $165 | 83 |
| 3828 Lu Ln | 0.11mi | 4/2.0 | 2,023 (+7%) | 2mo | $332,524 | $164 | 82 |
| 3946 Bettys Pl | 0.22mi | 4/2.0 | 1,779 (-6%) | 1mo | $300,000 | $169 | 79 |
| 3835 Lu Ln | 0.09mi | 4/2.0 | 2,067 (+9%) | 2mo | $317,000 | $153 | 79 |
| 4005 Pearson Way | 0.70mi | 4/2.0 | 1,925 (+2%) | 0mo | $345,900 | $180 | 64 |
| 4185 Addalyn Way | 0.70mi | 4/2.0 | 1,811 (-4%) | 3mo | $279,900 | $155 | 58 |
| 3988 Nelson Hill Pl | 0.41mi | 3/2.0 (-1) | 1,630 (-14%) | 3mo | $260,000 | $160 | 50 |
Match score weights: distance 35% · size 25% · config 20% · recency 20%. Top-matched comps best support the ARV.
Projected returns pro-forma
10.0% appreciation · 3.0% rent growth · sell at horizon
- IRR
- 19.9%
- Equity multiple
- 2.61×
- Total profit
- $142,336
- Equity at exit
- $283,687
- IRR
- 18.2%
- Equity multiple
- 6.02×
- Total profit
- $442,214
- Equity at exit
- $611,781
Cash invested: $88,172 (down + closing). Projections, not guarantees.
Landlord ↔ Tenant lean methodology
- Overall (STATE)
- 90 Strongly Landlord-Friendly
- State Georgia
- 90 Strongly Landlord-Friendly · R+3
- County
- — inherits STATE
- City
- — inherits STATE
ZIP-level market 31632
- Home prices YoY
- 8.1%
- Active inventory
- 198
- Price-to-rent
- 12.0×
Monthly cashflow live
- Estimated rent
- $2,196 high interval (Pro) →
- Mortgage (P&I)
- −$1,651
- Tax est. 1.5%
- −$394 /mo · $4,724/yr
- Insurance
- −$131
- HOA
- −$17
- Vacancy / Maint / Mgmt
- −$461
- Net cashflow
- $-459
Break-even live
Sensitivity live
| Price | -10% $-241 | -5% $-350 | +0% $-459 | +5% $-567 | +10% $-676 |
|---|---|---|---|---|---|
| Rent | -10% $-632 | -5% $-545 | +0% $-459 | +5% $-372 | +10% $-285 |
| Rate | -1.0pp $-300 | -0.5pp $-379 | base $-459 | +0.5pp $-540 | +1.0pp $-623 |
UW: 25.0% down · 7.5% · 30yr · 1.5% tax · 5.0% vac · 8.0% maint · 8.0% mgmt
Financing live
Cash to close
- Down payment
- $78,725
- Closing costs
- $9,447
- Reserves months
- —
- Total cash needed
- —
Loan-product check · same deal, 3 products live
Conventional
25% down · 7.5% · 30yr
- Down + closing
- —
- Monthly P&I
- —
- Monthly cashflow
- —
- DSCR
- —
- Eligible?
- —
Personal DTI + credit; lowest rate.
DSCR
20% down · 8.5% · 30yr
- Down + closing
- —
- Monthly P&I
- —
- Monthly cashflow
- —
- DSCR
- —
- Eligible?
- —
No personal income docs; deal must DSCR.
Hard money
10% down · 12.0% · 12mo
- Down + closing
- —
- Monthly P&I
- —
- Monthly cashflow
- —
- DSCR
- —
- Eligible?
- —
Short-term bridge; refi at stabilization.
Rent comps 5 comps
| Address | Beds | Baths | Sqft | Rent | $/sqft | DOM | Units | Dist |
|---|---|---|---|---|---|---|---|---|
| 4112 Silver Gln Hahira, GA | 3.0 | 2.0 | 1534 | $1,750 | $1.14 | 45d | 1 | 0.61mi |
| 4171 Silver Gln Hahira, GA | 3.0 | 2.0 | 1544 | $1,650 | $1.07 | 22d | 1 | 0.74mi |
| 4194 Silver Gln Hahira, GA | 3.0 | 2.0 | 1650 | $1,795 | $1.09 | 22d | 1 | 0.77mi |
| 4162 Nelson Hill Pl Hahira, GA | 3.0 | 2.0 | 1561 | $1,900 | $1.22 | 22d | 1 | 0.78mi |
| 5048 Planters Xing Hahira, GA | 4.0 | 3.0 | 2160 | $2,500 | $1.16 | 22d | 1 | 1.09mi |
HOA detail
- Monthly dues
- $17 · $204/yr
Listing history 20 events
-
2026-06-21days on market $314,900 Active 133 DOM
-
2026-06-19days on market $314,900 Active 131 DOM
-
2026-06-18days on market $314,900 Active 130 DOM
-
2026-06-17days on market $314,900 Active 129 DOM
-
2026-06-16days on market $314,900 Active 128 DOM
-
2026-06-15days on market $314,900 Active 127 DOM
-
2026-06-14days on market $314,900 Active 125 DOM
-
2026-06-13days on market $314,900 Active 124 DOM
-
2026-06-10days on market $314,900 Active 122 DOM
-
2026-06-09days on market $314,900 Active 121 DOM
-
2026-06-08days on market $314,900 Active 120 DOM
-
2026-06-07days on market $314,900 Active 119 DOM
-
2026-06-05days on market $314,900 Active 116 DOM
-
2026-06-03days on market $314,900 Active 115 DOM
-
2026-06-02days on market $314,900 Active 114 DOM
-
2026-06-01days on market $314,900 Active 113 DOM
-
2026-05-31days on market $314,900 Active 112 DOM
-
2026-05-30days on market $314,900 Active 111 DOM
-
2026-02-18status Active 257-char remark
Show marketing remark (257 chars)
New Construction! 4 bedroom/2bath home featuring vaulted ceiling, custom cabinets and more. Master bath has large walk in shower with his/her vanities on each side. The master bath also has split closets! LVP throughout bedrooms and living area of the home.
-
2026-02-05$314,900 Active 257-char remark
Show marketing remark (257 chars)
New Construction! 4 bedroom/2bath home featuring vaulted ceiling, custom cabinets and more. Master bath has large walk in shower with his/her vanities on each side. The master bath also has split closets! LVP throughout bedrooms and living area of the home.
ⓘ Source: listings_history table (triggers on properties + properties_extension) + one-shot
backfill from property_details.listing_events for pre-trigger history.
Climate risk First Street
- Flood 1/10 Low FEMA zone X (unshaded) · 0% chance over 30 yrs
- Wildfire 8/10 Severe
- Heat 7/10 Severe 7 d/yr ≥108°F today · 19 d/yr by 30 yrs out
- Wind 8/10 Severe 99% chance of damaging wind over 30 yrs
- Air quality 6/10 Major 10 unhealthy d/yr today · 11 by 30 yrs out
Nearby sold comps map
Loading sold comps map…
Walkable amenities ~0.75 mi
Loading nearby amenities…
Taxation est. · year 1
- Rental income
- $26,348
- − Mortgage interest
- −$17,639
- − Property taxes
- −$4,724
- − Insurance
- −$1,574
- − Repairs & maintenance
- −$2,108
- − Management
- −$2,108
- − HOA
- −$204
- − Depreciation
- −$9,161
- Taxable loss
- −$11,170
- Est. tax savings @ 24.0%
- +$2,681
- After-tax cash flow
- $-2,823/yr
For passive investors: Depreciation is non-cash, so a rental often shows a tax loss while cash-flowing — sheltering income. Rental losses are passive: they offset passive income freely, and up to $25,000/yr can offset ordinary (W-2) income if you actively participate and your MAGI is under $100k (phasing out to $0 by $150k); unused losses carry forward. On sale, claimed depreciation is recaptured at up to 25%, and gains may owe capital-gains tax (a 1031 exchange can defer both). Figures are a year-1 estimate at your 24.0% rate — not tax advice; consult a CPA.
Schools (NCES district)
- District
- Lowndes County
- NCES district ID
- 1303390
- Math proficiency
- 59% ▼ -1.00%
- Reading proficiency
- 52% ▼ -2.00%
- Median HH income
- $48,221
- Composite
- 47.21/100
- National rank
- #2317
- State rank
- #8 of 174 in GA
Livability — Hahira
- Score
- 67/100
- State rank
- #161
- US rank
- #10280
Category grades
Schools grade is shown separately in the Schools card above.
Census & demographics
- County
- Lowndes County · 107,801 people
- Metro
- Valdosta, GA
- Population (ZIP)
- 15,942
- Household income
- $83,946
- Rent vs Own
- Severe rent burden
- 73.0
Population outlook (Lowndes County) Hauer SSP2
- Today (2025)
- 120,348 people
- By 2030
- 123,469 · +2.6%
- By 2040
- 128,482 · +6.8%
- By 2050
- 131,907 · +9.6%
- By 2075
- 139,080 · +15.6%
- By 2100
- 133,649 · +11.1%
Race, ethnicity, and origin ACS 2023
- Neighborhood character
- Predominantly White (79%)
- Race & ethnicity
- White 79% Black 12% Hispanic / Latino 6% Two or more races 5%
- Hispanic origin (detail)
- Mexican 2% Puerto Rican 2%
- Common ancestry
- Slovak 3% Serbian 2% Italian 1%
- Foreign-born
- 2% · Canada, Jamaica
- Languages at home
- 96% English-only · Spanish 3%
Political lean MEDSL · Lowndes
- 2024 margin
- R (+18.0) · D 40.8% · R 58.8%
- 2008→2024 swing
- -8.6pp toward R · 2008: -9.4pp · 2024: -18.0pp
- All cycles
- 2024: R+18.0 2020: R+12.0 2016: R+18.2 2012: R+10.5 2008: R+9.4
Not yet ingested
- Civics
- —
Market trends
- HPI YoY
- ▲ 19.44%
- Current HPI
- 259.01
- Rent YoY
- —
- Metro
- Valdosta, GA
- State GDP YoY
- ▲ 2.66%
- F500 in state
- 28
Industry mix (Fortune 500 HQ in GA)
| Industry | F500 HQs | Revenue |
|---|---|---|
| Paper / Packaging | 2 | $29B |
|
||
| Retail | 1 | $160B |
|
||
| Transportation / Logistics | 1 | $91B |
|
||
| Airlines | 1 | $62B |
|
||
| Consumer Goods | 1 | $47B |
|
||
| Utilities | 1 | $25B |
|
||
Price history
2 events — show timeline
- 2026-02-18 Relisted — SGMLS
- 2026-02-05 Listed $314,900 SGMLS
Cash-flow waterfall
monthlySold comps — $/sqft
last 12 mo · ≤1 miLoading sold comps…