 Multi-family
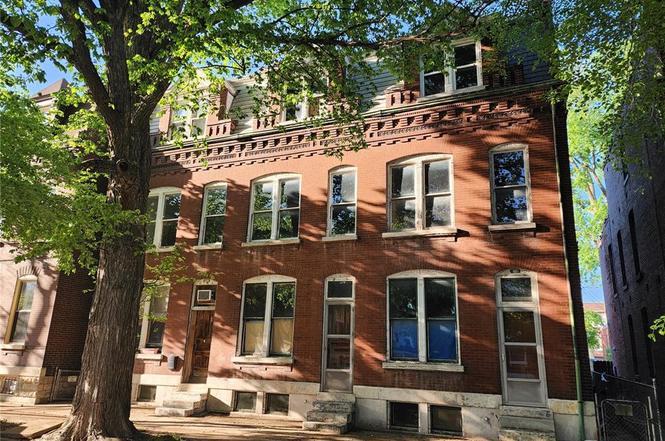
729 Shenandoah Ave · St. Louis, MO
Flood risk 3/10 · Minor
- FEMA flood zone
- X (unshaded)
- Chance of flooding over 30 yrs
- 0.12%
- Est. flood insurance / yr
- $473 – $860
Fire risk 1/10 · Minimal
- Est. fire insurance / yr
- $1,054 – $1,958
Heat risk 6/10 · Moderate
- Hot days now (above 109°F)
- 7 days/yr
- Hot days in 30 yrs
- 21 days/yr
Wind risk 2/10 · Minimal
- Chance of severe wind over 30 yrs
- 1.0%
Air-quality risk 3/10 · Minor
- Unhealthy air days now
- 3 days/yr
- Unhealthy air days in 30 yrs
- 4 days/yr
Risk factors via First Street. Map © Google.
Why this score? — see what drove the B+ grade
The composite is a weighted blend of 9 inputs, each scored 0–100. Each bar is that input's sub-score; the figure is the points it added to the 100-point composite (weight × sub-score).
- Cash flow +30.0/30.0
- ARV discount +15.0/15.0
- DSCR +10.0/10.0
- 1% rule +9.5/10.0
- Rent growth +4.4/5.0
- Livability +2.5/5.0
- Condition / age +2.5/5.0
- Schools +1.2/10.0
- Appreciation +0.0/10.0
$399,999
🖨 Deal sheet (PDF) 📄 Offer letter ✓ Due diligence
Multi-family units
County records classify this as Multi-Family (5+ Unit). Listing-text estimate: 1 unit. estimate disagrees with records
5+ unit building — per-unit beds/baths from public records are typically unavailable; the breakdown below (if shown) is an estimate from the listing text.
Listing remarks
Built 1892 this multi-unit building has the makings of 3 townhouses. 729 and 731 are mostly gutted and ready for rehab. 731 1/2 has 3 units and is occupied. New roof, new copper water service, tuckpointing in good condition.
Key facts
- Multi-unit building
- New roof
- 4,425 sq ft lot
Tags
Property features AI
Finance
- Other: Approximately 0.1016-acre lot
- Financial info: Annual property tax reported for 2025
Exterior
- Home design: Residential income property; Five-family (5+ units)
- Construction: Brick construction
- Exterior features: Located in the Soulard neighborhood
Interior
- Bedrooms: No main or upper-level bedrooms listed
- Bathrooms: No main or upper-level bathrooms listed
- Heating & cooling: Ceiling fans; Wall/window air conditioning units
- Interior features: Ceiling fans; Wall/window air conditioning units
Neighborhood map
What this means for you Summary
Snapshot
- This is a multifamily listed at $400k.
Deal economics
- At list price, monthly cash flow is $2k ($25k/yr) — positive.
- The deal already cash-flows at list — no discount required.
- Meets the 1% rule at list price ($6k rent vs $400k).
- Recommended offer: $388k (3.0% below list) — sets the bar for market timing.
- Cap rate 12.5% vs local median 5.0% in St. Louis — top-decile yield for the area; either an underpriced asset or a hidden risk that comps aren't pricing in. Stress-test before assuming the spread holds.
Location & tenants
- Location reads: area grade B — affects rentability + tenant quality, not the cash-flow math above.
- St. Louis City (urban): math 10% / reading 18% proficiency, ranked #312 of 324 in MO (top 96%) — low school quality limits family demand, transient renter base, plan for 1-2y turnover; 80% free/reduced lunch — lower-income household profile, screen leases tightly.
- Zoned schools: Adams Elem. (math 2% / reading 8%, grade F, #1,072 of 1,115 statewide, top 98%, 174 students, 98% FRL); Gateway Middle (math 0% / reading 8%, grade F, #389 of 391 statewide, top 100%, 506 students, 99% FRL); Beaumont Cte High School (math 5% / reading 5%, grade F, #517 of 521 statewide, top 100%, 236 students, 99% FRL) — zoned schools average 99% FRL vs 80% district-wide (18 pts higher); higher-poverty schools than district average — tighter screening recommended.
- Market conditions: Rents rising fast (+7.5%/yr); 165 active listings in the ZIP; 1 comparable units currently listed for rent nearby; 294 units permitted in St. Louis city in 2024 (227 in 5+ unit buildings).
- At $5,804/mo this rent would consume 101% of the median local household income ($69k/yr) (locally 1429% of renters already pay >50% of income on rent) — very limited rent-growth headroom before tenants either downsize or default.
Forward outlook
- Local home prices are declining (-3.0%/yr); year-one equity from $3k of loan paydown is wiped out by about $12k of value loss. Plan a longer hold.
- St. Louis County population projected to shrink 6% by 2050 — rents likely to lag national; underwrite the cash flow, not the appreciation.
- At projected returns (-3.0% appreciation + 7.5% rent growth), your $112k cash investment doubles in ~5 years — after that, you're playing with house money.
Negotiation context
- It's been on market 42 days — a 3% lower offer ($388k) is reasonable based on typical stale-listing flexibility.
Risks & watch-outs
- Watch-outs: built in 1892 — expect roof / HVAC / electrical / plumbing capex.
- Climate carrying-cost: extreme-heat days projected 7→21/yr by 2055 (HVAC capex compounding) — expect insurance premiums to compound above CPI over the hold.
Questions for the listing agent
- It's been on market 42 days. Have you received any prior offers? Is the seller open to a 3% concession, seller financing, or rate buy-down credit?
- Built in 1892 — when were the roof, HVAC, electrical panel, plumbing, and water heater last replaced?
- Is there a deadline driving the sale (1031 exchange, divorce, estate, relocation)? That informs how much negotiation room exists.
- What's the average days-on-market for RENTAL listings here right now (not sales)? A rising rental-DOM trend means longer vacancies and softer asking-rent achievability than the comps imply.
- What's the recent tenant-quality profile in this submarket — average credit score on applications, eviction rate, late-payment / NSF rate, and stable-employment percentage? A property-management company in the area should have these aggregated.
- How much new apartment / multifamily construction is in the pipeline within 1–3 miles? Heavy new supply (>2% of stock underway) typically softens rents 12–24 months out; light construction supports rent growth.
Investment metrics
- 1% rule
- 1.45% ✓
- Cap rate
- 12.53%
- Cash-on-cash
- 22.27%
- DSCR
- 1.99
- GRM
- 5.7
CMA / ARV
- ARV (median comp)
- $592,500
- List price
- $399,999
- Delta
- -32.49%
- Verdict
- UNDERPRICED
- Comps
- 20 within 1.0 mi
Show comp detail 5 sales within ~0.75 mi
| Address | Dist | Beds/Ba | Sqft | Sold | Price | $/sf | Match |
|---|---|---|---|---|---|---|---|
| 1022 Russell Blvd | 0.18mi | 12/10.0 | 6,528 (+2%) | 9mo | $850,000 | $130 | 81 |
| 2337 S 7th St | 0.11mi | 6/6.0 | 6,996 (+9%) | 5mo | $575,000 | $82 | 75 |
| 2016 S 9th St | 0.16mi | 6/6.0 | 5,500 (-14%) | 3mo | $400,000 | $73 | 67 |
| 2401 S 11th | 0.27mi | 12/13.0 | 5,700 (-11%) | 6mo | $689,900 | $121 | 64 |
| 912 Lafayette Ave | 0.45mi | 36/36.0 | 6,000 (-6%) | 9mo | $750,000 | $125 | 61 |
Match score weights: distance 35% · size 25% · config 20% · recency 20%. Top-matched comps best support the ARV.
Projected returns pro-forma
-3.0% appreciation · 7.52% rent growth · sell at horizon
- IRR
- 19.8%
- Equity multiple
- 1.85×
- Total profit
- $95,074
- Equity at exit
- $59,641
- IRR
- 30.9%
- Equity multiple
- 4.37×
- Total profit
- $377,283
- Equity at exit
- $34,585
Cash invested: $112,000 (down + closing). Projections, not guarantees.
Landlord ↔ Tenant lean methodology
- Overall (STATE)
- 81 Strongly Landlord-Friendly
- State Missouri
- 81 Strongly Landlord-Friendly · R+10
- County
- — inherits STATE
- City
- — inherits STATE
ZIP-level market 63104
- Rents YoY
- 7.5%
- Active inventory
- 165
- Price-to-rent
- 17.2×
Monthly cashflow live
- Estimated rent
- $5,804 high interval (Pro) →
- Mortgage (P&I)
- −$2,098
- Tax from tax record
- −$243 /mo · $2,911/yr
- Insurance
- −$167
- HOA
- −$0
- Vacancy / Maint / Mgmt
- −$1,219
- Net cashflow
- $2,078
Break-even live
Sensitivity live
| Price | -10% $2,305 | -5% $2,191 | +0% $2,078 | +5% $1,965 | +10% $1,852 |
|---|---|---|---|---|---|
| Rent | -10% $1,620 | -5% $1,849 | +0% $2,078 | +5% $2,307 | +10% $2,537 |
| Rate | -1.0pp $2,280 | -0.5pp $2,180 | base $2,078 | +0.5pp $1,975 | +1.0pp $1,869 |
3-unit breakdown (identical units grouped — click to expand)
| Units | Beds | Baths | Est. rent |
|---|---|---|---|
| 3× units | 2 | 1 | $5,805 |
| #1 | 2 | 1 | $1,935 |
| #2 | 2 | 1 | $1,935 |
| #3 | 2 | 1 | $1,935 |
| Total (3 units) | $5,804 | ||
UW: 25.0% down · 7.5% · 30yr · 1.5% tax · 5.0% vac · 8.0% maint · 8.0% mgmt
Financing live
Cash to close
- Down payment
- $100,000
- Closing costs
- $12,000
- Reserves months
- —
- Total cash needed
- —
Loan-product check · same deal, 3 products live
Conventional
25% down · 7.5% · 30yr
- Down + closing
- —
- Monthly P&I
- —
- Monthly cashflow
- —
- DSCR
- —
- Eligible?
- —
Personal DTI + credit; lowest rate.
DSCR
20% down · 8.5% · 30yr
- Down + closing
- —
- Monthly P&I
- —
- Monthly cashflow
- —
- DSCR
- —
- Eligible?
- —
No personal income docs; deal must DSCR.
Hard money
10% down · 12.0% · 12mo
- Down + closing
- —
- Monthly P&I
- —
- Monthly cashflow
- —
- DSCR
- —
- Eligible?
- —
Short-term bridge; refi at stabilization.
Rent comps 1 comps
| Address | Beds | Baths | Sqft | Rent | $/sqft | DOM | Units | Dist |
|---|---|---|---|---|---|---|---|---|
| 2303-2305 Russell Blvd St. Louis, MO | 2.0 | 1.0 | 6204 | $1,380 | $0.22 | 16d | 1 | 0.87mi |
Listing history 15 events
-
2026-06-17status $399,999 Pending 42 DOM
-
2026-06-17days on market $399,999 Active Under Contract 42 DOM
-
2026-06-16days on market $399,999 Active Under Contract 41 DOM
-
2026-06-15days on market $399,999 Active Under Contract 40 DOM
-
2026-06-13days on market $399,999 Active Under Contract 38 DOM
-
2026-06-09days on market $399,999 Active Under Contract 34 DOM
-
2026-06-08days on market $399,999 Active Under Contract 33 DOM
-
2026-06-07days on market $399,999 Active Under Contract 32 DOM
-
2026-06-05days on market $399,999 Active Under Contract 29 DOM
-
2026-06-03days on market $399,999 Active Under Contract 28 DOM
-
2026-06-02days on market $399,999 Active Under Contract 27 DOM
-
2026-06-01days on market $399,999 Active Under Contract 26 DOM
-
2026-05-31days on market $399,999 Active Under Contract 25 DOM
-
2026-05-07historical Active Under Contract 236-char remark
-
2026-05-06$399,999 Active 236-char remark
ⓘ Source: listings_history table (triggers on properties + properties_extension) + one-shot
backfill from property_details.listing_events for pre-trigger history.
Tax reassessment forecast MO · Resets to sale price
- Current annual tax
- $2,911 · $243/mo
- Projected year-2 tax
- $3,880 · $323/mo
- Expected delta
- +$969/yr (+$81/mo · 33.3%)
ⓘ Screening estimate from a state-policy table — verify with the county assessor before closing.
Climate risk First Street
- Flood 3/10 Moderate FEMA zone X (unshaded) · 12% chance over 30 yrs
- Wildfire 1/10 Low
- Heat 6/10 Major 7 d/yr ≥109°F today · 21 d/yr by 30 yrs out
- Wind 2/10 Low 100% chance of damaging wind over 30 yrs
- Air quality 3/10 Moderate 3 unhealthy d/yr today · 4 by 30 yrs out
Nearby sold comps map
Loading sold comps map…
Walkable amenities ~0.75 mi
Loading nearby amenities…
Taxation est. · year 1
- Rental income
- $69,648
- − Mortgage interest
- −$22,406
- − Property taxes
- −$2,911
- − Insurance
- −$2,000
- − Repairs & maintenance
- −$5,572
- − Management
- −$5,572
- − Depreciation
- −$11,636
- Taxable income
- $19,550
- Est. tax owed @ 24.0%
- −$4,692
- After-tax cash flow
- $20,247/yr
For passive investors: Depreciation is non-cash, so a rental often shows a tax loss while cash-flowing — sheltering income. Rental losses are passive: they offset passive income freely, and up to $25,000/yr can offset ordinary (W-2) income if you actively participate and your MAGI is under $100k (phasing out to $0 by $150k); unused losses carry forward. On sale, claimed depreciation is recaptured at up to 25%, and gains may owe capital-gains tax (a 1031 exchange can defer both). Figures are a year-1 estimate at your 24.0% rate — not tax advice; consult a CPA.
Schools (NCES district)
- District
- St. Louis City
- NCES district ID
- 2929280
- Math proficiency
- 10% ▼ -6.00%
- Reading proficiency
- 18% ▼ -3.00%
- Median HH income
- $35,685
- Composite
- 11.54/100
- National rank
- #9699
- State rank
- #312 of 324 in MO
Livability — St. Louis
No livability data for this city. (Only ~50 U.S. cities are tracked.)
Census & demographics
- Census place
- St. Louis, MO
- County
- Saint Louis City · 254,015 people
- City population
- 283,259
- Metro
- St. Louis, MO-IL
- Population (ZIP)
- 19,007
- Household income
- $68,764
- Rent vs Own
- Severe rent burden
- 1429.0
Population outlook (St. Louis County) Hauer SSP2
- Today (2025)
- 315,737 people
- By 2030
- 313,865 · -0.6%
- By 2040
- 305,439 · -3.3%
- By 2050
- 296,529 · -6.1%
- By 2075
- 271,028 · -14.2%
- By 2100
- 255,359 · -19.1%
Race, ethnicity, and origin ACS 2023
- Neighborhood character
- Diverse neighborhood (Simpson 0.60)
- Race & ethnicity
- White 51% Black 37% Two or more races 6% Hispanic / Latino 4% Asian 2%
- Common ancestry
- Romanian 3% Lithuanian 3% Slovak 2%
- Foreign-born
- 5% · Canada
- Languages at home
- 93% English-only · Other Indo-European 2% Spanish 1% German/W. Germanic 1%
Political lean MEDSL · St. Louis
- 2024 margin
- Solid D (+64.7) · D 81.4% · R 16.7% · Other 2.0%
- 2008→2024 swing
- -3.5pp toward R · 2008: 68.2pp · 2024: 64.7pp
- All cycles
- 2024: D+64.7 2020: D+66.2 2016: D+63.7 2012: D+66.6 2008: D+68.2
Not yet ingested
- Civics
- —
Market trends
- HPI YoY
- ▼ -159.69%
- Current HPI
- 252.3452
- Rent YoY
- ▲ 7.52%
- Metro
- St. Louis, MO-IL
- State GDP YoY
- ▲ 1.84%
- F500 in state
- 20
Industry mix (Fortune 500 HQ in MO)
| Industry | F500 HQs | Revenue |
|---|---|---|
| Healthcare | 1 | $163B |
|
||
| Insurance | 1 | $21B |
|
||
| Industrial Technology | 1 | $17B |
|
||
| Retail | 1 | $16B |
|
||
| Industrial Distribution | 1 | $10B |
|
||
| Utilities | 1 | $9B |
|
||
Price history
3 events — show timeline
- 2026-06-17 Pending — MARIS as Distributed by MLS Grid
- 2026-05-07 Contingent — MARIS as Distributed by MLS Grid
- 2026-05-06 Listed $399,999 MARIS as Distributed by MLS Grid
Property tax history
-2.0%/yrLatest (2024): $2,911 · +4.8% YoY. Source: county tax records.
Cash-flow waterfall
monthlySold comps — $/sqft
last 12 mo · ≤1 miLoading sold comps…