31434 Casacalenda Ln · Roman Forest, TX
Flood risk No data
- FEMA flood zone
- —
- Chance of flooding over 30 yrs
- —
- Est. flood insurance / yr
- —
Fire risk No data
- Est. fire insurance / yr
- —
Heat risk No data
- Hot days now (above threshold)
- —
- Hot days in 30 yrs
- —
Wind risk No data
- Chance of severe wind over 30 yrs
- —
Air-quality risk No data
- Unhealthy air days now
- —
- Unhealthy air days in 30 yrs
- —
Risk factors via First Street. Map © Google.
Why this score? — see what drove the C grade
The composite is a weighted blend of 9 inputs, each scored 0–100. Each bar is that input's sub-score; the figure is the points it added to the 100-point composite (weight × sub-score).
- Cash flow +17.0/30.0
- ARV discount +15.0/15.0
- 1% rule +5.8/10.0
- DSCR +5.3/10.0
- Condition / age +4.0/5.0
- Livability +3.3/5.0
- Schools +3.1/10.0
- Rent growth +2.5/5.0
- Appreciation +0.7/10.0
$199,590
🖨 Deal sheet (PDF) 📄 Offer letter ✓ Due diligence
Listing remarks
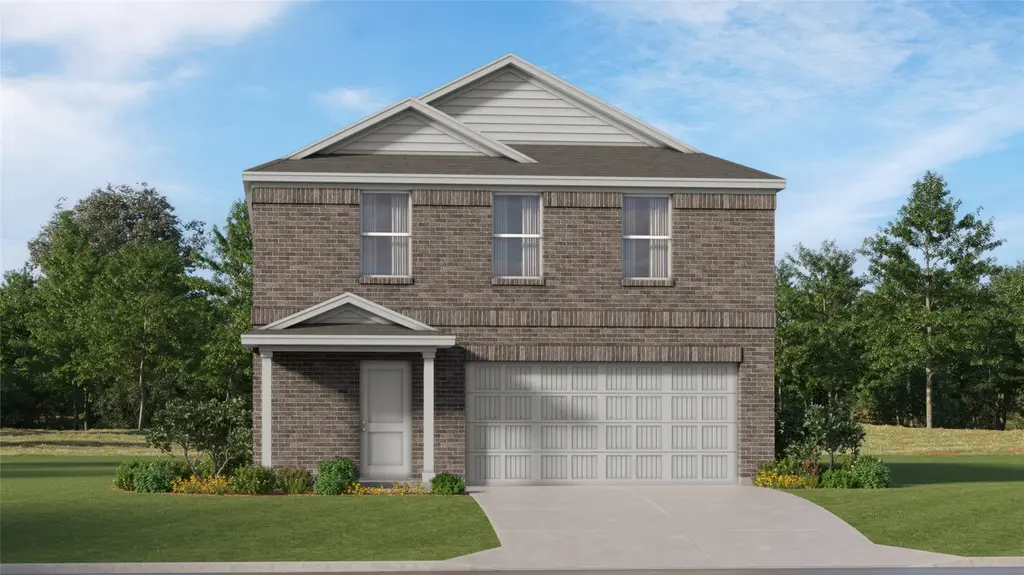
New Construction Lennar Houston Home - The Whitetail Floor Plan - The first floor of this two-story home shares a spacious open layout between the kitchen, dining room and family room for easy entertaining. Upstairs are three secondary bedrooms, ideal for residents and overnight guests, surrounding a versatile loft that serves as an additional shared living space. An owner's suite sprawls across the rear of the second floor and enjoys an en-suite bathroom and a walk-in closet. The completion date, prices and features may vary and are subject to change. Please verify with Lennar directly. Photos are for illustrative purposes only.
Key facts
- Walk-in closet
- Open layout
- En-suite bathroom
Tags
Neighborhood map
What this means for you Summary
Snapshot
- This is a 4-bed/2.5-bath single-family listed at $200k. Condition is rated good.
Deal economics
- At list price, monthly cash flow is $135 ($2k/yr) — positive.
- The deal already cash-flows at list — no discount required.
- Meets the 1% rule at list price ($2k rent vs $200k).
- Recommended offer: $188k (6.0% below list) — sets the bar for market timing.
- Cap rate 7.1% vs local median 4.9% in Roman Forest — top-decile yield for the area; either an underpriced asset or a hidden risk that comps aren't pricing in. Stress-test before assuming the spread holds.
Location & tenants
- Location reads 66/100 on livability (#595 in TX) — a middle-class / working-renter tenant base. Strengths: employment A+, housing A+, cost of living A; Watch: crime F, amenities F, commute F.
- Huffman ISD (rural): math 32% / reading 35% proficiency, ranked #500 of 826 in TX (top 60%) — families likely to look elsewhere, expect single-tenant / working-renter base with shorter leases.
- Zoned schools: Huffman Middle (math 36% / reading 32%, grade F, #892 of 1,662 statewide, top 55%, 907 students, 42% FRL); Hargrave H S (math 31% / reading 46%, grade F, #866 of 1,632 statewide, top 54%, 1,125 students, 36% FRL) — zoned schools at 39% FRL track the district average.
- Market conditions: 587 active listings in the ZIP; 1 comparable units currently listed for rent nearby; solid renter incomes; 29,883 units permitted in Harris County in 2024 (8,621 in 5+ unit buildings).
Forward outlook
- Local home prices are declining (-3.0%/yr); year-one equity from $1k of loan paydown is wiped out by about $6k of value loss. Plan a longer hold.
- Harris County population projected at +47% by 2050 — long-run rental-demand tailwind backs the buy-and-hold thesis.
Negotiation context
- It's been on market 72 days — a 6% lower offer ($188k) is reasonable based on typical stale-listing flexibility.
- 2 sale attempts with the ask held roughly flat each time — persistent listings suggest the price (not the market) is what's stuck; bring a comps-based counter.
Questions for the listing agent
- It's been on market 72 days. Have you received any prior offers? Is the seller open to a 6% concession, seller financing, or rate buy-down credit?
- What does the HOA fee cover, when was the last increase, and are there any pending special assessments or reserve-fund shortfalls?
- Why hasn't it sold? Are there any deal-killer items the seller is aware of (foundation, flood, title, zoning, code violations)?
- Is there a deadline driving the sale (1031 exchange, divorce, estate, relocation)? That informs how much negotiation room exists.
- Schools are F-rated, which usually means shorter tenancies and higher turnover. Who's the typical renter profile here, and what's been the actual vacancy rate?
- Crime grade is F in this area — have there been break-ins, vandalism, or insurance claims at this property in the last 3 years? What carrier currently insures it and at what premium?
- What's the average days-on-market for RENTAL listings here right now (not sales)? A rising rental-DOM trend means longer vacancies and softer asking-rent achievability than the comps imply.
- What's the recent tenant-quality profile in this submarket — average credit score on applications, eviction rate, late-payment / NSF rate, and stable-employment percentage? A property-management company in the area should have these aggregated.
- How much new for-sale + rental construction is in the pipeline within 1–3 miles? Heavy new supply typically softens prices + rents 12–24 months out; constrained supply supports both.
Investment metrics
- 1% rule
- 1.08% ✓
- Cap rate
- 7.10%
- Cash-on-cash
- 2.90%
- DSCR
- 1.13
- GRM
- 7.7
CMA / ARV
- ARV (median comp)
- $244,990
- List price
- $199,590
- Delta
- -18.53%
- Verdict
- UNDERPRICED
- Comps
- 20 within 1.0 mi
Show comp detail 12 sales within ~0.75 mi
| Address | Dist | Beds/Ba | Sqft | Sold | Price | $/sf | Match |
|---|---|---|---|---|---|---|---|
| 31422 Casacalenda Ln | 0.00mi | 4/2.5 | 2,039 (0%) | 3mo | $276,990 | $136 | 97 |
| 918 Lago Laceno Ln | 0.07mi | 4/2.5 | 2,039 (0%) | 3mo | $272,990 | $134 | 94 |
| 908 Lago Laceno Ln | 0.10mi | 4/2.5 | 2,039 (0%) | 3mo | $270,990 | $133 | 93 |
| 906 Coperchiata Cir | 0.14mi | 4/2.5 | 2,039 (0%) | 2mo | $271,990 | $133 | 92 |
| 31413 Pratola Serra Cir | 0.18mi | 4/2.5 | 2,039 (0%) | 2mo | $270,990 | $133 | 90 |
| 31424 Pratola Serra Cir | 0.18mi | 4/2.5 | 2,039 (0%) | 2mo | $280,990 | $138 | 90 |
| 911 Capracotta Dr | 0.15mi | 4/2.5 | 2,083 (+2%) | 3mo | $329,990 | $158 | 87 |
| 31517 Pianella Ln | 0.40mi | 4/2.0 | 1,968 (-4%) | 2mo | $288,990 | $147 | 72 |
| 912 Capracotta Dr | 0.17mi | 3/2.5 (-1) | 1,749 (-14%) | 1mo | $309,990 | $177 | 63 |
| 31507 San Floro Dr | 0.26mi | 3/2.0 (-1) | 1,792 (-12%) | 1mo | $304,990 | $170 | 59 |
| 31504 Pianella Ln | 0.40mi | 4/2.0 | 1,760 (-14%) | 2mo | $271,990 | $155 | 55 |
| 31515 Pianella Ln | 0.40mi | 4/2.0 | 1,760 (-14%) | 3mo | $277,990 | $158 | 54 |
Match score weights: distance 35% · size 25% · config 20% · recency 20%. Top-matched comps best support the ARV.
Projected returns pro-forma
-3.0% appreciation · 3.0% rent growth · sell at horizon
- IRR
- -11.6%
- Equity multiple
- 0.58×
- Total profit
- $-23,591
- Equity at exit
- $29,760
- IRR
- -2.3%
- Equity multiple
- 0.84×
- Total profit
- $-8,856
- Equity at exit
- $17,257
Cash invested: $55,885 (down + closing). Projections, not guarantees.
Landlord ↔ Tenant lean methodology
- Overall (STATE)
- 87 Strongly Landlord-Friendly
- State Texas
- 87 Strongly Landlord-Friendly · R+5
- County
- — inherits STATE
- City
- — inherits STATE
ZIP-level market 77336
- Home prices YoY
- -1.8%
- Active inventory
- 587
- Price-to-rent
- 7.7×
Monthly cashflow live
- Estimated rent
- $2,160 medium interval (Pro) →
- Mortgage (P&I)
- −$1,047
- Tax est. 1.5%
- −$249 /mo · $2,994/yr
- Insurance
- −$83
- HOA
- −$192
- Vacancy / Maint / Mgmt
- −$454
- Net cashflow
- $135
Break-even live
Sensitivity live
| Price | -10% $273 | -5% $204 | +0% $135 | +5% $66 | +10% $-3 |
|---|---|---|---|---|---|
| Rent | -10% $-36 | -5% $50 | +0% $135 | +5% $220 | +10% $306 |
| Rate | -1.0pp $236 | -0.5pp $186 | base $135 | +0.5pp $83 | +1.0pp $31 |
UW: 25.0% down · 7.5% · 30yr · 1.5% tax · 5.0% vac · 8.0% maint · 8.0% mgmt
Financing live
Cash to close
- Down payment
- $49,898
- Closing costs
- $5,988
- Reserves months
- —
- Total cash needed
- —
Loan-product check · same deal, 3 products live
Conventional
25% down · 7.5% · 30yr
- Down + closing
- —
- Monthly P&I
- —
- Monthly cashflow
- —
- DSCR
- —
- Eligible?
- —
Personal DTI + credit; lowest rate.
DSCR
20% down · 8.5% · 30yr
- Down + closing
- —
- Monthly P&I
- —
- Monthly cashflow
- —
- DSCR
- —
- Eligible?
- —
No personal income docs; deal must DSCR.
Hard money
10% down · 12.0% · 12mo
- Down + closing
- —
- Monthly P&I
- —
- Monthly cashflow
- —
- DSCR
- —
- Eligible?
- —
Short-term bridge; refi at stabilization.
Rent comps 1 comps
| Address | Beds | Baths | Sqft | Rent | $/sqft | DOM | Units | Dist |
|---|---|---|---|---|---|---|---|---|
| 31416 Pratola Serra Cir Huffman, TX | 3.0 | 2.0 | 1461 | $1,675 | $1.15 | 3d | 1 | 0.20mi |
HOA detail
- Monthly dues
- $192 · $2,304/yr
Listing history 20 events
-
2026-06-21days on market $199,590 Active 72 DOM
-
2026-06-18days on market $199,590 Active 69 DOM
-
2026-06-17remarks 637-char remark
-
2026-06-17days on market $199,590 Active 68 DOM
-
2026-06-16days on market $199,590 Active 67 DOM
-
2026-06-15days on market $199,590 Active 66 DOM
-
2026-06-13days on market $199,590 Active 64 DOM
-
2026-06-09days on market $199,590 Active 60 DOM
-
2026-06-08days on market $199,590 Active 59 DOM
-
2026-06-07days on market $199,590 Active 58 DOM
-
2026-06-04days on market $199,590 Active 55 DOM
-
2026-06-03days on market $199,590 Active 54 DOM
-
2026-06-02days on market $199,590 Active 53 DOM
-
2026-06-01days on market $199,590 Active 52 DOM
-
2026-05-31days on market $199,590 Active 51 DOM
-
2026-04-10historical
-
2026-04-10$199,590 Active
-
2026-04-09price $199,590
-
2026-04-07price $211,240
-
2026-03-30$218,990 Active
ⓘ Source: listings_history table (triggers on properties + properties_extension) + one-shot
backfill from property_details.listing_events for pre-trigger history.
Nearby sold comps map
Loading sold comps map…
Walkable amenities ~0.75 mi
Loading nearby amenities…
Taxation est. · year 1
- Rental income
- $25,919
- − Mortgage interest
- −$11,180
- − Property taxes
- −$2,994
- − Insurance
- −$998
- − Repairs & maintenance
- −$2,074
- − Management
- −$2,074
- − HOA
- −$2,304
- − Depreciation
- −$5,806
- Taxable loss
- −$1,510
- Est. tax savings @ 24.0%
- +$362
- After-tax cash flow
- $1,983/yr
For passive investors: Depreciation is non-cash, so a rental often shows a tax loss while cash-flowing — sheltering income. Rental losses are passive: they offset passive income freely, and up to $25,000/yr can offset ordinary (W-2) income if you actively participate and your MAGI is under $100k (phasing out to $0 by $150k); unused losses carry forward. On sale, claimed depreciation is recaptured at up to 25%, and gains may owe capital-gains tax (a 1031 exchange can defer both). Figures are a year-1 estimate at your 24.0% rate — not tax advice; consult a CPA.
Condition & rehab AI · 12 photos
This home is in good condition with a modern and well-maintained interior and exterior. It is ready for immediate occupancy and would benefit from a fresh coat of paint and some minor updates to the kitchen and flooring to further enhance its value.
Value-add opportunities
- Both Painting the exterior and interior (every 3-5 years) — Enhances curb appeal and interior aesthetics
- Resale Replace countertops (every 10-15 years) — Improves kitchen functionality and appearance
- Resale Replace flooring (every 10-15 years) — Enhances overall home value and appeal
Renovation cost estimate screening
Value-add ROI direction
- Both Painting the exterior and interior (every 3-5 years) — Enhances curb appeal and interior aesthetics ↑
- Resale Replace countertops (every 10-15 years) — Improves kitchen functionality and appearance ↑
- Resale Replace flooring (every 10-15 years) — Enhances overall home value and appeal ↑
ⓘ Cost ranges are severity-bucket heuristics (US national rule-of-thumb). Get contractor quotes + a written scope before underwriting a rehab budget.
Schools (NCES district)
- District
- Huffman ISD
- NCES district ID
- 4823820
- Math proficiency
- 32% ▼ -9.00%
- Reading proficiency
- 35% ▼ -9.00%
- Median HH income
- $65,848
- Composite
- 30.61/100
- National rank
- #6195
- State rank
- #500 of 826 in TX
Livability — Roman Forest
- Score
- 66/100
- State rank
- #595
- US rank
- #11338
Category grades
Schools grade is shown separately in the Schools card above.
Census & demographics
- County
- Harris County · 4,702,590 people
- Metro
- Houston-The Woodlands-Sugar Land, TX
- Population (ZIP)
- 14,342
- Household income
- $96,404
- Rent vs Own
- Severe rent burden
- 377.0
Population outlook (Harris County) Hauer SSP2
- Today (2025)
- 5,571,493 people
- By 2030
- 6,089,821 · +9.3%
- By 2040
- 7,142,806 · +28.2%
- By 2050
- 8,185,864 · +46.9%
- By 2075
- 10,574,329 · +89.8%
- By 2100
- 12,109,958 · +117.4%
Race, ethnicity, and origin ACS 2023
- Neighborhood character
- Majority White (65%)
- Race & ethnicity
- White 65% Hispanic / Latino 23% Two or more races 9% Black 5% Native American 4%
- Hispanic origin (detail)
- Mexican 20%
- Common ancestry
- Lithuanian 4% Slovak 2% Romanian 2%
- Foreign-born
- 9% · Canada
- Languages at home
- 79% English-only · Spanish 18% Other Indo-European 2%
Political lean MEDSL · Harris
- 2024 margin
- Lean D (+5.5) · D 52.0% · R 46.4% · Other 1.6%
- 2008→2024 swing
- +3.9pp toward D · 2008: 1.6pp · 2024: 5.5pp
- All cycles
- 2024: D+5.5 2020: D+13.3 2016: D+12.4 2012: D+0.1 2008: D+1.6
Not yet ingested
- Civics
- —
Market trends
- HPI YoY
- ▼ -8.59%
- Current HPI
- 472.03
- Rent YoY
- —
- Metro
- Houston-The Woodlands-Sugar Land, TX
- State GDP YoY
- ▲ 3.95%
- F500 in state
- 110
Industry mix (Fortune 500 HQ in TX)
| Industry | F500 HQs | Revenue |
|---|---|---|
| Energy | 16 | $1,198B |
|
||
| Technology | 5 | $198B |
|
||
| Engineering / Construction | 4 | $72B |
|
||
| Energy Services | 3 | $60B |
|
||
| Utilities | 3 | $41B |
|
||
| Healthcare | 2 | $330B |
|
||
Price history
-8.9% since first listed5 events — show timeline
- 2026-04-10 Listed $199,590 HARMLS
- 2026-04-10 Listing Removed — HARMLS
- 2026-04-09 Price Changed $199,590 HARMLS
- 2026-04-07 Price Changed $211,240 HARMLS
- 2026-03-30 Listed $218,990 HARMLS
Cash-flow waterfall
monthlySold comps — $/sqft
last 12 mo · ≤1 miLoading sold comps…