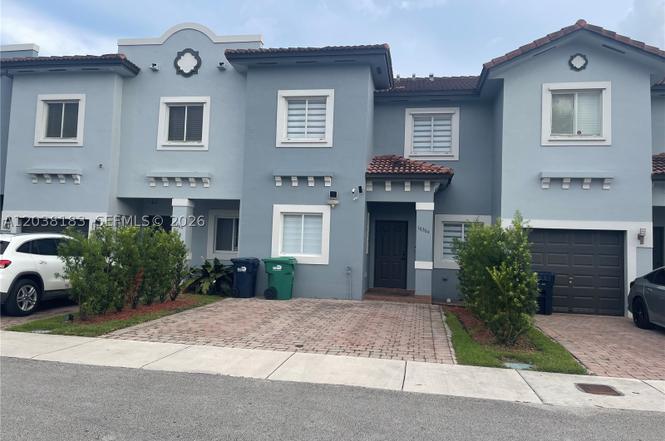
16364 SW 44th Way · Kendall West, FL
Flood risk 1/10 · Minimal
- FEMA flood zone
- AH
- Chance of flooding over 30 yrs
- 0.0%
- Est. flood insurance / yr
- $1,142 – $2,507
Fire risk 8/10 · Major
- Est. fire insurance / yr
- $947 – $1,759
Heat risk 10/10 · Severe
- Hot days now (above 106°F)
- 7 days/yr
- Hot days in 30 yrs
- 30 days/yr
Wind risk 10/10 · Severe
- Chance of severe wind over 30 yrs
- 99.0%
Air-quality risk 2/10 · Minimal
- Unhealthy air days now
- 1 days/yr
- Unhealthy air days in 30 yrs
- 1 days/yr
Risk factors via First Street. Map © Google.
Why this score? — see what drove the D grade
The composite is a weighted blend of 9 inputs, each scored 0–100. Each bar is that input's sub-score; the figure is the points it added to the 100-point composite (weight × sub-score).
- Cash flow +11.1/30.0
- ARV discount +7.5/15.0
- Appreciation +5.4/10.0
- Schools +4.2/10.0
- Rent growth +3.8/5.0
- Livability +3.8/5.0
- DSCR +3.2/10.0
- Condition / age +2.5/5.0
- 1% rule +2.2/10.0
$560,000
🖨 Deal sheet (PDF) 📄 Offer letter ✓ Due diligence
Listing remarks
ENJOY THE CONFORT OF A SPACIOUS 4 BED WITH 3 FULL BATH TOWNHOUSE THAT OFFERS GREAT PRIVACY FOR A FAMILY. A CONVENIENT FIRTS FLOOR 1 BED AND 1 BATH MAKE HOSTING GUESTS. CERAMIC FLOORING ON THE FIRST FLOOR, WOOD ON THE STAIRS AND PORCELAIN ON THE SECOND FLOOR. LAUNDRY ROOM ON THE SECOND FLOOR. KITCHEN WITH GRANITE COUNTER TOPS, STAINLESS STEEL APLIANCES, AND GRANITE TOPS IN ALL BATH. PRIVATE COVERED PATIO FOR ENTERTAIMENT. LOCATED IN A PEACEFULL AND BEAUTIFULL COMMUNITY WITH ONLY $65 FOR HOMEOWNERS AND EXCELLENT SCHOOLS. READY FOR YOU TO MOVE RIGHT IN.
Key facts
- Ceramic flooring
- Wood on stairs
- Laundry room
Tags
Property features AI
Finance
- Financial info: Pets allowed
- HOA & community: Monthly association fee; Association covers common areas and maintenance of structures
Exterior
- Parking: 2-car garage; Guest parking; Two or more parking spaces; 2 covered parking spaces
- Security: Complex fenced; Fire alarm; Smoke detectors
- Utilities: Has cooling; Has heating
- Home design: Single-story home; Resale property; Has attached property
- Construction: Block construction
- Exterior features: Fenced yard; Patio
Interior
- Kitchen: Dishwasher; Disposal; Microwave; Refrigerator
- Bedrooms: Main-level bedroom
- Flooring: Ceramic tile; Hardwood; Wood
- Bathrooms: 3 full bathrooms
- Heating & cooling: Central heating (electric); Central air (electric); Ceiling fans
- Interior features: Bedroom on main level; Breakfast area; Dining area; Separate/formal dining room; First floor entry; Pantry; Walk-in closet(s); Family room
- Laundry & utility: Washer; Dryer
Neighborhood map
What this means for you Summary
Snapshot
- This is a 4-bed/2.0-bath townhouse listed at $560k.
Deal economics
- At list price, monthly cash flow is $-378 ($-5k/yr) — negative.
- To cash-flow at today's rent, offer at most $493k (11.9% below list).
- To meet the 1% rule (rent ≥ 1% of price), the offer needs to be $403k (28.0% below list).
- Recommended offer: $403k (28.0% below list) — sets the bar for 1% rule.
- Cap rate 5.8% vs local median 3.5% in Kendall West — top-decile yield for the area; either an underpriced asset or a hidden risk that comps aren't pricing in. Stress-test before assuming the spread holds.
Location & tenants
- Location reads 75/100 on livability (#255 in FL, #4,028 nationally) — a middle-class / working-renter tenant base. Strengths: housing A+, health & safety A+, crime A-; Watch: amenities F.
- Miami-Dade (suburban): math 45% / reading 54% proficiency, ranked #40 of 73 in FL (top 55%) — families likely to look elsewhere, expect single-tenant / working-renter base with shorter leases; 64% free/reduced lunch — lower-income household profile, screen leases tightly.
- Zoned schools: Jane S. Roberts K-8 Center (math 61% / reading 73%, grade B+, #450 of 2,144 statewide, top 22%, 625 students, 52% FRL); Lamar Louise Curry Middle School (math 51% / reading 63%, grade B, #164 of 571 statewide, top 30%, 804 students, 50% FRL); John A. Ferguson Senior High (math 36% / reading 64%, grade D+, #175 of 667 statewide, top 27%, 4,368 students, 49% FRL).
- Market conditions: Rents rising fast (+5.4%/yr); 134 active listings in the ZIP; 40 comparable units currently listed for rent nearby; rentals at typical pace (median 24d on market — plan ~3-4 weeks tenant-placement turnaround); high-income renter base; 10,051 units permitted in Miami-Dade County in 2024 (7,758 in 5+ unit buildings).
- This rent runs 42% of the median local income ($114k/yr) — at the standard rent-burdened threshold; future hikes will face affordability resistance.
Forward outlook
- In year one you build about $8k of equity ($4k loan paydown + $4k appreciation (0.8% local appreciation)).
- Miami-Dade County population projected at +28% by 2050 — long-run rental-demand tailwind backs the buy-and-hold thesis.
- By year 5, paydown + projected appreciation supports a ~$40k cash-out refi (75% LTV) — recoverable capital for the next deal without selling this one.
Negotiation context
- Only 5 days on market — expect competitive offers; lowballing is unlikely to land.
Risks & watch-outs
- Watch-outs: flood insurance adds $152/mo.
- Climate carrying-cost: in FEMA flood zone AH (mandatory federal flood insurance); severe wind risk, 99% chance of damaging wind over 30y; severe wildfire risk; extreme-heat days projected 7→30/yr by 2055 (HVAC capex compounding) — expect insurance premiums to compound above CPI over the hold.
Questions for the listing agent
- What do current leases actually rent for vs. the listed asking? Can we see a recent rent roll and the last 12 months of T-12 income?
- What's the actual annual flood-insurance premium (NFIP or private), and is the property in a SFHA with mandatory coverage?
- Is there a deadline driving the sale (1031 exchange, divorce, estate, relocation)? That informs how much negotiation room exists.
- The area grade is low — what's the realistic commute time and amenity access for the typical tenant pool here? Any planned neighborhood developments (good or bad) we should know about?
- What's the average days-on-market for RENTAL listings here right now (not sales)? A rising rental-DOM trend means longer vacancies and softer asking-rent achievability than the comps imply.
- What's the recent tenant-quality profile in this submarket — average credit score on applications, eviction rate, late-payment / NSF rate, and stable-employment percentage? A property-management company in the area should have these aggregated.
- How much new for-sale + rental construction is in the pipeline within 1–3 miles? Heavy new supply typically softens prices + rents 12–24 months out; constrained supply supports both.
Investment metrics
- 1% rule
- 0.72% ✗
- Cap rate
- 5.81%
- Cash-on-cash
- -1.73%
- DSCR
- 0.92
- GRM
- 11.6
CMA / ARV
No comps found within radius.
Projected returns pro-forma
0.8% appreciation · 5.36% rent growth · sell at horizon
- IRR
- -1.2%
- Equity multiple
- 0.94×
- Total profit
- $-9,375
- Equity at exit
- $185,368
- IRR
- 5.2%
- Equity multiple
- 1.64×
- Total profit
- $101,056
- Equity at exit
- $241,909
Cash invested: $156,800 (down + closing). Projections, not guarantees.
Landlord ↔ Tenant lean methodology
- Overall (STATE)
- 87 Strongly Landlord-Friendly
- State Florida
- 87 Strongly Landlord-Friendly · R+3
- County
- — inherits STATE
- City
- — inherits STATE
ZIP-level market 33185
- Home prices YoY
- 0.1%
- Rents YoY
- 5.4%
- Active inventory
- 134
- Price-to-rent
- 11.6×
Monthly cashflow live
- Estimated rent
- $4,034 high interval (Pro) →
- Mortgage (P&I)
- −$2,937
- Tax from tax record
- −$243 /mo · $2,913/yr
- Insurance
- −$233
- Flood insurance flood zone
- −$152 /mo · $1,824/yr
- HOA
- −$0
- Vacancy / Maint / Mgmt
- −$847
- Net cashflow
- $-378
Break-even live
Sensitivity live
| Price | -10% $-61 | -5% $-219 | +0% $-378 | +5% $-536 | +10% $-695 |
|---|---|---|---|---|---|
| Rent | -10% $-697 | -5% $-537 | +0% $-378 | +5% $-219 | +10% $-59 |
| Rate | -1.0pp $-96 | -0.5pp $-235 | base $-378 | +0.5pp $-523 | +1.0pp $-671 |
UW: 25.0% down · 7.5% · 30yr · 1.5% tax · 5.0% vac · 8.0% maint · 8.0% mgmt
Financing live
Cash to close
- Down payment
- $140,000
- Closing costs
- $16,800
- Reserves months
- —
- Total cash needed
- —
Loan-product check · same deal, 3 products live
Conventional
25% down · 7.5% · 30yr
- Down + closing
- —
- Monthly P&I
- —
- Monthly cashflow
- —
- DSCR
- —
- Eligible?
- —
Personal DTI + credit; lowest rate.
DSCR
20% down · 8.5% · 30yr
- Down + closing
- —
- Monthly P&I
- —
- Monthly cashflow
- —
- DSCR
- —
- Eligible?
- —
No personal income docs; deal must DSCR.
Hard money
10% down · 12.0% · 12mo
- Down + closing
- —
- Monthly P&I
- —
- Monthly cashflow
- —
- DSCR
- —
- Eligible?
- —
Short-term bridge; refi at stabilization.
Rent comps 40 comps
| Address | Beds | Baths | Sqft | Rent | $/sqft | DOM | Units | Dist |
|---|---|---|---|---|---|---|---|---|
| 4452 SW 163rd Ct Unit 4452 Miami, FL | 4.0 | 2.0 | 1490 | $3,450 | $2.32 | 15d | 1 | 0.08mi |
| 16355 SW 46th Ter Unit 16355 Miami, FL | 3.0 | 2.0 | 1525 | $3,550 | $2.33 | 4d | 1 | 0.08mi |
| 16355 SW 46th Ter Miami, FL | 3.0 | 2.0 | 1525 | $3,550 | $2.33 | 3d | 1 | 0.08mi |
| 4604 SW 164th Pl Miami, FL | 3.0 | 2.0 | 1472 | $3,300 | $2.24 | 25d | 1 | 0.13mi |
| 16432 SW 47th Ter Unit 16432 Miami, FL | 3.0 | 2.5 | 1753 | $3,600 | $2.05 | 25d | 1 | 0.14mi |
| 16432 SW 47th Ter Miami, FL | 3.0 | 2.5 | 1753 | $3,700 | $2.11 | 25d | 1 | 0.14mi |
| 16303 SW 44th Ter Unit 16303 Miami, FL | 3.0 | 2.5 | 1400 | $3,300 | $2.36 | 9d | 1 | 0.15mi |
| 16336 SW 48th Ter Unit 16336 Miami, FL | 4.0 | 3.0 | 1846 | $3,900 | $2.11 | 22d | 1 | 0.24mi |
| 16336 SW 48th Ter Miami, FL | 4.0 | 3.0 | 1846 | $3,900 | $2.11 | 20d | 1 | 0.24mi |
| 16336 SW 48th Ter Unit 16336 Miami, FL | 4.0 | 3.0 | 1846 | $3,800 | $2.06 | 0d | 1 | 0.24mi |
| 16628 SW 47th Ter Miami, FL | 3.0 | 2.5 | 1753 | $3,400 | $1.94 | 3d | 1 | 0.27mi |
| 16628 SW 47th Ter Miami, FL | 3.0 | 2.5 | 1753 | $3,400 | $1.94 | 18d | 1 | 0.27mi |
| 4760 SW 166th Ct Miami, FL | 3.0 | 2.0 | 1327 | $2,900 | $2.19 | 25d | 1 | 0.31mi |
| 16550 SW 42nd Ter #16550 Miami, FL | 4.0 | 3.5 | 2025 | $3,750 | $1.85 | 25d | 1 | 0.41mi |
| 16479 SW 53rd St Miami, FL | 4.0 | 2.0 | 1953 | $4,500 | $2.30 | 25d | 1 | 0.43mi |
| 5282 SW 164th Pl Miami, FL | 4.0 | 2.0 | 1865 | $3,999 | $2.14 | 25d | 1 | 0.44mi |
| 16266 SW 54th Ter Miami, FL | 4.0 | 2.0 | 1708 | $3,700 | $2.17 | 25d | 1 | 0.54mi |
| 16266 SW 54th Ter Miami, FL | 4.0 | 2.0 | 1708 | $3,700 | $2.17 | 13d | 1 | 0.54mi |
| 16266 SW 54th Ter Miami, FL | 4.0 | 2.0 | 1708 | $3,700 | $2.17 | 18d | 1 | 0.54mi |
| 5060 SW 159th Ave Miami, FL | 3.0 | 2.5 | 1717 | $3,600 | $2.10 | 0d | 1 | 0.56mi |
| 5060 SW 159th Ave Miami, FL | 3.0 | 2.5 | 1717 | $3,600 | $2.10 | 25d | 1 | 0.56mi |
| 5204 SW 159th Ct Unit 5204 Miami, FL | 5.0 | 2.0 | 1953 | $5,500 | $2.82 | 25d | 1 | 0.57mi |
| 15873 SW 43rd St Miami, FL | 4.0 | 2.5 | 1851 | $3,900 | $2.11 | 25d | 1 | 0.58mi |
| 15716 SW 43rd St Miami, FL | 4.0 | 2.0 | 2039 | $3,800 | $1.86 | 25d | 1 | 0.73mi |
| 5841 SW 162nd Ct Unit 5841 Miami, FL | 3.0 | 2.0 | 1224 | $2,899 | $2.37 | 9d | 1 | 0.80mi |
| 5841 SW 162nd Ct Unit 5841 Miami, FL | 3.0 | 2.0 | 1224 | $2,899 | $2.37 | 21d | 1 | 0.80mi |
| 4128 SW 156th Ct Unit NA Miami, FL | 3.0 | 1.0 | 1819 | $4,000 | $2.20 | 9d | 1 | 0.86mi |
| 4128 SW 156th Ct Miami, FL | 3.0 | 1.0 | 1819 | $4,000 | $2.20 | 25d | 1 | 0.86mi |
| 4671 SW 155th Pl Miami, FL | 4.0 | 3.0 | 2060 | $4,600 | $2.23 | 25d | 1 | 0.87mi |
| 15481 SW 47th Ter Unit 15481 Miami, FL | 3.0 | 3.0 | 2000 | $5,900 | $2.95 | 25d | 1 | 0.93mi |
| 15428 SW 50th Ter Miami, FL | 3.0 | 3.0 | 1895 | $4,500 | $2.37 | 23d | 1 | 0.99mi |
| 4668 SW 153rd Ct Miami, FL | 3.0 | 2.5 | 1815 | $4,000 | $2.20 | 25d | 1 | 1.03mi |
| 15356 SW 42nd Ln Miami, FL | 3.0 | 2.0 | 1616 | $3,650 | $2.26 | 21d | 1 | 1.05mi |
| 6352 SW 164th Path Miami, FL | 4.0 | 2.5 | 1665 | $3,100 | $1.86 | 25d | 1 | 1.09mi |
| 3810 SW 153rd Pl Miami, FL | 3.0 | 2.5 | 1255 | $2,950 | $2.35 | 23d | 1 | 1.17mi |
| 3748 SW 153rd Pl Unit West Miami, FL | 3.0 | 2.5 | 1220 | $3,100 | $2.54 | 25d | 1 | 1.20mi |
| 16012 SW 64th Ter Miami, FL | 4.0 | 2.0 | 1862 | $4,150 | $2.23 | 25d | 1 | 1.22mi |
| 15311 SW 52nd Ter Unit 15311 Miami, FL | 3.0 | 2.0 | 1565 | $3,250 | $2.08 | 0d | 1 | 1.22mi |
| 16186 SW 65th Ln Unit 16186 Miami, FL | 4.0 | 3.0 | 1899 | $4,200 | $2.21 | 6d | 1 | 1.25mi |
| 3773 SW 153rd Ct #3773 Miami, FL | 3.0 | 2.5 | 1220 | $3,300 | $2.70 | 4d | 1 | 1.26mi |
Listing history 4 events
-
2026-06-21days on market $560,000 Active 5 DOM
-
2026-06-18days on market $560,000 Active 2 DOM
-
2026-06-17remarks 557-char remark
-
2026-06-17$560,000 Active 1 DOM
ⓘ Source: listings_history table (triggers on properties + properties_extension) + one-shot
backfill from property_details.listing_events for pre-trigger history.
Tax reassessment forecast FL · Resets to sale price
- Current annual tax
- $2,913 · $243/mo
- Projected year-2 tax
- $4,648 · $387/mo
- Expected delta
- +$1,735/yr (+$145/mo · 59.6%)
ⓘ Screening estimate from a state-policy table — verify with the county assessor before closing.
Climate risk First Street
- Flood 1/10 Low FEMA zone AH · 0% chance over 30 yrs
- Wildfire 8/10 Severe
- Heat 10/10 Extreme 7 d/yr ≥106°F today · 30 d/yr by 30 yrs out
- Wind 10/10 Extreme 99% chance of damaging wind over 30 yrs
- Air quality 2/10 Low 1 unhealthy d/yr today · 1 by 30 yrs out
Nearby sold comps map
Loading sold comps map…
Walkable amenities ~0.75 mi
Loading nearby amenities…
Taxation est. · year 1
- Rental income
- $48,410
- − Mortgage interest
- −$31,369
- − Property taxes
- −$2,913
- − Insurance
- −$4,624
- − Repairs & maintenance
- −$3,873
- − Management
- −$3,873
- − Depreciation
- −$16,291
- Taxable loss
- −$14,533
- Est. tax savings @ 24.0%
- +$3,488
- After-tax cash flow
- $-1,046/yr
For passive investors: Depreciation is non-cash, so a rental often shows a tax loss while cash-flowing — sheltering income. Rental losses are passive: they offset passive income freely, and up to $25,000/yr can offset ordinary (W-2) income if you actively participate and your MAGI is under $100k (phasing out to $0 by $150k); unused losses carry forward. On sale, claimed depreciation is recaptured at up to 25%, and gains may owe capital-gains tax (a 1031 exchange can defer both). Figures are a year-1 estimate at your 24.0% rate — not tax advice; consult a CPA.
Schools (NCES district)
- District
- Miami-Dade
- NCES district ID
- 1200390
- Math proficiency
- 45% ▼ -16.00%
- Reading proficiency
- 54% ▼ -5.00%
- Median HH income
- $43,928
- Composite
- 41.76/100
- National rank
- #3397
- State rank
- #40 of 73 in FL
Livability — Kendall West
- Score
- 75/100
- State rank
- #255
- US rank
- #4028
Category grades
Schools grade is shown separately in the Schools card above.
Census & demographics
- County
- Miami-Dade County · 2,697,751 people
- Metro
- Miami-Fort Lauderdale-Pompano Beach, FL
- Population (ZIP)
- 28,555
- Household income
- $114,206
- Rent vs Own
- Severe rent burden
- 396.0
Population outlook (Miami-Dade County) Hauer SSP2
- Today (2025)
- 3,126,439 people
- By 2030
- 3,325,765 · +6.4%
- By 2040
- 3,697,561 · +18.3%
- By 2050
- 4,012,134 · +28.3%
- By 2075
- 4,605,612 · +47.3%
- By 2100
- 4,866,598 · +55.7%
Race, ethnicity, and origin ACS 2023
- Neighborhood character
- Predominantly Hispanic (84%)
- Race & ethnicity
- Hispanic / Latino 84% Two or more races 45% White 11% Asian 3%
- Hispanic origin (detail)
- Puerto Rican 4% Cuban 52% Dominican 2%
- Common ancestry
- Lithuanian 1% Russian 1%
- Foreign-born
- 54% · Canada, Jamaica, Dominican Republic
- Languages at home
- 13% English-only · Spanish 82% Other Indo-European 2% Chinese 1%
Political lean MEDSL · Miami-Dade
- 2024 margin
- R (+11.4) · D 43.9% · R 55.4%
- 2008→2024 swing
- -27.6pp toward R · 2008: 16.1pp · 2024: -11.4pp
- All cycles
- 2024: R+11.4 2020: D+7.3 2016: D+29.6 2012: D+23.7 2008: D+16.1
Not yet ingested
- Civics
- —
Market trends
- HPI YoY
- ▲ 0.80%
- Current HPI
- 572.21
- Rent YoY
- ▲ 5.36%
- Metro
- Miami-Fort Lauderdale-Pompano Beach, FL
- State GDP YoY
- ▲ 3.28%
- F500 in state
- 36
Industry mix (Fortune 500 HQ in FL)
| Industry | F500 HQs | Revenue |
|---|---|---|
| Industrial Technology | 2 | $29B |
|
||
| Insurance | 2 | $17B |
|
||
| Retail | 1 | $60B |
|
||
| Technology Distribution | 1 | $58B |
|
||
| Homebuilding | 1 | $35B |
|
||
| Technology Manufacturing | 1 | $35B |
|
||
Price history
1 event — show timeline
- 2026-06-15 Listed $560,000 MARMLS
Property tax history
-1.5%/yrLatest (2025): $2,913 · +2.7% YoY. Source: county tax records.
Cash-flow waterfall
monthlySold comps — $/sqft
last 12 mo · ≤1 miLoading sold comps…