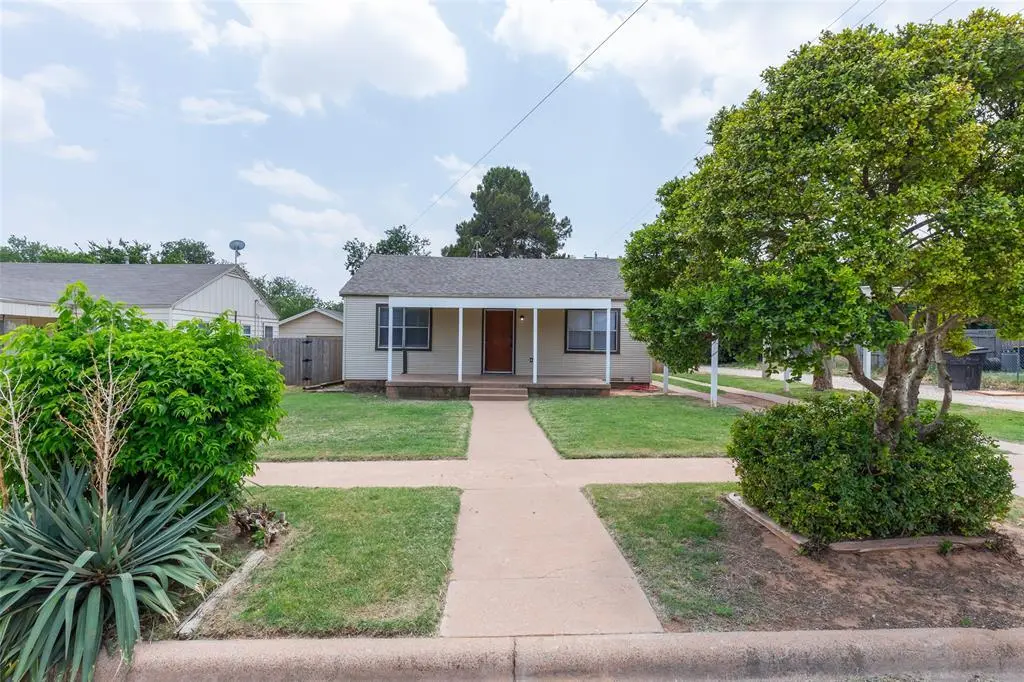
833 S 17th St · Abilene, TX
Flood risk 1/10 · Minimal
- FEMA flood zone
- X (unshaded)
- Chance of flooding over 30 yrs
- 0.0%
- Est. flood insurance / yr
- $507 – $1,088
Fire risk 3/10 · Minor
- Est. fire insurance / yr
- $1,222 – $2,270
Heat risk 7/10 · Major
- Hot days now (above 103°F)
- 7 days/yr
- Hot days in 30 yrs
- 24 days/yr
Wind risk 4/10 · Minor
- Chance of severe wind over 30 yrs
- 11.0%
Air-quality risk 1/10 · Minimal
- Unhealthy air days now
- 0 days/yr
- Unhealthy air days in 30 yrs
- 0 days/yr
Risk factors via First Street. Map © Google.
Why this score? — see what drove the C+ grade
The composite is a weighted blend of 9 inputs, each scored 0–100. Each bar is that input's sub-score; the figure is the points it added to the 100-point composite (weight × sub-score).
- Cash flow +30.0/30.0
- DSCR +10.0/10.0
- 1% rule +9.0/10.0
- Rent growth +5.0/5.0
- Livability +3.8/5.0
- Schools +2.8/10.0
- Condition / age +2.5/5.0
- ARV discount +0.8/15.0
- Appreciation +0.0/10.0
$140,000
🖨 Deal sheet 📄 Offer letter ✓ Due diligence
Listing remarks MLS
Owner. Agent, Cute 2 bedroom, hardwood floors in living and both bedrooms; bathroom updated in 2010. Washer, dryer and stove stays with the property, 2 window units stay with the property. Large backyard with wooden fence. NEW ROOF COMING SOON!
Key facts
- Added privacy
- Spacious backyard
- 7,013 sq ft lot
Tags
Property features AI
Finance
- Financial info: Accepts cash and conventional financing
- HOA & community: No association
Exterior
- Parking: 2-space carport; On-street parking available
- Security: Smoke detectors installed
- Utilities: City water; City sewer; Cable available
- Home design: Single-family residence; Residential property; Built in 1952; Not attached to other properties
- Construction: Siding exterior; Composition roof; Pillar/post/pier foundation
- Exterior features: Wood fencing; Lot under 0.5 acre (approx. 0.1610 acres)
Interior
- Kitchen: Electric range; Refrigerator; Kitchen includes laundry area
- Bedrooms: 2 bedrooms (both on main level)
- Bathrooms: 1 full bathroom
- Heating & cooling: Floor furnace heating; Wall/window air conditioning units
- Interior features: Cable TV available; High-speed internet available; 1 living area; 3 total rooms; One-level layout
- Laundry & utility: Laundry located in kitchen
Neighborhood map
What this means for you Summary
Snapshot
- This is a 2-bed/1.0-bath single-family listed at $140k.
Deal economics
- At list price, monthly cash flow is $649 ($8k/yr) — positive.
- The deal already cash-flows at list — no discount required.
- Meets the 1% rule at list price ($2k rent vs $140k).
- Cap rate 11.9% vs local median 6.7% in Abilene — top-decile yield for the area; either an underpriced asset or a hidden risk that comps aren't pricing in. Stress-test before assuming the spread holds.
Location & tenants
- Location reads 75/100 on livability (#142 in TX, #4,037 nationally) — a middle-class / working-renter tenant base. Strengths: cost of living A+, housing A+, health & safety A+; Watch: crime D, commute F.
- Abilene ISD (urban): math 32% / reading 34% proficiency, ranked #575 of 826 in TX (top 70%) — families likely to look elsewhere, expect single-tenant / working-renter base with shorter leases.
- Zoned schools: Bowie El (math 34% / reading 36%, grade F, #1,965 of 4,322 statewide, top 46%, 476 students, 87% FRL) — zoned schools average 87% FRL vs 57% district-wide (30 pts higher); higher-poverty schools than district average — tighter screening recommended.
- Market conditions: Rents rising fast (+33.5%/yr); 370 active listings in the ZIP; 13 comparable units currently listed for rent nearby; rentals at typical pace (median 21d on market — plan ~3-4 weeks tenant-placement turnaround); solid renter incomes; 508 units permitted in Taylor County in 2024 (0 in 5+ unit buildings).
Forward outlook
- Local home prices are declining (-3.0%/yr); year-one equity from $968 of loan paydown is wiped out by about $4k of value loss. Plan a longer hold.
- Taylor County population projected at +16% by 2050 — long-run rental-demand tailwind backs the buy-and-hold thesis.
- At projected returns (-3.0% appreciation + 8.0% rent growth), your $39k cash investment doubles in ~5 years — after that, you're playing with house money.
Negotiation context
- Only 13 days on market — expect competitive offers; lowballing is unlikely to land.
- 3 sale attempts since 17y ago with the ask held roughly flat each time — persistent listings suggest the price (not the market) is what's stuck; bring a comps-based counter.
Risks & watch-outs
- Watch-outs: built in 1952 — expect roof / HVAC / electrical / plumbing capex.
- Climate carrying-cost: extreme-heat days projected 7→24/yr by 2055 (HVAC capex compounding) — expect insurance premiums to compound above CPI over the hold.
Questions for the listing agent
- Built in 1952 — when were the roof, HVAC, electrical panel, plumbing, and water heater last replaced?
- Is there a deadline driving the sale (1031 exchange, divorce, estate, relocation)? That informs how much negotiation room exists.
- Schools are D-rated, which usually means shorter tenancies and higher turnover. Who's the typical renter profile here, and what's been the actual vacancy rate?
- Crime grade is D in this area — have there been break-ins, vandalism, or insurance claims at this property in the last 3 years? What carrier currently insures it and at what premium?
- What's the average days-on-market for RENTAL listings here right now (not sales)? A rising rental-DOM trend means longer vacancies and softer asking-rent achievability than the comps imply.
- What's the recent tenant-quality profile in this submarket — average credit score on applications, eviction rate, late-payment / NSF rate, and stable-employment percentage? A property-management company in the area should have these aggregated.
- How much new for-sale + rental construction is in the pipeline within 1–3 miles? Heavy new supply typically softens prices + rents 12–24 months out; constrained supply supports both.
Investment metrics
- 1% rule
- 1.40% ✓
- Cap rate
- 11.86%
- Cash-on-cash
- 19.87%
- DSCR
- 1.88
- GRM
- 6.0
CMA / ARV
- ARV (on-the-fly)
- $121,836
- Comps found
- 12
Show comp detail 12 sales within ~0.75 mi
| Address | Dist | Beds/Ba | Sqft | Sold | Price | $/sf | Match |
|---|---|---|---|---|---|---|---|
| 833 S 17th St | 0.00mi | 2/1.0 | 858 (0%) | 0mo | $140,000 | $163 | 100 |
| 1710 Oak St | 0.07mi | 2/1.0 | 840 (-2%) | 7mo | $119,500 | $142 | 87 |
| 2074 Belmont Blvd | 0.45mi | 2/1.0 | 804 (-6%) | 1mo | $135,000 | $168 | 68 |
| 2058 Belmont Blvd | 0.43mi | 2/1.0 | 814 (-5%) | 8mo | $95,000 | $117 | 64 |
| 1033 S 11th St | 0.63mi | 2/1.0 | 896 (+4%) | 3mo | $79,900 | $89 | 61 |
| 1642 S 15th | 0.59mi | 2/1.0 | 884 (+3%) | 9mo | $134,900 | $153 | 60 |
| 2217 Poplar St | 0.60mi | 3/1.0 (+1) | 880 (+3%) | 8mo | $99,900 | $114 | 56 |
| 1257 Pecan St | 0.47mi | 2/1.0 | 976 (+14%) | 3mo | $154,000 | $158 | 53 |
| 1110 S 15th St | 0.29mi | 3/1.0 (+1) | 964 (+12%) | 12mo | $115,000 | $119 | 51 |
| 1102 S 14th St | 0.34mi | 3/2.0 (+1) | 952 (+11%) | 11mo | $135,000 | $142 | 48 |
| 1041 Pecan St | 0.66mi | 2/1.0 | 954 (+11%) | 8mo | $77,500 | $81 | 44 |
| 2117 Jeanette St | 0.67mi | 2/1.0 | 980 (+14%) | 11mo | $125,900 | $128 | 36 |
Match score weights: distance 35% · size 25% · config 20% · recency 20%. Top-matched comps best support the ARV.
Projected returns pro-forma
-3.0% appreciation · 8.0% rent growth · sell at horizon
- IRR
- 17.3%
- Equity multiple
- 1.74×
- Total profit
- $28,965
- Equity at exit
- $20,874
- IRR
- 29.0%
- Equity multiple
- 4.20×
- Total profit
- $125,378
- Equity at exit
- $12,105
Cash invested: $39,200 (down + closing). Projections, not guarantees.
Landlord ↔ Tenant lean methodology
- Overall (STATE)
- 87 Strongly Landlord-Friendly
- State Texas
- 87 Strongly Landlord-Friendly · R+5
- County
- — inherits STATE
- City
- — inherits STATE
ZIP-level market 79602
- Home prices YoY
- -19.6%
- Rents YoY
- 33.5%
- Active inventory
- 370
- Price-to-rent
- 6.0×
Monthly cashflow live
- Estimated rent
- $1,953 high interval (Pro) →
- Mortgage (P&I)
- −$734
- Tax from tax record
- −$101 /mo · $1,217/yr
- Insurance
- −$58
- HOA
- −$0
- Vacancy / Maint / Mgmt
- −$410
- Net cashflow
- $649
Break-even live
UW: 25.0% down · 7.5% · 30yr · 1.5% tax · 5.0% vac · 8.0% maint · 8.0% mgmt
Financing live
Cash to close
- Down payment
- $35,000
- Closing costs
- $4,200
- Reserves months
- —
- Total cash needed
- —
Loan-product check · same deal, 3 products live
Conventional
25% down · 7.5% · 30yr
- Down + closing
- —
- Monthly P&I
- —
- Monthly cashflow
- —
- DSCR
- —
- Eligible?
- —
Personal DTI + credit; lowest rate.
DSCR
20% down · 8.5% · 30yr
- Down + closing
- —
- Monthly P&I
- —
- Monthly cashflow
- —
- DSCR
- —
- Eligible?
- —
No personal income docs; deal must DSCR.
Hard money
10% down · 12.0% · 12mo
- Down + closing
- —
- Monthly P&I
- —
- Monthly cashflow
- —
- DSCR
- —
- Eligible?
- —
Short-term bridge; refi at stabilization.
Rent comps 13 comps
| Address | Beds | Baths | Sqft | Rent | $/sqft | DOM | Units | Dist |
|---|---|---|---|---|---|---|---|---|
| 1368 Locust St Abilene, TX | 3.0 | 2.0 | 872 | $2,045 | $2.35 | 13d | 1 | 0.39mi |
| 1366 Locust St Abilene, TX | 3.0 | 2.0 | 872 | $1,804 | $2.07 | 13d | 1 | 0.39mi |
| 1320 Oak St Abilene, TX | 3.0 | 2.0 | 872 | $2,060 | $2.36 | 13d | 1 | 0.41mi |
| 1318 Oak St Abilene, TX | 3.0 | 2.0 | 872 | $1,814 | $2.08 | 21d | 1 | 0.41mi |
| 1312 Oak St Abilene, TX | 3.0 | 2.0 | 872 | $1,814 | $2.08 | 21d | 1 | 0.42mi |
| 1651 Palm St Abilene, TX | 2.0 | 1.0 | 760 | $2,500 | $3.29 | 43d | 1 | 0.44mi |
| 1649 Palm St Abilene, TX | 2.0 | 1.0 | 760 | $2,500 | $3.29 | 43d | 1 | 0.44mi |
| 1601 S 14th St Abilene, TX | 2.0 | 1.0 | 660 | $1,200 | $1.82 | 43d | 1 | 0.57mi |
| 1841 S 14th St Abilene, TX | 2.0 | 1.0 | 750 | $1,300 | $1.73 | 21d | 1 | 0.80mi |
| 619 Poplar St Abilene, TX | 2.0 | 1.0 | 884 | $1,695 | $1.92 | 13d | 1 | 1.11mi |
| 2400 Buffalo Gap Rd Abilene, TX | 1.0 | 1.0 | 700 | $1,000 | $1.43 | 43d | 1 | 1.19mi |
| 1934 Portland Ave Abilene, TX | 3.0 | 2.0 | 1108 | $1,900 | $1.71 | 43d | 1 | 1.24mi |
| 417 Meander St Abilene, TX | 3.0 | 2.0 | 872 | $1,814 | $2.08 | 13d | 1 | 1.39mi |
Listing history 14 events
-
2026-06-01statusdays on market $140,000 Pending 13 DOM
-
2026-05-31days on market $140,000 Active Option Contract 12 DOM
-
2026-05-30days on market $140,000 Active Option Contract 11 DOM
-
2026-05-18$140,000 Active
-
2021-08-17soldstatus
-
2015-04-27soldstatus
-
2015-04-24soldstatus Sold 244-char remark
Show marketing remark (244 chars)
Owner. Agent, Cute 2 bedroom, hardwood floors in living and both bedrooms; bathroom updated in 2010. Washer, dryer and stove stays with the property, 2 window units stay with the property. Large backyard with wooden fence. NEW ROOF COMING SOON!
-
2015-04-10status Pending 244-char remark
Show marketing remark (244 chars)
Owner. Agent, Cute 2 bedroom, hardwood floors in living and both bedrooms; bathroom updated in 2010. Washer, dryer and stove stays with the property, 2 window units stay with the property. Large backyard with wooden fence. NEW ROOF COMING SOON!
-
2015-04-07$42,900 Active 244-char remark
Show marketing remark (244 chars)
Owner. Agent, Cute 2 bedroom, hardwood floors in living and both bedrooms; bathroom updated in 2010. Washer, dryer and stove stays with the property, 2 window units stay with the property. Large backyard with wooden fence. NEW ROOF COMING SOON!
-
2010-03-24soldstatus 168-char remark
Show marketing remark (168 chars)
Great investment opportunity. Nice siding! Home has 2 bedrooms, 1 bath, hard wood floors on a quite street. Needs a little work, but would make a nice rental property.
-
2010-03-04soldstatus
-
2009-12-18historical 168-char remark
Show marketing remark (168 chars)
Great investment opportunity. Nice siding! Home has 2 bedrooms, 1 bath, hard wood floors on a quite street. Needs a little work, but would make a nice rental property.
-
2009-12-10$24,900 168-char remark
Show marketing remark (168 chars)
Great investment opportunity. Nice siding! Home has 2 bedrooms, 1 bath, hard wood floors on a quite street. Needs a little work, but would make a nice rental property.
-
1990-05-09soldstatus
ⓘ Source: listings_history table (triggers on properties + properties_extension) + one-shot
backfill from property_details.listing_events for pre-trigger history.
Tax reassessment forecast TX · Resets to sale price
- Current annual tax
- $1,217 · $101/mo
- Projected year-2 tax
- $2,562 · $214/mo
- Expected delta
- +$1,345/yr (+$112/mo · 110.5%)
ⓘ Screening estimate from a state-policy table — verify with the county assessor before closing.
Climate risk First Street
- Flood 1/10 Low FEMA zone X (unshaded) · 0% chance over 30 yrs
- Wildfire 3/10 Moderate
- Heat 7/10 Severe 7 d/yr ≥103°F today · 24 d/yr by 30 yrs out
- Wind 4/10 Moderate 11% chance of damaging wind over 30 yrs
- Air quality 1/10 Low 0 unhealthy d/yr today · 0 by 30 yrs out
Nearby sold comps map
Loading sold comps map…
Walkable amenities ~0.75 mi
Loading nearby amenities…
Taxation est. · year 1
- Rental income
- $23,439
- − Mortgage interest
- −$7,842
- − Property taxes
- −$1,217
- − Insurance
- −$700
- − Repairs & maintenance
- −$1,875
- − Management
- −$1,875
- − Depreciation
- −$4,073
- Taxable income
- $5,857
- Est. tax owed @ 24.0%
- −$1,406
- After-tax cash flow
- $6,384/yr
For passive investors: Depreciation is non-cash, so a rental often shows a tax loss while cash-flowing — sheltering income. Rental losses are passive: they offset passive income freely, and up to $25,000/yr can offset ordinary (W-2) income if you actively participate and your MAGI is under $100k (phasing out to $0 by $150k); unused losses carry forward. On sale, claimed depreciation is recaptured at up to 25%, and gains may owe capital-gains tax (a 1031 exchange can defer both). Figures are a year-1 estimate at your 24.0% rate — not tax advice; consult a CPA.
Schools (NCES district)
- District
- Abilene ISD
- NCES district ID
- 4807440
- Math proficiency
- 32% ▼ -11.00%
- Reading proficiency
- 34% ▼ -5.00%
- Median HH income
- $39,782
- Composite
- 27.71/100
- National rank
- #6909
- State rank
- #575 of 826 in TX
Livability — Abilene
- Score
- 75/100
- State rank
- #142
- US rank
- #4037
Category grades
Schools grade is shown separately in the Schools card above.
Census & demographics
- Census place
- Abilene, TX
- County
- Taylor County · 136,672 people
- City population
- 136,672
- Metro
- Abilene, TX
- Population (ZIP)
- 27,425
- Household income
- $89,551
- Rent vs Own
- Severe rent burden
- 338.0
Population outlook (Taylor County) Hauer SSP2
- Today (2025)
- 145,270 people
- By 2030
- 150,050 · +3.3%
- By 2040
- 159,417 · +9.7%
- By 2050
- 168,883 · +16.3%
- By 2075
- 194,436 · +33.8%
- By 2100
- 203,163 · +39.9%
Race, ethnicity, and origin ACS 2023
- Neighborhood character
- Majority White (64%)
- Race & ethnicity
- White 64% Hispanic / Latino 22% Two or more races 12% Black 10% Asian 2%
- Hispanic origin (detail)
- Mexican 19%
- Common ancestry
- Romanian 2% Italian 2% Portuguese 2%
- Foreign-born
- 6% · Canada, Vietnam, Jamaica
- Languages at home
- 87% English-only · Spanish 9% Other Asian/Pacific 1% French/Haitian/Cajun 1%
Political lean MEDSL · Taylor
- 2024 margin
- Solid R (+49.8) · D 24.6% · R 74.4% · Other 1.0%
- 2008→2024 swing
- -4.2pp toward R · 2008: -45.6pp · 2024: -49.8pp
- All cycles
- 2024: R+49.8 2020: R+45.3 2016: R+51.1 2012: R+53.6 2008: R+45.6
Not yet ingested
- Civics
- —
Market trends
- HPI YoY
- ▼ -46.04%
- Current HPI
- 189.3098
- Rent YoY
- ▲ 33.46%
- Metro
- Abilene, TX
- State GDP YoY
- ▲ 3.95%
- F500 in state
- 110
Industry mix (Fortune 500 HQ in TX)
| Industry | F500 HQs | Revenue |
|---|---|---|
| Energy | 16 | $1,198B |
|
||
| Technology | 5 | $198B |
|
||
| Engineering / Construction | 4 | $72B |
|
||
| Energy Services | 3 | $60B |
|
||
| Utilities | 3 | $41B |
|
||
| Healthcare | 2 | $330B |
|
||
Price history
+462.2% since first listed11 events — show timeline
- 2026-05-18 Listed $140,000 NTREIS
- 2021-08-17 Sold (Public Records) — Public Records
- 2015-04-27 Sold (Public Records) — Public Records
- 2015-04-24 Sold (MLS) — NTREIS
- 2015-04-10 Pending — NTREIS
- 2015-04-07 Listed $42,900 NTREIS
- 2010-03-24 Sold (MLS) — NTREIS
- 2010-03-04 Sold (Public Records) — Public Records
- 2009-12-18 Listing Removed — NTREIS
- 2009-12-10 Listed $24,900 NTREIS
- 1990-05-09 Sold (Public Records) — Public Records
Property tax history
+6.8%/yrLatest (2025): $1,217 · +3.5% YoY. Source: county tax records.
Cash-flow waterfall
monthlySold comps — $/sqft
last 12 mo · ≤1 miLoading sold comps…