2850 E Glenn St · Tucson, AZ
Flood risk 1/10 · Minimal
- FEMA flood zone
- X (unshaded)
- Chance of flooding over 30 yrs
- 0.0%
- Est. flood insurance / yr
- $507 – $1,088
Fire risk 1/10 · Minimal
- Est. fire insurance / yr
- $610 – $1,132
Heat risk 8/10 · Major
- Hot days now (above 106°F)
- 7 days/yr
- Hot days in 30 yrs
- 17 days/yr
Wind risk 1/10 · Minimal
- Chance of severe wind over 30 yrs
- —
Air-quality risk 1/10 · Minimal
- Unhealthy air days now
- 0 days/yr
- Unhealthy air days in 30 yrs
- 0 days/yr
Risk factors via First Street. Map © Google.
Why this score? — see what drove the D+ grade
The composite is a weighted blend of 9 inputs, each scored 0–100. Each bar is that input's sub-score; the figure is the points it added to the 100-point composite (weight × sub-score).
- ARV discount +15.0/15.0
- Cash flow +14.7/30.0
- DSCR +4.5/10.0
- Livability +3.7/5.0
- 1% rule +3.6/10.0
- Rent growth +2.8/5.0
- Condition / age +2.5/5.0
- Schools +1.6/10.0
- Appreciation +0.0/10.0
$224,900
🖨 Deal sheet 📄 Offer letter ✓ Due diligence
Listing remarks MLS
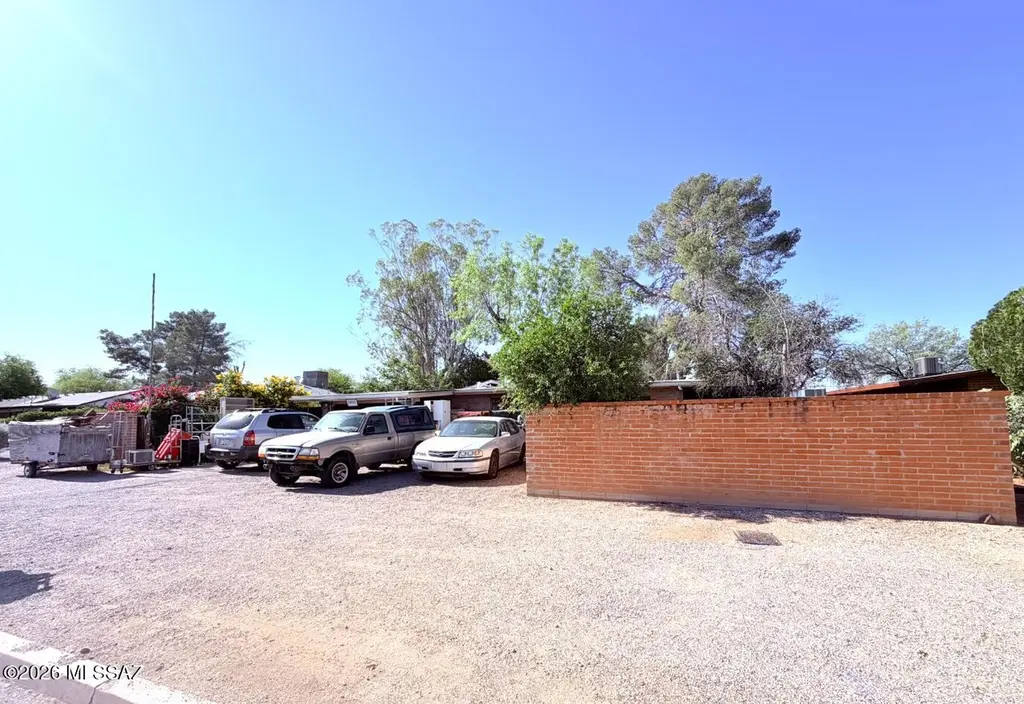
Beautiful brick home with privacy front court yard. Plantation Shutters. Cedar Closet. New Carpet,tile & skylights. Nutone food center,Floor safe,workshop & 2 hot water heaters. Expansive back yard full of color, patios, and charm. Lovingly cared for by family & ready for immediate occupancy.
Key facts
- Centrally located
- Shopping
- Full makeover
Tags
Property features AI
Finance
- Other: Zoned Tucson - R2
Exterior
- Parking: Attached garage; 2 covered/carport spaces
- Utilities: Public water; Sewer connected
- Home design: Single family residence; One story; Property listed as fixer; Property faces north
- Construction: Brick construction; Rolled/hot mop roof
- Exterior features: Shed(s); Workshop; Slab patio/porch; Block and wood fencing; Decorative gravel; North/South exposure; Paved road (city maintained); Street lights in community
Interior
- Kitchen: Gas range; Gas oven
- Flooring: Carpet; Ceramic tile
- Bathrooms: 2 full bathrooms
- Heating & cooling: Wall furnace; Heat pump; Central air; Ceiling fans; Evaporative cooling
- Interior features: Gas range and gas oven; Laundry room
- Laundry & utility: Laundry room
Neighborhood map
What this means for you Summary
Snapshot
- This is a 4-bed/3.0-bath single-family listed at $225k.
Deal economics
- At list price, monthly cash flow is $59 ($712/yr) — positive.
- The deal already cash-flows at list — no discount required.
- To meet the 1% rule (rent ≥ 1% of price), the offer needs to be $193k (14.3% below list).
- Recommended offer: $193k (14.3% below list) — sets the bar for 1% rule.
- Cap rate 6.6% vs local median 3.7% in Tucson — top-decile yield for the area; either an underpriced asset or a hidden risk that comps aren't pricing in. Stress-test before assuming the spread holds.
Location & tenants
- Location reads 74/100 on livability (#17 in AZ, #4,502 nationally) — a middle-class / working-renter tenant base. Strengths: commute A+, cost of living A+, housing A+; Watch: health & safety C-, crime F, employment D-.
- Tucson Unified District (4403) (urban): math 14% / reading 23% proficiency, ranked #190 of 249 in AZ (top 76%) — low school quality limits family demand, transient renter base, plan for 1-2y turnover.
- Zoned schools: Cragin Elementary School (math 2% / reading 22%, grade F, #944 of 1,109 statewide, top 87%, 263 students, 76% FRL); Doolen Middle School (math 11% / reading 17%, grade F, #164 of 218 statewide, top 76%, 538 students, 67% FRL); Catalina High School (math 5% / reading 5%, grade F, #364 of 381 statewide, top 100%, 600 students, 72% FRL).
- Market conditions: Rents rising (+1.4%/yr); 143 active listings in the ZIP; 37 comparable units currently listed for rent nearby; rentals at typical pace (median 17d on market — plan ~3-4 weeks tenant-placement turnaround); 5,268 units permitted in Pima County in 2024 (996 in 5+ unit buildings).
- At $1,927/mo this rent would consume 47% of the median local household income ($49k/yr) (locally 2241% of renters already pay >50% of income on rent) — very limited rent-growth headroom before tenants either downsize or default.
Forward outlook
- Local home prices are declining (-3.0%/yr); year-one equity from $2k of loan paydown is wiped out by about $7k of value loss. Plan a longer hold.
- Pima County population projected at +8% by 2050 — modest demand growth; plan on rents tracking national, not racing it.
Negotiation context
- It's been on market 31 days — a 3% lower offer ($218k) is reasonable based on typical stale-listing flexibility.
- 2 sale attempts since 22y ago; this cycle's ask has dropped $20k (8%) from the opening price — seller is motivated, your offer sets the floor, not the list.
- Current owner paid $185k; 22% above their basis — modest negotiation headroom, anchor on the comps not their cost.
Risks & watch-outs
- Watch-outs: built in 1951 — expect roof / HVAC / electrical / plumbing capex.
- Climate carrying-cost: extreme-heat days projected 7→17/yr by 2055 (HVAC capex compounding) — expect insurance premiums to compound above CPI over the hold.
Questions for the listing agent
- It's been on market 31 days. Have you received any prior offers? Is the seller open to a 14% concession, seller financing, or rate buy-down credit?
- Built in 1951 — when were the roof, HVAC, electrical panel, plumbing, and water heater last replaced?
- Is there a deadline driving the sale (1031 exchange, divorce, estate, relocation)? That informs how much negotiation room exists.
- Schools are D-rated, which usually means shorter tenancies and higher turnover. Who's the typical renter profile here, and what's been the actual vacancy rate?
- Crime grade is F in this area — have there been break-ins, vandalism, or insurance claims at this property in the last 3 years? What carrier currently insures it and at what premium?
- The area grade is low — what's the realistic commute time and amenity access for the typical tenant pool here? Any planned neighborhood developments (good or bad) we should know about?
- What's the average days-on-market for RENTAL listings here right now (not sales)? A rising rental-DOM trend means longer vacancies and softer asking-rent achievability than the comps imply.
- What's the recent tenant-quality profile in this submarket — average credit score on applications, eviction rate, late-payment / NSF rate, and stable-employment percentage? A property-management company in the area should have these aggregated.
- How much new for-sale + rental construction is in the pipeline within 1–3 miles? Heavy new supply typically softens prices + rents 12–24 months out; constrained supply supports both.
Investment metrics
- 1% rule
- 0.86% ✗
- Cap rate
- 6.61%
- Cash-on-cash
- 1.13%
- DSCR
- 1.05
- GRM
- 9.7
CMA / ARV
- ARV (on-the-fly)
- $371,406
- Comps found
- 12
Show comp detail 12 sales within ~0.75 mi
| Address | Dist | Beds/Ba | Sqft | Sold | Price | $/sf | Match |
|---|---|---|---|---|---|---|---|
| 2601 N Treat Ave | 0.24mi | 5/2.5 (+1) | 1,563 (+1%) | 4mo | $349,000 | $223 | 78 |
| 2926 E Glenn St | 0.08mi | 3/2.0 (-1) | 1,754 (+13%) | 0mo | $373,000 | $213 | 66 |
| 3156 E Towner St | 0.33mi | 3/2.0 (-1) | 1,638 (+5%) | 4mo | $340,000 | $208 | 63 |
| 2925 E Loretta Dr | 0.38mi | 3/2.0 (-1) | 1,432 (-8%) | 5mo | $342,000 | $239 | 56 |
| 2556 N Bentley Ave | 0.28mi | 4/2.0 | 1,761 (+13%) | 8mo | $389,000 | $221 | 54 |
| 2638 N Wilson Ave | 0.48mi | 3/2.0 (-1) | 1,444 (-7%) | 8mo | $310,000 | $215 | 50 |
| 3002 N Jackson Ave | 0.52mi | 3/2.0 (-1) | 1,400 (-10%) | 0mo | $399,000 | $285 | 50 |
| 3050 N Presidio Park Pl | 0.49mi | 3/2.0 (-1) | 1,421 (-9%) | 6mo | $345,000 | $243 | 49 |
| 3264 N Treat Cir | 0.67mi | 3/3.0 (-1) | 1,700 (+9%) | 4mo | $525,000 | $309 | 45 |
| 2115 E Blacklidge Dr | 0.68mi | 3/2.0 (-1) | 1,461 (-6%) | 7mo | $335,000 | $229 | 43 |
| 2259 E Spring St | 0.63mi | 3/2.0 (-1) | 1,360 (-12%) | 2mo | $375,000 | $276 | 39 |
| 3305 N Cardi Blvd | 0.69mi | 3/2.0 (-1) | 1,329 (-14%) | 6mo | $332,500 | $250 | 30 |
Match score weights: distance 35% · size 25% · config 20% · recency 20%. Top-matched comps best support the ARV.
Projected returns pro-forma
-3.0% appreciation · 1.39% rent growth · sell at horizon
- IRR
- -16.2%
- Equity multiple
- 0.43×
- Total profit
- $-35,763
- Equity at exit
- $33,533
- IRR
- -10.9%
- Equity multiple
- 0.39×
- Total profit
- $-38,590
- Equity at exit
- $19,445
Cash invested: $62,972 (down + closing). Projections, not guarantees.
Landlord ↔ Tenant lean methodology
- Overall (STATE)
- 87 Strongly Landlord-Friendly
- State Arizona
- 87 Strongly Landlord-Friendly · R+3
- County
- — inherits STATE
- City
- — inherits STATE
ZIP-level market 85716
- Rents YoY
- 1.4%
- Active inventory
- 143
- Price-to-rent
- 9.7×
Monthly cashflow live
- Estimated rent
- $1,927 high interval (Pro) →
- Mortgage (P&I)
- −$1,179
- Tax from tax record
- −$190 /mo · $2,276/yr
- Insurance
- −$94
- HOA
- −$0
- Vacancy / Maint / Mgmt
- −$405
- Net cashflow
- $59
Break-even live
UW: 25.0% down · 7.5% · 30yr · 1.5% tax · 5.0% vac · 8.0% maint · 8.0% mgmt
Financing live
Cash to close
- Down payment
- $56,225
- Closing costs
- $6,747
- Reserves months
- —
- Total cash needed
- —
Loan-product check · same deal, 3 products live
Conventional
25% down · 7.5% · 30yr
- Down + closing
- —
- Monthly P&I
- —
- Monthly cashflow
- —
- DSCR
- —
- Eligible?
- —
Personal DTI + credit; lowest rate.
DSCR
20% down · 8.5% · 30yr
- Down + closing
- —
- Monthly P&I
- —
- Monthly cashflow
- —
- DSCR
- —
- Eligible?
- —
No personal income docs; deal must DSCR.
Hard money
10% down · 12.0% · 12mo
- Down + closing
- —
- Monthly P&I
- —
- Monthly cashflow
- —
- DSCR
- —
- Eligible?
- —
Short-term bridge; refi at stabilization.
Rent comps 37 comps
| Address | Beds | Baths | Sqft | Rent | $/sqft | DOM | Units | Dist |
|---|---|---|---|---|---|---|---|---|
| 2777 N Treat Ave Tucson, AZ | 3.0 | 2.5 | 1618 | $1,595 | $0.99 | 23d | 1 | 0.08mi |
| 2827 E La Cienega Pl Tucson, AZ | 4.0 | 2.0 | 2200 | $2,660 | $1.21 | 3d | 1 | 0.38mi |
| 2545 E Spring St Unit 3 Tucson, AZ | 3.0 | 2.5 | 1300 | $1,700 | $1.31 | 43d | 1 | 0.45mi |
| 2545 E Spring St Tucson, AZ | 3.0 | 3.0 | 1300 | $1,700 | $1.31 | 43d | 1 | 0.45mi |
| 2618 N Sparkman Blvd Unit 2 Tucson, AZ | 3.0 | 2.0 | 1140 | $1,395 | $1.22 | 17d | 1 | 0.59mi |
| 3201 E Seneca St Tucson, AZ | 1.0–3.0 | 1.0–1.5 | 848 | $1,707 | $2.01 | 2d | 13 | 0.71mi |
| 2031 E Silver St Unit A Tucson, AZ | 4.0 | 2.0 | 1370 | $2,100 | $1.53 | 23d | 1 | 0.71mi |
| 2220 E Grant Rd Unit A Tucson, AZ | 3.0 | 2.0 | 1899 | $2,195 | $1.16 | 3d | 1 | 0.72mi |
| 2220 E Grant Rd Unit LO2220-A Tucson, AZ | 3.0 | 2.0 | 1899 | $2,195 | $1.16 | 10d | 1 | 0.72mi |
| 3002 N Palo Verde Ave Tucson, AZ | 4.0 | 2.0 | 1900 | $1,800 | $0.95 | 14d | 1 | 0.76mi |
| 3149 N Olsen Ave Unit 1 Tucson, AZ | 3.0 | 2.0 | 1627 | $2,000 | $1.23 | 17d | 1 | 0.84mi |
| 3149 N Olsen Ave Tucson, AZ | 3.0 | 2.0 | 1627 | $2,200 | $1.35 | 17d | 1 | 0.84mi |
| 3221 E Linden St Tucson, AZ | 3.0 | 2.0 | 1323 | $1,800 | $1.36 | 3d | 1 | 0.89mi |
| 1746 E Copper St Tucson, AZ | 3.0 | 2.0 | 1459 | $1,995 | $1.37 | 17d | 1 | 0.94mi |
| 1721 E Blacklidge Dr #2 Tucson, AZ | 3.0 | 1.0 | 1200 | $1,799 | $1.50 | 43d | 1 | 0.99mi |
| 3534 N Palmer Dr Tucson, AZ | 3.0 | 2.0 | 1705 | $1,850 | $1.09 | 16d | 1 | 1.00mi |
| 3726 E Mercedes Ct Tucson, AZ | 3.0 | 2.0 | 1419 | $1,750 | $1.23 | 17d | 1 | 1.02mi |
| 3052 N Cherry Ave Tucson, AZ | 3.0 | 2.0 | 1200 | $2,395 | $2.00 | 43d | 1 | 1.08mi |
| 2525 E Prince Rd #58 Tucson, AZ | 3.0 | 2.0 | 1571 | $1,625 | $1.03 | 43d | 1 | 1.13mi |
| 3004 E Adams St Tucson, AZ | 3.0 | 2.0 | 1552 | $1,995 | $1.29 | 43d | 1 | 1.16mi |
| 3478 N Richland Dr Tucson, AZ | 3.0 | 2.0 | 1398 | $1,800 | $1.29 | 43d | 1 | 1.18mi |
| 3243 E Camden St Unit 1 Tucson, AZ | 3.0 | 2.0 | 1066 | $1,800 | $1.69 | 3d | 1 | 1.18mi |
| 3921 E Alta Vista St Tucson, AZ | 3.0 | 2.0 | 1440 | $1,845 | $1.28 | 3d | 1 | 1.23mi |
| 1474 E Hedrick Dr Tucson, AZ | 3.0 | 2.0 | 1616 | $2,195 | $1.36 | 21d | 1 | 1.23mi |
| 2848 N Mountain Ave Tucson, AZ | 2.0–3.0 | 2.5–3.0 | 1025 | $1,914 | $1.87 | 2d | 15 | 1.24mi |
| 1941 E Lee St Tucson, AZ | 3.0 | 3.0 | 1620 | $3,300 | $2.04 | 43d | 1 | 1.28mi |
| 3139 E Bellevue St Tucson, AZ | 2.0–3.0 | 2.0 | 1158 | $1,950 | $1.68 | 21d | 1 | 1.31mi |
| 3838 E Seneca St Tucson, AZ | 3.0 | 3.0 | 1577 | $2,499 | $1.58 | 17d | 1 | 1.33mi |
| 1536 E Waverly St Tucson, AZ | 3.0 | 1.0 | 1152 | $1,650 | $1.43 | 23d | 1 | 1.35mi |
| 1228 N Norton Ave Tucson, AZ | 3.0 | 2.0 | 2100 | $4,500 | $2.14 | 43d | 1 | 1.35mi |
| 2242 E Mabel St Tucson, AZ | 3.0 | 1.0 | 1100 | $1,899 | $1.73 | 3d | 1 | 1.38mi |
| 1424 N Richey Blvd Unit 1 Tucson, AZ | 3.0 | 2.0 | 1079 | $1,800 | $1.67 | 43d | 1 | 1.41mi |
| 2808 N Silkie Pl Tucson, AZ | 3.0 | 2.5 | 1786 | $2,200 | $1.23 | 43d | 1 | 1.43mi |
| 3118 N Santa Rita Ave Tucson, AZ | 4.0 | 2.0 | 1573 | $1,700 | $1.08 | 17d | 1 | 1.45mi |
| 2974 N Cardell Cir Tucson, AZ | 3.0 | 3.0 | 1750 | $1,950 | $1.11 | 43d | 1 | 1.47mi |
| 1133 E Hedrick Dr Tucson, AZ | 3.0 | 2.0 | 1548 | $2,695 | $1.74 | 17d | 1 | 1.49mi |
| 1930 E Mabel St Tucson, AZ | 3.0 | 2.0 | 1614 | $1,975 | $1.22 | 3d | 1 | 1.49mi |
Listing history 18 events
-
2026-06-18days on market $224,900 Active 31 DOM
-
2026-06-17days on market $224,900 Active 30 DOM
-
2026-06-16pricedays on market $224,900 Active 29 DOM
-
2026-06-15days on market $229,900 Active 28 DOM
-
2026-06-13pricedays on market $229,900 Active 26 DOM
-
2026-06-10days on market $234,900 Active 23 DOM
-
2026-06-09days on market $234,900 Active 22 DOM
-
2026-06-08pricedays on market $234,900 Active 21 DOM
-
2026-06-07days on market $244,900 Active 20 DOM
-
2026-06-05days on market $244,900 Active 17 DOM
-
2026-06-03days on market $244,900 Active 16 DOM
-
2026-06-02days on market $244,900 Active 15 DOM
-
2026-06-01days on market $244,900 Active 14 DOM
-
2026-05-31days on market $244,900 Active 13 DOM
-
2026-05-18$244,900 Active
-
2004-03-08soldstatus $185,000
-
2004-03-05soldstatus $185,000 305-char remark
Show marketing remark (305 chars)
Beautiful brick home with privacy front court yard. Plantation Shutters. Cedar Closet. New Carpet,tile & skylights. Nutone food center,Floor safe,workshop & 2 hot water heaters. Expansive back yard full of color, patios, and charm. Lovingly cared for by family & ready for immediate occupancy.
-
2004-02-02$185,000 305-char remark
Show marketing remark (305 chars)
Beautiful brick home with privacy front court yard. Plantation Shutters. Cedar Closet. New Carpet,tile & skylights. Nutone food center,Floor safe,workshop & 2 hot water heaters. Expansive back yard full of color, patios, and charm. Lovingly cared for by family & ready for immediate occupancy.
ⓘ Source: listings_history table (triggers on properties + properties_extension) + one-shot
backfill from property_details.listing_events for pre-trigger history.
Tax reassessment forecast AZ · Resets to sale price
- Current annual tax
- $2,276 · $190/mo
- Projected year-2 tax
- $2,276 · $190/mo
- Expected delta
- $0/yr ($0/mo · 0.0%)
ⓘ Screening estimate from a state-policy table — verify with the county assessor before closing.
Climate risk First Street
- Flood 1/10 Low FEMA zone X (unshaded) · 0% chance over 30 yrs
- Wildfire 1/10 Low
- Heat 8/10 Severe 7 d/yr ≥106°F today · 17 d/yr by 30 yrs out
- Wind 1/10 Low
- Air quality 1/10 Low 0 unhealthy d/yr today · 0 by 30 yrs out
Nearby sold comps map
Loading sold comps map…
Walkable amenities ~0.75 mi
Loading nearby amenities…
Taxation est. · year 1
- Rental income
- $23,121
- − Mortgage interest
- −$12,598
- − Property taxes
- −$2,276
- − Insurance
- −$1,124
- − Repairs & maintenance
- −$1,850
- − Management
- −$1,850
- − Depreciation
- −$6,543
- Taxable loss
- −$3,119
- Est. tax savings @ 24.0%
- +$749
- After-tax cash flow
- $1,461/yr
For passive investors: Depreciation is non-cash, so a rental often shows a tax loss while cash-flowing — sheltering income. Rental losses are passive: they offset passive income freely, and up to $25,000/yr can offset ordinary (W-2) income if you actively participate and your MAGI is under $100k (phasing out to $0 by $150k); unused losses carry forward. On sale, claimed depreciation is recaptured at up to 25%, and gains may owe capital-gains tax (a 1031 exchange can defer both). Figures are a year-1 estimate at your 24.0% rate — not tax advice; consult a CPA.
Schools (NCES district)
- District
- Tucson Unified District (4403)
- NCES district ID
- 0408800
- Math proficiency
- 14% ▼ -17.00%
- Reading proficiency
- 23% ▼ -11.00%
- Median HH income
- $40,962
- Composite
- 15.78/100
- National rank
- #9270
- State rank
- #190 of 249 in AZ
Livability — Tucson
- Score
- 74/100
- State rank
- #17
- US rank
- #4502
Category grades
Schools grade is shown separately in the Schools card above.
Census & demographics
- Census place
- Tucson, AZ
- County
- Pima County · 1,012,107 people
- City population
- 839,336
- Metro
- Tucson, AZ
- Population (ZIP)
- 32,976
- Household income
- $49,061
- Rent vs Own
- Severe rent burden
- 2241.0
Population outlook (Pima County) Hauer SSP2
- Today (2025)
- 1,066,056 people
- By 2030
- 1,086,684 · +1.9%
- By 2040
- 1,117,160 · +4.8%
- By 2050
- 1,149,778 · +7.9%
- By 2075
- 1,271,480 · +19.3%
- By 2100
- 1,321,160 · +23.9%
Race, ethnicity, and origin ACS 2023
- Neighborhood character
- Diverse neighborhood (Simpson 0.57)
- Race & ethnicity
- White 60% Hispanic / Latino 25% Two or more races 16% Black 5% Pacific Islander 2% Asian 2%
- Hispanic origin (detail)
- Mexican 22%
- Common ancestry
- Lithuanian 3% Slovak 3% Portuguese 3%
- Foreign-born
- 11% · Canada, China
- Languages at home
- 80% English-only · Spanish 14% Other Asian/Pacific 1% Russian/Polish/Slavic 1%
Political lean MEDSL · Pima
- 2024 margin
- D (+15.2) · D 57.0% · R 41.8% · Other 1.2%
- 2008→2024 swing
- +9.1pp toward D · 2008: 6.1pp · 2024: 15.2pp
- All cycles
- 2024: D+15.2 2020: D+18.7 2016: D+13.5 2012: D+5.8 2008: D+6.1
Not yet ingested
- Civics
- —
Market trends
- HPI YoY
- ▼ -438.84%
- Current HPI
- 274.9061
- Rent YoY
- ▲ 1.39%
- Metro
- Tucson, AZ
- State GDP YoY
- ▲ 4.54%
- F500 in state
- 20
Industry mix (Fortune 500 HQ in AZ)
| Industry | F500 HQs | Revenue |
|---|---|---|
| Technology | 2 | $13B |
|
||
| Mining / Metals | 1 | $23B |
|
||
| Environmental Services | 1 | $16B |
|
||
| Metals / Steel | 1 | $14B |
|
||
| Technology Distribution | 1 | $9B |
|
||
| Homebuilding | 1 | $8B |
|
||
Price history
+32.4% since first listed4 events — show timeline
- 2026-05-18 Listed $244,900 MLSSAZ
- 2004-03-08 Sold (Public Records) $185,000 Public Records
- 2004-03-05 Sold (MLS) $185,000 MLSSAZ
- 2004-02-02 Listed $185,000 MLSSAZ
Property tax history
+2.3%/yrLatest (2025): $2,276 · +4.4% YoY. Source: county tax records.
Cash-flow waterfall
monthlySold comps — $/sqft
last 12 mo · ≤1 miLoading sold comps…