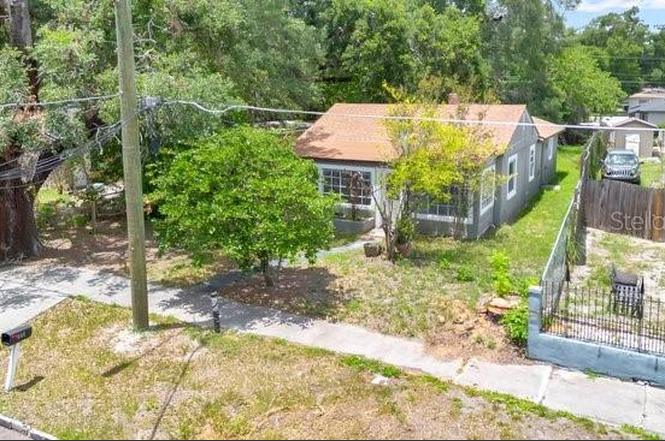
619 Grand St · Orlando, FL
Flood risk 1/10 · Minimal
- FEMA flood zone
- X (unshaded)
- Chance of flooding over 30 yrs
- 0.0%
- Est. flood insurance / yr
- $507 – $1,088
Fire risk 1/10 · Minimal
- Est. fire insurance / yr
- $947 – $1,759
Heat risk 8/10 · Major
- Hot days now (above 107°F)
- 7 days/yr
- Hot days in 30 yrs
- 21 days/yr
Wind risk 9/10 · Severe
- Chance of severe wind over 30 yrs
- 99.0%
Air-quality risk 1/10 · Minimal
- Unhealthy air days now
- 0 days/yr
- Unhealthy air days in 30 yrs
- 0 days/yr
Risk factors via First Street. Map © Google.
Why this score? — see what drove the D grade
The composite is a weighted blend of 9 inputs, each scored 0–100. Each bar is that input's sub-score; the figure is the points it added to the 100-point composite (weight × sub-score).
- Cash flow +13.0/30.0
- ARV discount +10.1/15.0
- Livability +4.3/5.0
- Schools +4.1/10.0
- DSCR +3.9/10.0
- 1% rule +3.2/10.0
- Rent growth +2.9/5.0
- Condition / age +2.5/5.0
- Appreciation +0.0/10.0
$235,000
🖨 Deal sheet (PDF) 📄 Offer letter ✓ Due diligence
Listing remarks
Nestled in a charming, historic neighborhood, this beautifully maintained home offers timeless character and lasting comfort. Featuring a brand-new roof and thoughtfully preserved details throughout, the property blends classic appeal with everyday functionality. The spacious living area creates a warm and welcoming ambiance, while the expansive lot invites endless opportunities for outdoor relaxation and recreation. Conveniently located near major roads, bus lines, shopping, dining, banks, and schools — all less than a mile away — this home delivers both charm and accessibility in a prime location. Whether you’re a first-time homebuyer searching for a place to call home,
Key facts
- Expansive lot
- Spacious living area
- Brand-new roof
Tags
Property features AI
Finance
- Other: Residential zoning R-2A/T/AN
- HOA & community: Senior community
Exterior
- Utilities: Public water; Public sewer; Cable connected; Electricity available
- Home design: Single-family residence; 1 story; Faces east
- Construction: Block construction; Shingle roof; Block and slab foundation; Built on one level
- Exterior features: Child safety fence around pool; Brick road surface
Interior
- Kitchen: Cooktop
- Bedrooms: 3 bedrooms
- Flooring: Ceramic tile
- Bathrooms: 2 full bathrooms
- Heating & cooling: Central heating; Central air conditioning
- Interior features: Open floorplan
- Laundry & utility: Electric dryer hookup
Neighborhood map
What this means for you Summary
Snapshot
- This is a 3-bed/2.0-bath single-family listed at $235k.
Deal economics
- At list price, monthly cash flow is $-11 ($-132/yr) — negative.
- To cash-flow at today's rent, offer at most $233k (0.8% below list).
- To meet the 1% rule (rent ≥ 1% of price), the offer needs to be $193k (18.0% below list).
- Recommended offer: $193k (18.0% below list) — sets the bar for 1% rule.
- Cap rate 6.2% vs local median 3.0% in Orlando — top-decile yield for the area; either an underpriced asset or a hidden risk that comps aren't pricing in. Stress-test before assuming the spread holds.
Location & tenants
- Location reads 86/100 on livability (#12 in FL, #360 nationally) — a professional / high-income tenant draw. Strengths: amenities A+, commute A+, housing A+.
- Orange (suburban): math 46% / reading 51% proficiency, ranked #43 of 73 in FL (top 59%) — families likely to look elsewhere, expect single-tenant / working-renter base with shorter leases.
- Zoned schools: Jones High (math 9% / reading 25%, grade F, #597 of 667 statewide, top 90%, 1,672 students, 75% FRL) — zoned schools average 75% FRL vs 56% district-wide (19 pts higher); higher-poverty schools than district average — tighter screening recommended.
- Zoned-school proficiency averages 17% at this address vs 48% district-wide (-32 pts) — the specific schools serving this property underperform the Orange average; the district grade overstates school quality for this exact location.
- Market conditions: Rents rising (+1.4%/yr); 142 active listings in the ZIP; 40 comparable units currently listed for rent nearby; rentals at typical pace (median 25d on market — plan ~3-4 weeks tenant-placement turnaround); lower-income renter base — watch delinquency; 8,053 units permitted in Orange County in 2024 (3,133 in 5+ unit buildings).
- At $1,927/mo this rent would consume 57% of the median local household income ($41k/yr) (locally 1597% of renters already pay >50% of income on rent) — very limited rent-growth headroom before tenants either downsize or default.
Forward outlook
- Local home prices are declining (-3.0%/yr); year-one equity from $2k of loan paydown is wiped out by about $7k of value loss. Plan a longer hold.
- Orange County population projected at +52% by 2050 — long-run rental-demand tailwind backs the buy-and-hold thesis.
Negotiation context
- Only 4 days on market — expect competitive offers; lowballing is unlikely to land.
- 2 sale attempts since 19y ago with the ask held roughly flat each time — persistent listings suggest the price (not the market) is what's stuck; bring a comps-based counter.
Risks & watch-outs
- Watch-outs: built in 1950 — expect roof / HVAC / electrical / plumbing capex.
- Climate carrying-cost: severe wind risk, 99% chance of damaging wind over 30y; extreme-heat days projected 7→21/yr by 2055 (HVAC capex compounding) — expect insurance premiums to compound above CPI over the hold.
Questions for the listing agent
- What do current leases actually rent for vs. the listed asking? Can we see a recent rent roll and the last 12 months of T-12 income?
- Built in 1950 — when were the roof, HVAC, electrical panel, plumbing, and water heater last replaced?
- Is there a deadline driving the sale (1031 exchange, divorce, estate, relocation)? That informs how much negotiation room exists.
- Schools are B-rated — typically a magnet for longer-tenancy family renters. What's the average tenant stay here, and is there a school-zone premium baked into asking?
- The area grade is low — what's the realistic commute time and amenity access for the typical tenant pool here? Any planned neighborhood developments (good or bad) we should know about?
- What's the average days-on-market for RENTAL listings here right now (not sales)? A rising rental-DOM trend means longer vacancies and softer asking-rent achievability than the comps imply.
- What's the recent tenant-quality profile in this submarket — average credit score on applications, eviction rate, late-payment / NSF rate, and stable-employment percentage? A property-management company in the area should have these aggregated.
- How much new for-sale + rental construction is in the pipeline within 1–3 miles? Heavy new supply typically softens prices + rents 12–24 months out; constrained supply supports both.
Investment metrics
- 1% rule
- 0.82% ✗
- Cap rate
- 6.24%
- Cash-on-cash
- -0.20%
- DSCR
- 0.99
- GRM
- 10.2
CMA / ARV
- ARV (on-the-fly)
- $249,516
- Comps found
- 2
Show comp detail 2 sales within ~0.75 mi
| Address | Dist | Beds/Ba | Sqft | Sold | Price | $/sf | Match |
|---|---|---|---|---|---|---|---|
| 939 W Kaley Ave | 0.53mi | 3/2.0 | 1,320 (-8%) | 8mo | $225,000 | $170 | 56 |
| 911 25th St | 0.74mi | 3/1.0 | 1,328 (-7%) | 22mo | $231,000 | $174 | 31 |
Match score weights: distance 35% · size 25% · config 20% · recency 20%. Top-matched comps best support the ARV.
Projected returns pro-forma
-3.0% appreciation · 1.42% rent growth · sell at horizon
- IRR
- -18.3%
- Equity multiple
- 0.36×
- Total profit
- $-41,823
- Equity at exit
- $35,039
- IRR
- -13.9%
- Equity multiple
- 0.25×
- Total profit
- $-49,417
- Equity at exit
- $20,319
Cash invested: $65,800 (down + closing). Projections, not guarantees.
Landlord ↔ Tenant lean methodology
- Overall (STATE)
- 87 Strongly Landlord-Friendly
- State Florida
- 87 Strongly Landlord-Friendly · R+3
- County
- — inherits STATE
- City
- — inherits STATE
ZIP-level market 32805
- Home prices YoY
- -7.6%
- Rents YoY
- 1.4%
- Active inventory
- 142
- Price-to-rent
- 10.2×
Monthly cashflow live
- Estimated rent
- $1,927 high interval (Pro) →
- Mortgage (P&I)
- −$1,232
- Tax from tax record
- −$203 /mo · $2,436/yr
- Insurance
- −$98
- HOA
- −$0
- Vacancy / Maint / Mgmt
- −$405
- Net cashflow
- $-11
Break-even live
Sensitivity live
| Price | -10% $122 | -5% $56 | +0% $-11 | +5% $-78 | +10% $-144 |
|---|---|---|---|---|---|
| Rent | -10% $-163 | -5% $-87 | +0% $-11 | +5% $65 | +10% $141 |
| Rate | -1.0pp $107 | -0.5pp $49 | base $-11 | +0.5pp $-72 | +1.0pp $-134 |
UW: 25.0% down · 7.5% · 30yr · 1.5% tax · 5.0% vac · 8.0% maint · 8.0% mgmt
Financing live
Cash to close
- Down payment
- $58,750
- Closing costs
- $7,050
- Reserves months
- —
- Total cash needed
- —
Loan-product check · same deal, 3 products live
Conventional
25% down · 7.5% · 30yr
- Down + closing
- —
- Monthly P&I
- —
- Monthly cashflow
- —
- DSCR
- —
- Eligible?
- —
Personal DTI + credit; lowest rate.
DSCR
20% down · 8.5% · 30yr
- Down + closing
- —
- Monthly P&I
- —
- Monthly cashflow
- —
- DSCR
- —
- Eligible?
- —
No personal income docs; deal must DSCR.
Hard money
10% down · 12.0% · 12mo
- Down + closing
- —
- Monthly P&I
- —
- Monthly cashflow
- —
- DSCR
- —
- Eligible?
- —
Short-term bridge; refi at stabilization.
Rent comps 40 comps
| Address | Beds | Baths | Sqft | Rent | $/sqft | DOM | Units | Dist |
|---|---|---|---|---|---|---|---|---|
| 638 Columbia St Orlando, FL | 4.0 | 1.0 | 1500 | $1,500 | $1.00 | 25d | 1 | 0.03mi |
| 644 Indiana St Orlando, FL | 3.0 | 2.0 | 1308 | $2,200 | $1.68 | 25d | 1 | 0.12mi |
| 728 Columbia St Unit A Orlando, FL | 3.0 | 1.0 | 1500 | $1,500 | $1.00 | 25d | 1 | 0.13mi |
| 728 Columbia St Orlando, FL | 3.0 | 1.0 | 1500 | $1,500 | $1.00 | 16d | 1 | 0.13mi |
| 613 Citrus St Unit A Orlando, FL | 3.0 | 1.0 | 926 | $1,800 | $1.94 | 25d | 1 | 0.19mi |
| 930 18th St Unit A Orlando, FL | 4.0 | 1.0 | 1500 | $1,500 | $1.00 | 25d | 1 | 0.42mi |
| 96 Columbia St Unit 5 Orlando, FL | 2.0 | 1.0 | 1000 | $1,475 | $1.48 | 25d | 1 | 0.46mi |
| 94 Columbia St Unit 4 Orlando, FL | 2.0 | 1.0 | 1000 | $1,510 | $1.51 | 16d | 1 | 0.47mi |
| 904 24th St Orlando, FL | 3.0 | 2.0 | 1088 | $1,800 | $1.65 | 21d | 1 | 0.71mi |
| 904 Randall St Orlando, FL | 2.0 | 1.0 | 960 | $1,300 | $1.35 | 25d | 1 | 0.73mi |
| 20 W Lucerne Cir Orlando, FL | 1.0–2.0 | 1.0–2.0 | 901 | $1,650 | $1.83 | 4d | 6 | 0.75mi |
| 733 Main Ln Orlando, FL | 3.0 | 1.0–2.0 | 1044 | $3,014 | $2.89 | 3d | 25 | 0.75mi |
| 1401 19th St Orlando, FL | 3.0 | 1.0 | 1100 | $1,800 | $1.64 | 25d | 1 | 0.78mi |
| 1040 Randall St Orlando, FL | 3.0 | 1.0 | 958 | $1,850 | $1.93 | 25d | 1 | 0.80mi |
| 200 Agnes Ct Unit 10 Orlando, FL | 2.0 | 1.0 | 900 | $1,375 | $1.53 | 23d | 1 | 0.86mi |
| 1907 S Rio Grande Ave Orlando, FL | 3.0 | 2.0 | 1130 | $1,600 | $1.42 | 25d | 1 | 0.87mi |
| 1829 Hollenbeck Dr #1 Orlando, FL | 3.0 | 1.0 | 1136 | $3,300 | $2.90 | 21d | 1 | 0.88mi |
| 1100 Delaney Ave Unit F201 Orlando, FL | 2.0 | 2.0 | 1000 | $2,050 | $2.05 | 9d | 1 | 0.90mi |
| 100 W Grant St Orlando, FL | 3.0 | 1.0–2.0 | 1088 | $2,530 | $2.32 | 4d | 17 | 0.96mi |
| 124 E Harding St Orlando, FL | 2.0 | 1.0 | 1020 | $1,900 | $1.86 | 15d | 1 | 0.98mi |
| 332 E Kaley St Orlando, FL | 3.0 | 2.5 | 1671 | $2,500 | $1.50 | 25d | 1 | 1.03mi |
| 332 E Kaley St Orlando, FL | 3.0 | 2.5 | 1750 | $2,695 | $1.54 | 9d | 1 | 1.03mi |
| 204 E South St Orlando, FL | 2.0 | 2.0 | 1169 | $2,200 | $1.88 | 25d | 2 | 1.04mi |
| 2720 Sunrise Ct Apt 2 Orlando, FL | 3.0 | 1.0 | 910 | $1,950 | $2.14 | 5d | 1 | 1.10mi |
| 126 Page St Unit A Orlando, FL | 2.0 | 2.0 | 890 | $1,750 | $1.97 | 25d | 1 | 1.11mi |
| 119 E Pine St Orlando, FL | 2.0 | 2.0 | 960 | $2,950 | $3.07 | 25d | 1 | 1.20mi |
| 400 E Grant St Unit NA Orlando, FL | 3.0 | 2.0 | 1548 | $3,499 | $2.26 | 25d | 1 | 1.21mi |
| 125 E Pine St Orlando, FL | 2.0 | 2.0 | 1237 | $3,150 | $2.55 | 25d | 1 | 1.24mi |
| 1045 Polk St Unit 1049B Orlando, FL | 3.0 | 1.0 | 1062 | $1,650 | $1.55 | 25d | 1 | 1.27mi |
| 666 W Robinson St Orlando, FL | 3.0 | 1.0 | 1008 | $1,190 | $1.18 | 25d | 1 | 1.28mi |
| 407 E Crystal Lake St Orlando, FL | 3.0 | 2.0 | 1370 | $3,200 | $2.34 | 25d | 1 | 1.28mi |
| 270 W Pineloch Ave Unit a Orlando, FL | 2.0 | 1.0 | 940 | $2,199 | $2.34 | 19d | 1 | 1.30mi |
| 260 S Osceola Ave Orlando, FL | 2.0 | 2.0–2.5 | 1882 | $4,350 | $2.31 | 17d | 2 | 1.31mi |
| 100 Lake Ave Orlando, FL | 2.0 | 2.0 | 1075 | $2,800 | $2.60 | 25d | 1 | 1.33mi |
| 420 E Church St Orlando, FL | 1.0–3.0 | 1.0–2.0 | 1086 | $3,289 | $3.03 | 4d | 12 | 1.33mi |
| 101 Lake Ave Orlando, FL | 3.0 | 2.0 | 1706 | $4,000 | $2.34 | 25d | 1 | 1.34mi |
| 322 E Central Blvd Orlando, FL | 2.0 | 2.0 | 1152 | $2,398 | $2.08 | 15d | 2 | 1.35mi |
| 322 E Central Blvd #1413 Orlando, FL | 2.0 | 2.0 | 1157 | $2,800 | $2.42 | 25d | 1 | 1.36mi |
| 151 E Washington St Orlando, FL | 2.0 | 2.0 | 1507 | $3,250 | $2.16 | 25d | 2 | 1.36mi |
| 413 E Pine St Orlando, FL | 3.0 | 2.0 | 1743 | $3,485 | $2.00 | 25d | 1 | 1.37mi |
Listing history 3 events
-
2026-06-21days on market $235,000 Active 4 DOM
-
2026-06-17remarks 681-char remark
-
2026-06-17$235,000 Active 1 DOM
ⓘ Source: listings_history table (triggers on properties + properties_extension) + one-shot
backfill from property_details.listing_events for pre-trigger history.
Tax reassessment forecast FL · Resets to sale price
- Current annual tax
- $2,436 · $203/mo
- Projected year-2 tax
- $2,436 · $203/mo
- Expected delta
- $0/yr ($0/mo · 0.0%)
ⓘ Screening estimate from a state-policy table — verify with the county assessor before closing.
Climate risk First Street
- Flood 1/10 Low FEMA zone X (unshaded) · 0% chance over 30 yrs
- Wildfire 1/10 Low
- Heat 8/10 Severe 7 d/yr ≥107°F today · 21 d/yr by 30 yrs out
- Wind 9/10 Extreme 99% chance of damaging wind over 30 yrs
- Air quality 1/10 Low 0 unhealthy d/yr today · 0 by 30 yrs out
Nearby sold comps map
Loading sold comps map…
Walkable amenities ~0.75 mi
Loading nearby amenities…
Taxation est. · year 1
- Rental income
- $23,123
- − Mortgage interest
- −$13,164
- − Property taxes
- −$2,436
- − Insurance
- −$1,175
- − Repairs & maintenance
- −$1,850
- − Management
- −$1,850
- − Depreciation
- −$6,836
- Taxable loss
- −$4,187
- Est. tax savings @ 24.0%
- +$1,005
- After-tax cash flow
- $873/yr
For passive investors: Depreciation is non-cash, so a rental often shows a tax loss while cash-flowing — sheltering income. Rental losses are passive: they offset passive income freely, and up to $25,000/yr can offset ordinary (W-2) income if you actively participate and your MAGI is under $100k (phasing out to $0 by $150k); unused losses carry forward. On sale, claimed depreciation is recaptured at up to 25%, and gains may owe capital-gains tax (a 1031 exchange can defer both). Figures are a year-1 estimate at your 24.0% rate — not tax advice; consult a CPA.
Schools (NCES district)
- District
- Orange
- NCES district ID
- 1201440
- Math proficiency
- 46% ▼ -9.00%
- Reading proficiency
- 51% ▼ -2.00%
- Median HH income
- $49,350
- Composite
- 41.47/100
- National rank
- #3461
- State rank
- #43 of 73 in FL
Livability — Orlando
- Score
- 86/100
- State rank
- #12
- US rank
- #360
Category grades
Schools grade is shown separately in the Schools card above.
Census & demographics
- Census place
- Orlando, FL
- County
- Orange County · 1,471,359 people
- City population
- 964,969
- Metro
- Orlando-Kissimmee-Sanford, FL
- Population (ZIP)
- 19,294
- Household income
- $40,515
- Rent vs Own
- Severe rent burden
- 1597.0
Population outlook (Orange County) Hauer SSP2
- Today (2025)
- 1,618,226 people
- By 2030
- 1,787,404 · +10.5%
- By 2040
- 2,125,621 · +31.4%
- By 2050
- 2,454,016 · +51.6%
- By 2075
- 3,173,711 · +96.1%
- By 2100
- 3,607,781 · +122.9%
Race, ethnicity, and origin ACS 2023
- Neighborhood character
- Predominantly Black (70%)
- Race & ethnicity
- Black 70% Hispanic / Latino 15% White 13% Two or more races 8%
- Hispanic origin (detail)
- Mexican 3% Puerto Rican 4% Cuban 1% Dominican 3%
- Common ancestry
- Hispanic 9% Russian 1%
- Foreign-born
- 16% · Canada, Jamaica
- Languages at home
- 80% English-only · Spanish 11% French/Haitian/Cajun 8%
Political lean MEDSL · Orange
- 2024 margin
- D (+13.6) · D 56.1% · R 42.5% · Other 1.3%
- 2008→2024 swing
- -5.0pp toward R · 2008: 18.6pp · 2024: 13.6pp
- All cycles
- 2024: D+13.6 2020: D+23.1 2016: D+24.6 2012: D+18.2 2008: D+18.6
Not yet ingested
- Civics
- —
Market trends
- HPI YoY
- ▼ -35.19%
- Current HPI
- 429.3242
- Rent YoY
- ▲ 1.42%
- Metro
- Orlando-Kissimmee-Sanford, FL
- State GDP YoY
- ▲ 3.28%
- F500 in state
- 36
Industry mix (Fortune 500 HQ in FL)
| Industry | F500 HQs | Revenue |
|---|---|---|
| Industrial Technology | 2 | $29B |
|
||
| Insurance | 2 | $17B |
|
||
| Retail | 1 | $60B |
|
||
| Technology Distribution | 1 | $58B |
|
||
| Homebuilding | 1 | $35B |
|
||
| Technology Manufacturing | 1 | $35B |
|
||
Price history
+82.2% since first listed2 events — show timeline
- 2026-06-17 Listed $235,000 Stellar MLS as Distributed by MLS Grid
- 2007-01-22 Listed $129,000 Stellar MLS as Distributed by MLS Grid
Property tax history
+14.0%/yrLatest (2025): $2,436 · +4.5% YoY. Source: county tax records.
Cash-flow waterfall
monthlySold comps — $/sqft
last 12 mo · ≤1 miLoading sold comps…