 5-Plex
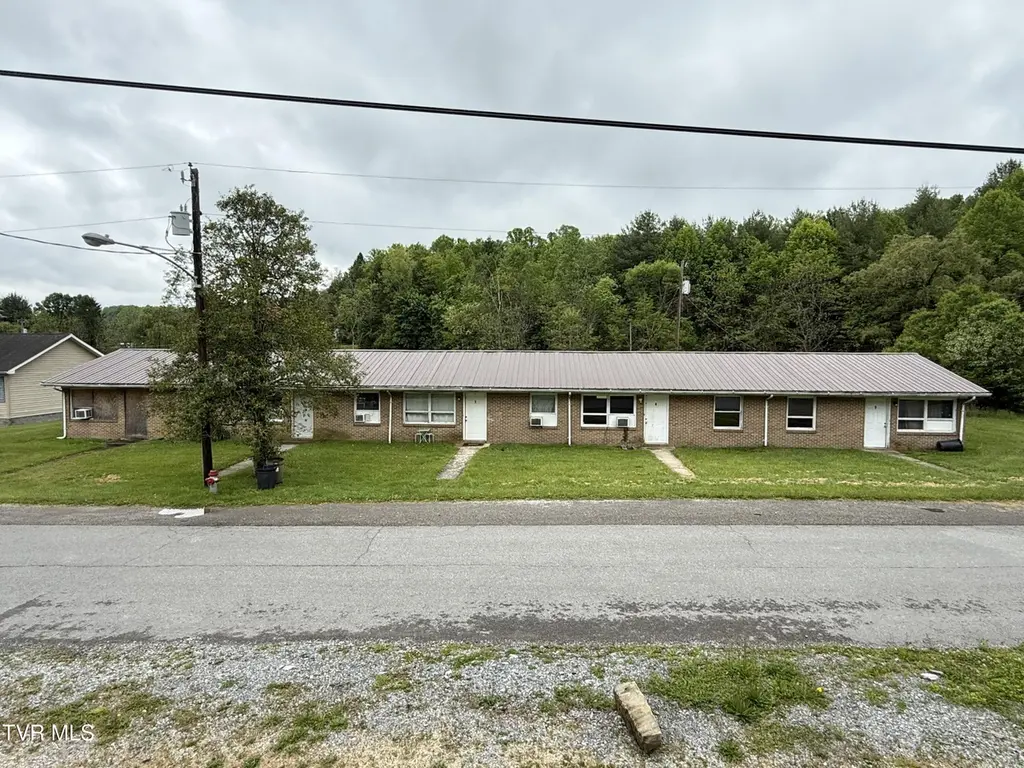
112 Dale St · Wise, VA
Flood risk 9/10 · Severe
- FEMA flood zone
- X (unshaded)
- Chance of flooding over 30 yrs
- 0.99%
- Est. flood insurance / yr
- $507 – $1,088
Fire risk 5/10 · Moderate
- Est. fire insurance / yr
- $666 – $1,236
Heat risk 2/10 · Minimal
- Hot days now (above 92°F)
- 7 days/yr
- Hot days in 30 yrs
- 21 days/yr
Wind risk 2/10 · Minimal
- Chance of severe wind over 30 yrs
- 1.0%
Air-quality risk 1/10 · Minimal
- Unhealthy air days now
- 0 days/yr
- Unhealthy air days in 30 yrs
- 0 days/yr
Risk factors via First Street. Map © Google.
Why this score? — see what drove the B grade
The composite is a weighted blend of 9 inputs, each scored 0–100. Each bar is that input's sub-score; the figure is the points it added to the 100-point composite (weight × sub-score).
- Cash flow +30.0/30.0
- 1% rule +10.0/10.0
- DSCR +10.0/10.0
- ARV discount +7.5/15.0
- Schools +6.3/10.0
- Livability +3.9/5.0
- Rent growth +2.5/5.0
- Condition / age +2.5/5.0
- Appreciation +0.3/10.0
$199,900
🖨 Deal sheet 📄 Offer letter ✓ Due diligence
Multi-family units
County records classify this as Multi-Family (5+ Unit). Listing-text estimate: 5 units. confirmed
5+ unit building — per-unit beds/baths from public records are typically unavailable; the breakdown below (if shown) is an estimate from the listing text.
Listing remarks
Investment opportunity in the heart of Wise! This 5-unit apartment complex sits on over an acre of land and offers incredible potential for investors looking to expand their portfolio or create long-term passive income. Conveniently located near UVA Wise, local schools, shopping, dining, and other amenities, this property is perfectly positioned to attract steady rental demand. The property does need some TLC, making it an excellent value-add opportunity for the right buyer. One unit previously experienced a fire and will require rehabilitation, while one unit is currently occupied and producing income. With the remaining units ready for updates and improvements, the possibilities are endle
Key facts
- Income potential
- Acre of land
- Producing income
Tags
Property features AI
Finance
- Other: Approximately 1.2-acre lot; Total building area listed as 3429
Exterior
- Parking: Driveway
- Utilities: Public water; Public sewer
- Home design: Multi-family residential income property; Zoning: RB
- Construction: Brick construction
- Exterior features: Metal roof; Level topography
Interior
- Flooring: Laminate
- Heating & cooling: Electric heating; Window unit cooling
- Interior features: Laminate flooring; Window cooling units
Neighborhood map
What this means for you Summary
Snapshot
- This is a 5 × 2-bed/1-bath units multifamily listed at $200k.
Deal economics
- At list price, monthly cash flow is $2k ($23k/yr) — positive. Per door: $378/mo.
- The deal already cash-flows at list — no discount required.
- Meets the 1% rule at list price ($4k rent vs $200k).
- Recommended offer: $197k (1.5% below list) — sets the bar for market timing.
- Cap rate 18.0% vs local median 5.1% in Wise — top-decile yield for the area; either an underpriced asset or a hidden risk that comps aren't pricing in. Stress-test before assuming the spread holds.
Location & tenants
- Location reads 77/100 on livability (#99 in VA, #3,153 nationally) — a middle-class / working-renter tenant base. Strengths: cost of living A+, health & safety A, crime A-; Watch: employment D+, amenities F, commute F.
- Wise County Public School District (town): math 74% / reading 79% proficiency, ranked #11 of 131 in VA (top 8%) — strong family-tenant draw, lease renewals of 3-5y typical.
- Zoned schools: St. Paul Elementary (math 92% / reading 92%, grade A+, #9 of 1,108 statewide, top 1%, 469 students, 81% FRL); L.F. Addington Middle (math 80% / reading 83%, grade A+, #21 of 342 statewide, top 6%, 451 students, 101% FRL); Central High (math 87% / reading 87%, grade A, #16 of 319 statewide, top 5%, 674 students, 81% FRL) — zoned schools average 87% FRL vs 55% district-wide (33 pts higher); higher-poverty schools than district average — tighter screening recommended.
- Market conditions: 42 active listings in the ZIP; 17 units permitted in Wise County in 2024 (0 in 5+ unit buildings).
Forward outlook
- Local home prices are declining (-3.0%/yr); year-one equity from $1k of loan paydown is wiped out by about $6k of value loss. Plan a longer hold.
- Wise County population projected at -26% by 2050 — secular population decline; favor cash flow + early exit over multi-decade hold.
- At projected returns (-3.0% appreciation + 3.0% rent growth), your $56k cash investment doubles in ~3 years — after that, you're playing with house money.
Negotiation context
- It's been on market 19 days — a 2% lower offer ($197k) is reasonable based on typical stale-listing flexibility.
- 2 sale attempts with the ask held roughly flat each time — persistent listings suggest the price (not the market) is what's stuck; bring a comps-based counter.
Risks & watch-outs
- Watch-outs: flood insurance adds $66/mo.
- Climate carrying-cost: severe flood risk; moderate wildfire risk — expect insurance premiums to compound above CPI over the hold.
Questions for the listing agent
- Can we see the unit-by-unit rent roll, current vacancy, and any below-market leases? What's the average tenancy length?
- What capital expenditures (roof, boiler, parking lot, exteriors) have been made in the last 5 years, and what's planned in the next 2?
- Built in 1962 — when were the roof, HVAC, electrical panel, plumbing, and water heater last replaced?
- What's the actual annual flood-insurance premium (NFIP or private), and is the property in a SFHA with mandatory coverage?
- Is there a deadline driving the sale (1031 exchange, divorce, estate, relocation)? That informs how much negotiation room exists.
- Schools are A-rated — typically a magnet for longer-tenancy family renters. What's the average tenant stay here, and is there a school-zone premium baked into asking?
- What's the average days-on-market for RENTAL listings here right now (not sales)? A rising rental-DOM trend means longer vacancies and softer asking-rent achievability than the comps imply.
- What's the recent tenant-quality profile in this submarket — average credit score on applications, eviction rate, late-payment / NSF rate, and stable-employment percentage? A property-management company in the area should have these aggregated.
- How much new apartment / multifamily construction is in the pipeline within 1–3 miles? Heavy new supply (>2% of stock underway) typically softens rents 12–24 months out; light construction supports rent growth.
Investment metrics
- 1% rule
- 2.03% ✓
- Cap rate
- 18.03%
- Cash-on-cash
- 41.92%
- DSCR
- 2.87
- GRM
- 4.1
CMA / ARV
No comps found within radius.
Projected returns pro-forma
-3.0% appreciation · 3.0% rent growth · sell at horizon
- IRR
- 36.9%
- Equity multiple
- 2.57×
- Total profit
- $87,930
- Equity at exit
- $29,806
- IRR
- 43.6%
- Equity multiple
- 5.14×
- Total profit
- $231,556
- Equity at exit
- $17,284
Cash invested: $55,972 (down + closing). Projections, not guarantees.
Landlord ↔ Tenant lean methodology
- Overall (STATE)
- 55 Moderately Landlord-Leaning
- State Virginia
- 55 Moderately Landlord-Leaning · D+2
- County
- — inherits STATE
- City
- — inherits STATE
ZIP-level market 24293
- Home prices YoY
- -5.8%
- Active inventory
- 42
- Price-to-rent
- 20.6×
Monthly cashflow live
- Estimated rent
- $4,053 medium interval (Pro) →
- Mortgage (P&I)
- −$1,048
- Tax from tax record
- −$115 /mo · $1,379/yr
- Insurance
- −$83
- Flood insurance flood zone
- −$66 /mo · $798/yr
- HOA
- −$0
- Vacancy / Maint / Mgmt
- −$851
- Net cashflow
- $1,889
Break-even live
5-unit breakdown (identical units grouped — click to expand)
| Units | Beds | Baths | Est. rent |
|---|---|---|---|
| 5× units | 2 | 1 | $4,055 |
| #1 | 2 | 1 | $811 |
| #2 | 2 | 1 | $811 |
| #3 | 2 | 1 | $811 |
| #4 | 2 | 1 | $811 |
| #5 | 2 | 1 | $811 |
| Total (5 units) | $4,053 | ||
UW: 25.0% down · 7.5% · 30yr · 1.5% tax · 5.0% vac · 8.0% maint · 8.0% mgmt
Financing live
Cash to close
- Down payment
- $49,975
- Closing costs
- $5,997
- Reserves months
- —
- Total cash needed
- —
Loan-product check · same deal, 3 products live
Conventional
25% down · 7.5% · 30yr
- Down + closing
- —
- Monthly P&I
- —
- Monthly cashflow
- —
- DSCR
- —
- Eligible?
- —
Personal DTI + credit; lowest rate.
DSCR
20% down · 8.5% · 30yr
- Down + closing
- —
- Monthly P&I
- —
- Monthly cashflow
- —
- DSCR
- —
- Eligible?
- —
No personal income docs; deal must DSCR.
Hard money
10% down · 12.0% · 12mo
- Down + closing
- —
- Monthly P&I
- —
- Monthly cashflow
- —
- DSCR
- —
- Eligible?
- —
Short-term bridge; refi at stabilization.
Listing history 13 events
-
2026-06-17status $199,900 Pending 19 DOM
-
2026-06-16days on market $199,900 Active 19 DOM
-
2026-06-15days on market $199,900 Active 18 DOM
-
2026-06-15days on market $199,900 Active 17 DOM
-
2026-06-13days on market $199,900 Active 16 DOM
-
2026-06-12days on market $199,900 Active 15 DOM
-
2026-06-09days on market $199,900 Active 12 DOM
-
2026-06-08days on market $199,900 Active 11 DOM
-
2026-06-08days on market $199,900 Active 10 DOM
-
2026-06-07days on market $199,900 Active 9 DOM
-
2026-06-04status $199,900 Active 6 DOM
-
2026-05-12status Pending 1073-char remark
-
2026-05-06$199,900 Active 1073-char remark
ⓘ Source: listings_history table (triggers on properties + properties_extension) + one-shot
backfill from property_details.listing_events for pre-trigger history.
Tax reassessment forecast VA · Resets to sale price
- Current annual tax
- $1,379 · $115/mo
- Projected year-2 tax
- $1,639 · $137/mo
- Expected delta
- +$260/yr (+$22/mo · 18.8%)
ⓘ Screening estimate from a state-policy table — verify with the county assessor before closing.
Climate risk First Street
- Flood 9/10 Extreme FEMA zone X (unshaded) · 99% chance over 30 yrs
- Wildfire 5/10 Major
- Heat 2/10 Low 7 d/yr ≥92°F today · 21 d/yr by 30 yrs out
- Wind 2/10 Low 100% chance of damaging wind over 30 yrs
- Air quality 1/10 Low 0 unhealthy d/yr today · 0 by 30 yrs out
Nearby sold comps map
Loading sold comps map…
Walkable amenities ~0.75 mi
Loading nearby amenities…
Taxation est. · year 1
- Rental income
- $48,636
- − Mortgage interest
- −$11,198
- − Property taxes
- −$1,379
- − Insurance
- −$1,797
- − Repairs & maintenance
- −$3,891
- − Management
- −$3,891
- − Depreciation
- −$5,815
- Taxable income
- $20,665
- Est. tax owed @ 24.0%
- −$4,960
- After-tax cash flow
- $17,707/yr
For passive investors: Depreciation is non-cash, so a rental often shows a tax loss while cash-flowing — sheltering income. Rental losses are passive: they offset passive income freely, and up to $25,000/yr can offset ordinary (W-2) income if you actively participate and your MAGI is under $100k (phasing out to $0 by $150k); unused losses carry forward. On sale, claimed depreciation is recaptured at up to 25%, and gains may owe capital-gains tax (a 1031 exchange can defer both). Figures are a year-1 estimate at your 24.0% rate — not tax advice; consult a CPA.
Schools (NCES district)
- District
- Wise County Public School District
- NCES district ID
- 5104080
- Math proficiency
- 74% ▼ -20.00%
- Reading proficiency
- 79% ▼ -7.00%
- Median HH income
- $35,624
- Composite
- 63.37/100
- National rank
- #625
- State rank
- #11 of 131 in VA
Livability — Wise
- Score
- 77/100
- State rank
- #99
- US rank
- #3153
Category grades
Schools grade is shown separately in the Schools card above.
Census & demographics
- Census place
- Wise, VA
- Population (ZIP)
- 9,622
Population outlook (Wise County) Hauer SSP2
- Today (2025)
- 35,714 people
- By 2030
- 33,742 · -5.5%
- By 2040
- 29,870 · -16.4%
- By 2050
- 26,233 · -26.5%
- By 2075
- 18,296 · -48.8%
- By 2100
- 12,147 · -66.0%
Race, ethnicity, and origin ACS 2023
- Neighborhood character
- Predominantly White (96%)
- Race & ethnicity
- White 96% Two or more races 3% Hispanic / Latino 1%
- Common ancestry
- Serbian 4% Slovak 4% Lithuanian 2%
- Foreign-born
- 1% · Canada, South Korea
Political lean MEDSL · Wise
- 2024 margin
- Solid R (+63.3) · D 18.1% · R 81.4%
- 2008→2024 swing
- -35.6pp toward R · 2008: -27.7pp · 2024: -63.3pp
- All cycles
- 2024: R+63.3 2020: R+61.7 2016: R+62.0 2012: R+48.8 2008: R+27.7
Not yet ingested
- Civics
- —
Market trends
- HPI YoY
- ▼ -9.49%
- Current HPI
- 153.7377
- Rent YoY
- —
- Metro
- —
- State GDP YoY
- ▲ 2.40%
- F500 in state
- 50
Industry mix (Fortune 500 HQ in VA)
| Industry | F500 HQs | Revenue |
|---|---|---|
| Aerospace / Defense | 4 | $236B |
|
||
| Technology / Defense | 3 | $32B |
|
||
| Financial Services | 2 | $176B |
|
||
| Utilities | 2 | $27B |
|
||
| Insurance | 2 | $25B |
|
||
| Technology | 2 | $15B |
|
||
Price history
4 events — show timeline
- 2026-06-16 Pending — TVRMLS
- 2026-06-03 Relisted — TVRMLS
- 2026-05-12 Pending — TVRMLS
- 2026-05-06 Listed $199,900 TVRMLS
Property tax history
+4.3%/yrLatest (2025): $1,379 · +0.0% YoY. Source: county tax records.
Cash-flow waterfall
monthlySold comps — $/sqft
last 12 mo · ≤1 miLoading sold comps…