None · Lewes, DE
Flood risk 1/10 · Minimal
- FEMA flood zone
- X (unshaded)
- Chance of flooding over 30 yrs
- 0.0%
- Est. flood insurance / yr
- $473 – $860
Fire risk 3/10 · Minor
- Est. fire insurance / yr
- $476 – $884
Heat risk 8/10 · Major
- Hot days now (above 101°F)
- 7 days/yr
- Hot days in 30 yrs
- 18 days/yr
Wind risk 8/10 · Major
- Chance of severe wind over 30 yrs
- 80.0%
Air-quality risk 2/10 · Minimal
- Unhealthy air days now
- 1 days/yr
- Unhealthy air days in 30 yrs
- 1 days/yr
Risk factors via First Street. Map © Google.
Why this score? — see what drove the C+ grade
The composite is a weighted blend of 9 inputs, each scored 0–100. Each bar is that input's sub-score; the figure is the points it added to the 100-point composite (weight × sub-score).
- Cash flow +28.0/30.0
- DSCR +9.9/10.0
- ARV discount +7.5/15.0
- 1% rule +6.4/10.0
- Schools +4.2/10.0
- Livability +3.4/5.0
- Rent growth +2.7/5.0
- Condition / age +2.5/5.0
- Appreciation +0.0/10.0
$219,900
🖨 Deal sheet (PDF) 📄 Offer letter ✓ Due diligence
Listing remarks
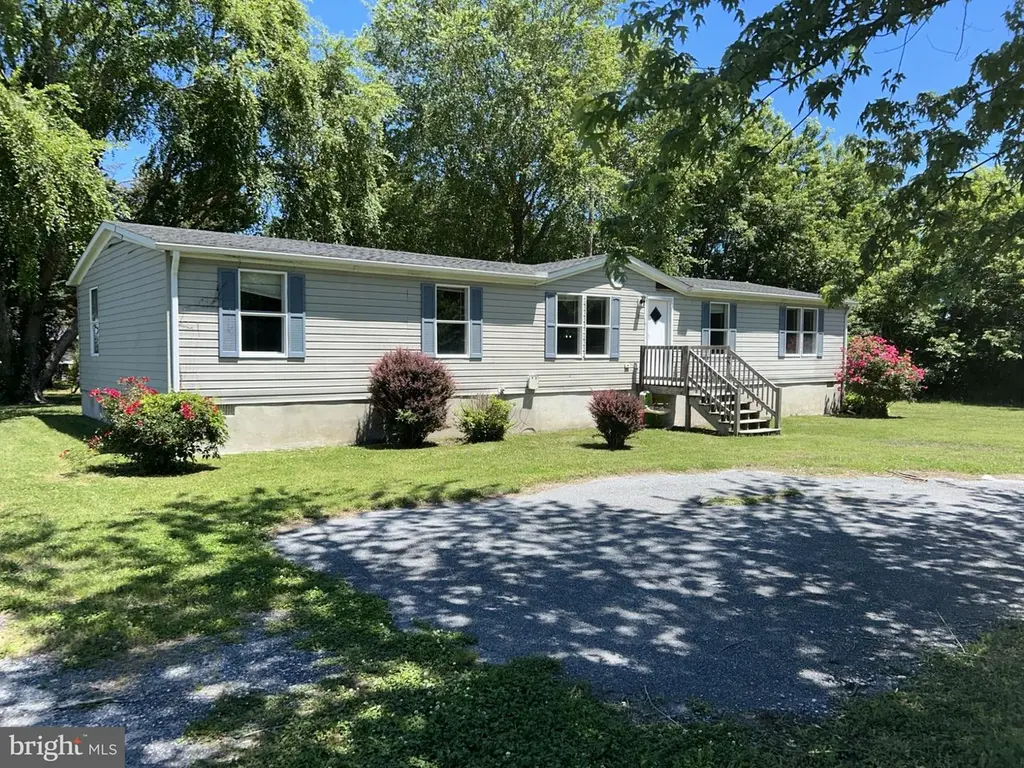
This 1997 Class C manufactured home presents a compelling investment opportunity, featuring a spacious double-wide design with three bedrooms and two full bathrooms. The interior boasts practical features such as ceiling fans, an entry-level bedroom, and a dedicated dining area, enhancing livability and tenant appeal. The kitchen is equipped with essential appliances, while washer/dryer hookups offer convenience for future occupants. Set on a generous 1.41-acre lot, the property is cleared and located in a cul-de-sac type location, providing a tranquil environment with potential for outdoor enhancements. The dirt driveway accommodates ample parking for multiple vehicles, making it attractiv
Key facts
- 1.41 acre lot
- 6 parking spots
- Built 1997
Property features AI
Finance
- Other: Fee simple ownership; Not located in a federal flood zone; Year built reported as estimated
Exterior
- Parking: Dirt driveway; Driveway and off-street parking for 6 vehicles (6 driveway spaces, total 6 spaces)
- Utilities: Well water; Septic system; 150 amp electric service
- Home design: Manufactured (double wide); Above-grade living area reported
- Construction: Vinyl siding; Block foundation with crawl space; Asphalt shingle roof; Manufactured structure
- Exterior features: Cleared lot; Cul-de-sac setting; Trees/wooded area
Interior
- Kitchen: Dishwasher; Gas oven/range; Water heater
- Bedrooms: 3 bedrooms on the main level
- Flooring: Carpet; Vinyl
- Bathrooms: 2 full bathrooms (both on the main level)
- Heating & cooling: Forced air heating; Heat pump(s); Oil heating fuel; Central air conditioning (electric)
- Interior features: Ceiling fans; Dining area; Entry-level bedroom; Not furnished
- Laundry & utility: Washer/dryer hookups
Neighborhood map
What this means for you Summary
Snapshot
- This is a 3-bed/2.0-bath manufactured listed at $220k.
Deal economics
- At list price, monthly cash flow is $684 ($8k/yr) — positive.
- The deal already cash-flows at list — no discount required.
- Meets the 1% rule at list price ($2k rent vs $220k).
- Recommended offer: $217k (1.5% below list) — sets the bar for market timing.
- Cap rate 10.0% vs local median 1.8% in Lewes — top-decile yield for the area; either an underpriced asset or a hidden risk that comps aren't pricing in. Stress-test before assuming the spread holds.
Location & tenants
- Location reads 67/100 on livability (#40 in DE) — a middle-class / working-renter tenant base. Strengths: crime A+, employment A+, health & safety A+; Watch: commute F, cost of living F.
- Cape Henlopen School District (town): math 42% / reading 55% proficiency, ranked #5 of 26 in DE (top 19%) — families likely to look elsewhere, expect single-tenant / working-renter base with shorter leases.
- Zoned schools: Lewes Elementary School (math 58% / reading 60%, grade B-, #4 of 105 statewide, top 4%, 582 students, 0% FRL); Beacon Middle School (math 49% / reading 62%, grade B-, #1 of 36 statewide, top 0%, 648 students, 0% FRL); Cape Henlopen High School (math 26% / reading 51%, grade F, #14 of 40 statewide, top 33%, 1,813 students, 0% FRL) — zoned schools average 0% FRL vs 41% district-wide (41 pts lower); this property's tenant base skews higher-income than the district average.
- Market conditions: Rents flat; 822 active listings in the ZIP; 1 comparable units currently listed for rent nearby; solid renter incomes; 4,354 units permitted in Sussex County in 2024 (344 in 5+ unit buildings).
- This rent runs 31% of the median local income ($97k/yr) — at the standard rent-burdened threshold; future hikes will face affordability resistance.
Forward outlook
- Local home prices are declining (-3.0%/yr); year-one equity from $2k of loan paydown is wiped out by about $7k of value loss. Plan a longer hold.
- Sussex County population projected at +25% by 2050 — long-run rental-demand tailwind backs the buy-and-hold thesis.
Negotiation context
- It's been on market 20 days — a 2% lower offer ($217k) is reasonable based on typical stale-listing flexibility.
Risks & watch-outs
- Climate carrying-cost: severe wind risk, 80% chance of damaging wind over 30y; extreme-heat days projected 7→18/yr by 2055 (HVAC capex compounding) — expect insurance premiums to compound above CPI over the hold.
Questions for the listing agent
- Is there a deadline driving the sale (1031 exchange, divorce, estate, relocation)? That informs how much negotiation room exists.
- Schools are B-rated — typically a magnet for longer-tenancy family renters. What's the average tenant stay here, and is there a school-zone premium baked into asking?
- What's the average days-on-market for RENTAL listings here right now (not sales)? A rising rental-DOM trend means longer vacancies and softer asking-rent achievability than the comps imply.
- What's the recent tenant-quality profile in this submarket — average credit score on applications, eviction rate, late-payment / NSF rate, and stable-employment percentage? A property-management company in the area should have these aggregated.
- How much new for-sale + rental construction is in the pipeline within 1–3 miles? Heavy new supply typically softens prices + rents 12–24 months out; constrained supply supports both.
Investment metrics
- 1% rule
- 1.14% ✓
- Cap rate
- 10.02%
- Cash-on-cash
- 13.32%
- DSCR
- 1.59
- GRM
- 7.3
CMA / ARV
No comps found within radius.
Projected returns pro-forma
-3.0% appreciation · 0.77% rent growth · sell at horizon
- IRR
- 1.0%
- Equity multiple
- 1.04×
- Total profit
- $2,323
- Equity at exit
- $32,788
- IRR
- 8.5%
- Equity multiple
- 1.59×
- Total profit
- $36,158
- Equity at exit
- $19,013
Cash invested: $61,572 (down + closing). Projections, not guarantees.
Landlord ↔ Tenant lean methodology
- Overall (STATE)
- 70 Landlord-Friendly
- State Delaware
- 70 Landlord-Friendly · D+7
- County
- — inherits STATE
- City
- — inherits STATE
ZIP-level market 19958
- Rents YoY
- 0.8%
- Active inventory
- 822
- Price-to-rent
- 7.3×
Monthly cashflow live
- Estimated rent
- $2,497 medium interval (Pro) →
- Mortgage (P&I)
- −$1,153
- Tax from tax record
- −$44 /mo · $533/yr
- Insurance
- −$92
- HOA
- −$0
- Vacancy / Maint / Mgmt
- −$524
- Net cashflow
- $684
Break-even live
Sensitivity live
| Price | -10% $808 | -5% $746 | +0% $684 | +5% $621 | +10% $559 |
|---|---|---|---|---|---|
| Rent | -10% $486 | -5% $585 | +0% $684 | +5% $782 | +10% $881 |
| Rate | -1.0pp $794 | -0.5pp $740 | base $684 | +0.5pp $627 | +1.0pp $569 |
UW: 25.0% down · 7.5% · 30yr · 1.5% tax · 5.0% vac · 8.0% maint · 8.0% mgmt
Financing live
Cash to close
- Down payment
- $54,975
- Closing costs
- $6,597
- Reserves months
- —
- Total cash needed
- —
Loan-product check · same deal, 3 products live
Conventional
25% down · 7.5% · 30yr
- Down + closing
- —
- Monthly P&I
- —
- Monthly cashflow
- —
- DSCR
- —
- Eligible?
- —
Personal DTI + credit; lowest rate.
DSCR
20% down · 8.5% · 30yr
- Down + closing
- —
- Monthly P&I
- —
- Monthly cashflow
- —
- DSCR
- —
- Eligible?
- —
No personal income docs; deal must DSCR.
Hard money
10% down · 12.0% · 12mo
- Down + closing
- —
- Monthly P&I
- —
- Monthly cashflow
- —
- DSCR
- —
- Eligible?
- —
Short-term bridge; refi at stabilization.
Rent comps 1 comps
| Address | Beds | Baths | Sqft | Rent | $/sqft | DOM | Units | Dist |
|---|---|---|---|---|---|---|---|---|
| 29988 W Barrier Reef Blvd Lewes, DE | 3.0 | 2.0 | 1825 | $2,645 | $1.45 | 15d | 1 | 1.43mi |
Listing history 17 events
-
2026-06-22days on market $219,900 Active 20 DOM
-
2026-06-18days on market $219,900 Active 17 DOM
-
2026-06-17days on market $219,900 Active 16 DOM
-
2026-06-16days on market $219,900 Active 15 DOM
-
2026-06-15days on market $219,900 Active 14 DOM
-
2026-06-14days on market $219,900 Active 12 DOM
-
2026-06-13days on market $219,900 Active 11 DOM
-
2026-06-10days on market $219,900 Active 9 DOM
-
2026-06-09days on market $219,900 Active 8 DOM
-
2026-06-08days on market $219,900 Active 7 DOM
-
2026-06-07days on market $219,900 Active 6 DOM
-
2026-06-05days on market $219,900 Active 3 DOM
-
2026-06-03days on market $219,900 Active 2 DOM
-
2026-06-02statusdays on market $219,900 Active 1 DOM
-
2026-06-01days on market $219,900 Coming Soon 2 DOM
-
2026-05-30remarks 699-char remark
-
2026-05-30$219,900 Coming Soon 1 DOM
ⓘ Source: listings_history table (triggers on properties + properties_extension) + one-shot
backfill from property_details.listing_events for pre-trigger history.
Tax reassessment forecast DE · Partial reset (capped growth)
- Current annual tax
- $533 · $44/mo
- Projected year-2 tax
- $904 · $75/mo
- Expected delta
- +$371/yr (+$31/mo · 69.6%)
ⓘ Screening estimate from a state-policy table — verify with the county assessor before closing.
Climate risk First Street
- Flood 1/10 Low FEMA zone X (unshaded) · 0% chance over 30 yrs
- Wildfire 3/10 Moderate
- Heat 8/10 Severe 7 d/yr ≥101°F today · 18 d/yr by 30 yrs out
- Wind 8/10 Severe 80% chance of damaging wind over 30 yrs
- Air quality 2/10 Low 1 unhealthy d/yr today · 1 by 30 yrs out
Nearby sold comps map
Loading sold comps map…
Walkable amenities ~0.75 mi
Loading nearby amenities…
Taxation est. · year 1
- Rental income
- $29,968
- − Mortgage interest
- −$12,318
- − Property taxes
- −$533
- − Insurance
- −$1,100
- − Repairs & maintenance
- −$2,397
- − Management
- −$2,397
- − Depreciation
- −$6,397
- Taxable income
- $4,825
- Est. tax owed @ 24.0%
- −$1,158
- After-tax cash flow
- $7,046/yr
For passive investors: Depreciation is non-cash, so a rental often shows a tax loss while cash-flowing — sheltering income. Rental losses are passive: they offset passive income freely, and up to $25,000/yr can offset ordinary (W-2) income if you actively participate and your MAGI is under $100k (phasing out to $0 by $150k); unused losses carry forward. On sale, claimed depreciation is recaptured at up to 25%, and gains may owe capital-gains tax (a 1031 exchange can defer both). Figures are a year-1 estimate at your 24.0% rate — not tax advice; consult a CPA.
Schools (NCES district)
- District
- Cape Henlopen School District
- NCES district ID
- 1000170
- Math proficiency
- 42% ▼ -14.00%
- Reading proficiency
- 55% ▼ -10.00%
- Median HH income
- $60,196
- Composite
- 42.47/100
- National rank
- #3214
- State rank
- #5 of 26 in DE
Livability — Lewes
- Score
- 67/100
- State rank
- #40
- US rank
- #11077
Category grades
Schools grade is shown separately in the Schools card above.
Census & demographics
- County
- Sussex County · 82,708 people
- City population
- 31,938
- Metro
- Salisbury, MD-DE
- Population (ZIP)
- 31,938
- Household income
- $97,197
- Rent vs Own
- Severe rent burden
- 545.0
Population outlook (Sussex County) Hauer SSP2
- Today (2025)
- 248,853 people
- By 2030
- 264,464 · +6.3%
- By 2040
- 290,980 · +16.9%
- By 2050
- 311,259 · +25.1%
- By 2075
- 352,488 · +41.6%
- By 2100
- 367,406 · +47.6%
Race, ethnicity, and origin ACS 2023
- Neighborhood character
- Predominantly White (88%)
- Race & ethnicity
- White 88% Two or more races 6% Hispanic / Latino 4% Black 2% Asian 2%
- Common ancestry
- Romanian 6% Slovak 3% Italian 2%
- Foreign-born
- 6% · Canada
- Languages at home
- 93% English-only · Spanish 3% Other Indo-European 1% Russian/Polish/Slavic 1%
Political lean MEDSL · Sussex
- 2024 margin
- R (+11.0) · D 43.9% · R 54.9% · Other 1.2%
- 2008→2024 swing
- -2.4pp toward R · 2008: -8.6pp · 2024: -11.0pp
- All cycles
- 2024: R+11.0 2020: R+11.2 2016: R+22.0 2012: R+13.0 2008: R+8.6
Not yet ingested
- Civics
- —
Market trends
- HPI YoY
- ▼ -204.07%
- Current HPI
- 299.0736
- Rent YoY
- ▲ 0.77%
- Metro
- Salisbury, MD-DE
- State GDP YoY
- —
- F500 in state
- 0
Price history
+107.6% since first listed3 events — show timeline
- 2026-05-30 Coming Soon $219,900 BRIGHT MLS
- 2017-10-18 Listing Removed — BRIGHT MLS
- 2017-09-28 Listed $105,900 BRIGHT MLS
Property tax history
-0.3%/yrLatest (2025): $533 · -21.0% YoY. Source: county tax records.
Cash-flow waterfall
monthlySold comps — $/sqft
last 12 mo · ≤1 miLoading sold comps…