 🏷️ Likely Rental
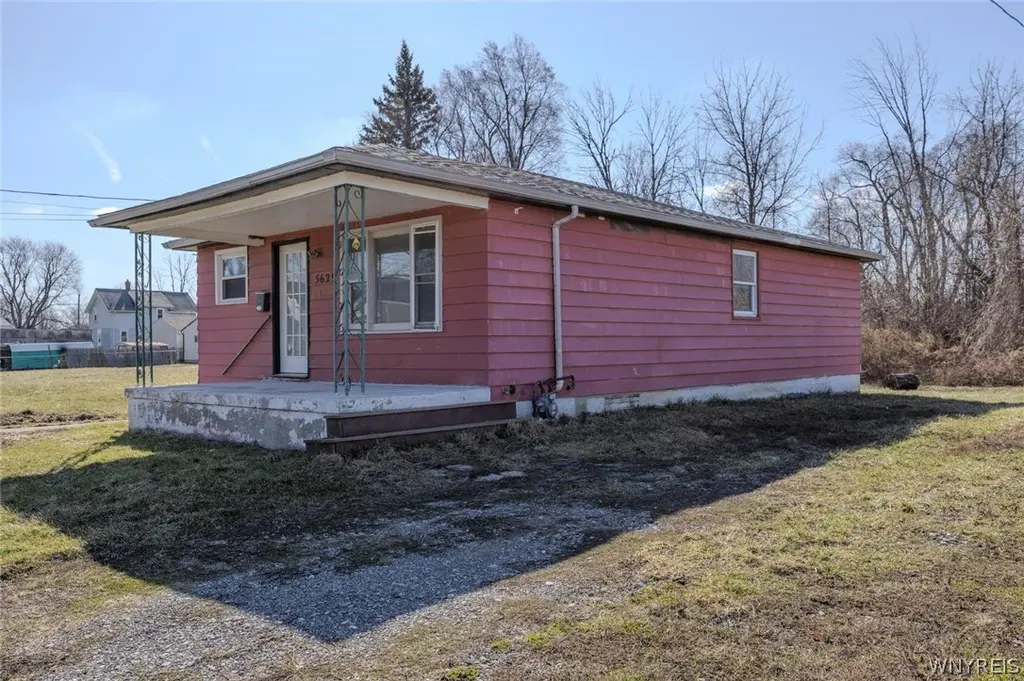
5629 Girard Ave · Niagara Falls, NY
Flood risk 1/10 · Minimal
- FEMA flood zone
- X (unshaded)
- Chance of flooding over 30 yrs
- 0.0%
- Est. flood insurance / yr
- $473 – $860
Fire risk 1/10 · Minimal
- Est. fire insurance / yr
- $691 – $1,283
Heat risk 2/10 · Minimal
- Hot days now (above 94°F)
- 7 days/yr
- Hot days in 30 yrs
- 15 days/yr
Wind risk 1/10 · Minimal
- Chance of severe wind over 30 yrs
- —
Air-quality risk 3/10 · Minor
- Unhealthy air days now
- 2 days/yr
- Unhealthy air days in 30 yrs
- 3 days/yr
Risk factors via First Street. Map © Google.
Why this score? — see what drove the C- grade
The composite is a weighted blend of 9 inputs, each scored 0–100. Each bar is that input's sub-score; the figure is the points it added to the 100-point composite (weight × sub-score).
- Cash flow +17.8/30.0
- ARV discount +15.0/15.0
- DSCR +5.6/10.0
- 1% rule +4.8/10.0
- Livability +3.0/5.0
- Rent growth +2.5/5.0
- Schools +2.5/10.0
- Condition / age +2.5/5.0
- Appreciation +0.0/10.0
$129,900
🖨 Deal sheet (PDF) 📄 Offer letter ✓ Due diligence
Listing remarks MLS
Great value-add opportunity in the City of Niagara Falls! Now vacant and easy to show, this solid ranch-style home offers strong bones, well-maintained mechanicals, and endless potential for its next owner. Previously tenant-occupied for over 20 years, the home is ready for cosmetic updates and your personal touch. Featuring a partially finished basement, there is additional living or recreation space already in place, adding to the home’s overall potential. With a little sweat equity, this property presents an excellent opportunity to build value quickly. The sale includes three additional lots (5635 Girard, 5641 Girard and 5645 Girard), providing extra space, flexibility, and future possibilities. Priced below comparable homes in the area, this is an ideal option for investors or owner-occupants looking to customize and create equity. Check out the open house this Saturday 3/28 from 1:00-3:00pm.
Key facts
- 3,090 sq ft lot
- Built 1976
- Listed 88 days
Tags
Neighborhood map
What this means for you Summary
Snapshot
- This is a 2-bed/1.0-bath single-family listed at $130k.
Deal economics
- At list price, monthly cash flow is $107 ($1k/yr) — positive.
- The deal already cash-flows at list — no discount required.
- To meet the 1% rule (rent ≥ 1% of price), the offer needs to be $127k (2.1% below list).
- Recommended offer: $122k (6.0% below list) — sets the bar for market timing.
Location & tenants
- Location reads 60/100 on livability (#956 in NY) — a middle-class / working-renter tenant base. Strengths: cost of living A+, housing A+; Watch: schools F, crime F, amenities F.
- Niagara Falls City School District (urban): math 26% / reading 34% proficiency, ranked #578 of 590 in NY (top 98%) — families likely to look elsewhere, expect single-tenant / working-renter base with shorter leases; 66% free/reduced lunch — lower-income household profile, screen leases tightly.
- Market conditions: 144 active listings in the ZIP; 6 comparable units currently listed for rent nearby; rentals at typical pace (median 16d on market — plan ~3-4 weeks tenant-placement turnaround); 167 units permitted in Niagara County in 2024 (0 in 5+ unit buildings).
Forward outlook
- Local home prices are declining (-3.0%/yr); year-one equity from $898 of loan paydown is wiped out by about $4k of value loss. Plan a longer hold.
- Niagara County population projected at -19% by 2050 — secular population decline; favor cash flow + early exit over multi-decade hold.
Negotiation context
- It's been on market 88 days — a 6% lower offer ($122k) is reasonable based on typical stale-listing flexibility.
Questions for the listing agent
- It's been on market 88 days. Have you received any prior offers? Is the seller open to a 6% concession, seller financing, or rate buy-down credit?
- Built in 1976 — when were the roof, HVAC, electrical panel, plumbing, and water heater last replaced?
- Why hasn't it sold? Are there any deal-killer items the seller is aware of (foundation, flood, title, zoning, code violations)?
- Is there a deadline driving the sale (1031 exchange, divorce, estate, relocation)? That informs how much negotiation room exists.
- Schools are F-rated, which usually means shorter tenancies and higher turnover. Who's the typical renter profile here, and what's been the actual vacancy rate?
- Crime grade is F in this area — have there been break-ins, vandalism, or insurance claims at this property in the last 3 years? What carrier currently insures it and at what premium?
- What's the average days-on-market for RENTAL listings here right now (not sales)? A rising rental-DOM trend means longer vacancies and softer asking-rent achievability than the comps imply.
- What's the recent tenant-quality profile in this submarket — average credit score on applications, eviction rate, late-payment / NSF rate, and stable-employment percentage? A property-management company in the area should have these aggregated.
- How much new for-sale + rental construction is in the pipeline within 1–3 miles? Heavy new supply typically softens prices + rents 12–24 months out; constrained supply supports both.
Investment metrics
- 1% rule
- 0.98% ✗
- Cap rate
- 7.28%
- Cash-on-cash
- 3.53%
- DSCR
- 1.16
- GRM
- 8.5
CMA / ARV
- ARV (median comp)
- $188,253
- List price
- $129,900
- Delta
- -31.00%
- Verdict
- UNDERPRICED
- Comps
- 20 within 1.0 mi
Show comp detail 12 sales within ~0.75 mi
| Address | Dist | Beds/Ba | Sqft | Sold | Price | $/sf | Match |
|---|---|---|---|---|---|---|---|
| 6721 Lindbergh Ave | 0.67mi | 3/1.0 (+1) | 912 (-2%) | 1mo | $143,500 | $157 | 60 |
| 436 67th St | 0.62mi | 3/1.0 (+1) | 912 (-2%) | 4mo | $157,000 | $172 | 59 |
| 5818 Stephenson Ave | 0.35mi | 3/1.0 (+1) | 980 (+5%) | 17mo | $174,000 | $178 | 56 |
| 154 62nd St | 0.62mi | 3/1.0 (+1) | 904 (-3%) | 13mo | $175,000 | $194 | 51 |
| 639 67th St | 0.62mi | 3/1.0 (+1) | 952 (+2%) | 18mo | $195,000 | $205 | 48 |
| 660 67th St | 0.60mi | 2/1.0 | 1,025 (+10%) | 12mo | $150,000 | $146 | 45 |
| 6716 Lindbergh Ave | 0.65mi | 2/1.0 | 888 (-5%) | 20mo | $70,000 | $79 | 45 |
| 53 Kies Ct | 0.59mi | 3/2.0 (+1) | 1,008 (+8%) | 10mo | $240,000 | $238 | 42 |
| 222 61st St | 0.47mi | 3/1.0 (+1) | 816 (-12%) | 16mo | $150,000 | $184 | 39 |
| 673 67th St | 0.63mi | 3/1.0 (+1) | 988 (+6%) | 20mo | $142,000 | $144 | 39 |
| 130 62nd St | 0.66mi | 3/1.0 (+1) | 1,024 (+10%) | 17mo | $102,000 | $100 | 34 |
| 45 Kies Ct | 0.58mi | 3/2.0 (+1) | 1,008 (+8%) | 21mo | $185,000 | $184 | 33 |
Match score weights: distance 35% · size 25% · config 20% · recency 20%. Top-matched comps best support the ARV.
Projected returns pro-forma
-3.0% appreciation · 3.0% rent growth · sell at horizon
- IRR
- -10.7%
- Equity multiple
- 0.61×
- Total profit
- $-14,206
- Equity at exit
- $19,369
- IRR
- -1.4%
- Equity multiple
- 0.90×
- Total profit
- $-3,506
- Equity at exit
- $11,231
Cash invested: $36,372 (down + closing). Projections, not guarantees.
Landlord ↔ Tenant lean methodology
- Overall (STATE)
- 15 Strongly Tenant-Friendly
- State New York
- 15 Strongly Tenant-Friendly · D+10
- County
- — inherits STATE
- City
- — inherits STATE
ZIP-level market 14304
- Active inventory
- 144
- Price-to-rent
- 8.5×
Monthly cashflow live
- Estimated rent
- $1,272 high interval (Pro) →
- Mortgage (P&I)
- −$681
- Tax from tax record
- −$162 /mo · $1,945/yr
- Insurance
- −$54
- HOA
- −$0
- Vacancy / Maint / Mgmt
- −$267
- Net cashflow
- $107
Break-even live
Sensitivity live
| Price | -10% $181 | -5% $144 | +0% $107 | +5% $70 | +10% $34 |
|---|---|---|---|---|---|
| Rent | -10% $7 | -5% $57 | +0% $107 | +5% $157 | +10% $208 |
| Rate | -1.0pp $173 | -0.5pp $140 | base $107 | +0.5pp $73 | +1.0pp $39 |
UW: 25.0% down · 7.5% · 30yr · 1.5% tax · 5.0% vac · 8.0% maint · 8.0% mgmt
Financing live
Cash to close
- Down payment
- $32,475
- Closing costs
- $3,897
- Reserves months
- —
- Total cash needed
- —
Loan-product check · same deal, 3 products live
Conventional
25% down · 7.5% · 30yr
- Down + closing
- —
- Monthly P&I
- —
- Monthly cashflow
- —
- DSCR
- —
- Eligible?
- —
Personal DTI + credit; lowest rate.
DSCR
20% down · 8.5% · 30yr
- Down + closing
- —
- Monthly P&I
- —
- Monthly cashflow
- —
- DSCR
- —
- Eligible?
- —
No personal income docs; deal must DSCR.
Hard money
10% down · 12.0% · 12mo
- Down + closing
- —
- Monthly P&I
- —
- Monthly cashflow
- —
- DSCR
- —
- Eligible?
- —
Short-term bridge; refi at stabilization.
Rent comps 6 comps
| Address | Beds | Baths | Sqft | Rent | $/sqft | DOM | Units | Dist |
|---|---|---|---|---|---|---|---|---|
| 730 66th St Niagara Falls, NY | 2.0 | 1.0 | 748 | $963 | $1.29 | 2d | 1 | 0.55mi |
| 3340 Simmons Ave Niagara Falls, NY | 3.0 | 1.0 | 1008 | $1,550 | $1.54 | 15d | 1 | 1.01mi |
| 3626 Dudley Ave Niagara Falls, NY | 2.0 | 1.0 | 700 | $1,250 | $1.79 | 44d | 1 | 1.05mi |
| 3036 Welch Ave Niagara Falls, NY | 3.0 | 1.0 | 1000 | $1,500 | $1.50 | 2d | 1 | 1.28mi |
| 7328 Buffalo Ave Unit 3 Niagara Falls, NY | 2.0 | 1.0 | 800 | $990 | $1.24 | 44d | 1 | 1.28mi |
| 2727 Monroe Ave Niagara Falls, NY | 3.0 | 1.0 | 960 | $1,500 | $1.56 | 11d | 1 | 1.50mi |
Listing history 18 events
-
2026-06-21days on market $129,900 Active 88 DOM
-
2026-06-18days on market $129,900 Active 85 DOM
-
2026-06-17days on market $129,900 Active 84 DOM
-
2026-06-16days on market $129,900 Active 83 DOM
-
2026-06-15days on market $129,900 Active 82 DOM
-
2026-06-13days on market $129,900 Active 80 DOM
-
2026-06-13days on market $129,900 Active 79 DOM
-
2026-06-10days on market $129,900 Active 77 DOM
-
2026-06-09days on market $129,900 Active 76 DOM
-
2026-06-08days on market $129,900 Active 75 DOM
-
2026-06-07days on market $129,900 Active 74 DOM
-
2026-06-03days on market $129,900 Active 70 DOM
-
2026-06-02days on market $129,900 Active 69 DOM
-
2026-06-01days on market $129,900 Active 68 DOM
-
2026-05-31days on market $129,900 Active 67 DOM
-
2026-05-18price $134,900 916-char remark
Show marketing remark (916 chars)
Great value-add opportunity in the City of Niagara Falls! Now vacant and easy to show, this solid ranch-style home offers strong bones, well-maintained mechanicals, and endless potential for its next owner. Previously tenant-occupied for over 20 years, the home is ready for cosmetic updates and your personal touch. Featuring a partially finished basement, there is additional living or recreation space already in place, adding to the home’s overall potential. With a little sweat equity, this property presents an excellent opportunity to build value quickly. The sale includes three additional lots (5635 Girard, 5641 Girard and 5645 Girard), providing extra space, flexibility, and future possibilities. Priced below comparable homes in the area, this is an ideal option for investors or owner-occupants looking to customize and create equity. Check out the open house this Saturday 3/28 from 1:00-3:00pm.
-
2026-04-10price $139,900 916-char remark
Show marketing remark (916 chars)
Great value-add opportunity in the City of Niagara Falls! Now vacant and easy to show, this solid ranch-style home offers strong bones, well-maintained mechanicals, and endless potential for its next owner. Previously tenant-occupied for over 20 years, the home is ready for cosmetic updates and your personal touch. Featuring a partially finished basement, there is additional living or recreation space already in place, adding to the home’s overall potential. With a little sweat equity, this property presents an excellent opportunity to build value quickly. The sale includes three additional lots (5635 Girard, 5641 Girard and 5645 Girard), providing extra space, flexibility, and future possibilities. Priced below comparable homes in the area, this is an ideal option for investors or owner-occupants looking to customize and create equity. Check out the open house this Saturday 3/28 from 1:00-3:00pm.
-
2026-03-25$149,900 Active 916-char remark
Show marketing remark (916 chars)
Great value-add opportunity in the City of Niagara Falls! Now vacant and easy to show, this solid ranch-style home offers strong bones, well-maintained mechanicals, and endless potential for its next owner. Previously tenant-occupied for over 20 years, the home is ready for cosmetic updates and your personal touch. Featuring a partially finished basement, there is additional living or recreation space already in place, adding to the home’s overall potential. With a little sweat equity, this property presents an excellent opportunity to build value quickly. The sale includes three additional lots (5635 Girard, 5641 Girard and 5645 Girard), providing extra space, flexibility, and future possibilities. Priced below comparable homes in the area, this is an ideal option for investors or owner-occupants looking to customize and create equity. Check out the open house this Saturday 3/28 from 1:00-3:00pm.
ⓘ Source: listings_history table (triggers on properties + properties_extension) + one-shot
backfill from property_details.listing_events for pre-trigger history.
Tax reassessment forecast NY · Partial reset (capped growth)
- Current annual tax
- $1,945 · $162/mo
- Projected year-2 tax
- $2,070 · $173/mo
- Expected delta
- +$125/yr (+$10/mo · 6.4%)
ⓘ Screening estimate from a state-policy table — verify with the county assessor before closing.
Climate risk First Street
- Flood 1/10 Low FEMA zone X (unshaded) · 0% chance over 30 yrs
- Wildfire 1/10 Low
- Heat 2/10 Low 7 d/yr ≥94°F today · 15 d/yr by 30 yrs out
- Wind 1/10 Low
- Air quality 3/10 Moderate 2 unhealthy d/yr today · 3 by 30 yrs out
Nearby sold comps map
Loading sold comps map…
Walkable amenities ~0.75 mi
Loading nearby amenities…
Taxation est. · year 1
- Rental income
- $15,259
- − Mortgage interest
- −$7,276
- − Property taxes
- −$1,945
- − Insurance
- −$650
- − Repairs & maintenance
- −$1,221
- − Management
- −$1,221
- − Depreciation
- −$3,779
- Taxable loss
- −$832
- Est. tax savings @ 24.0%
- +$200
- After-tax cash flow
- $1,485/yr
For passive investors: Depreciation is non-cash, so a rental often shows a tax loss while cash-flowing — sheltering income. Rental losses are passive: they offset passive income freely, and up to $25,000/yr can offset ordinary (W-2) income if you actively participate and your MAGI is under $100k (phasing out to $0 by $150k); unused losses carry forward. On sale, claimed depreciation is recaptured at up to 25%, and gains may owe capital-gains tax (a 1031 exchange can defer both). Figures are a year-1 estimate at your 24.0% rate — not tax advice; consult a CPA.
Schools (NCES district)
- District
- Niagara Falls City School District
- NCES district ID
- 3620820
- Math proficiency
- 26% ▼ -10.00%
- Reading proficiency
- 34% ▲ 3.00%
- Median HH income
- $32,488
- Composite
- 24.5/100
- National rank
- #7655
- State rank
- #578 of 590 in NY
Livability — Niagara Falls
- Score
- 60/100
- State rank
- #956
- US rank
- #18749
Category grades
Schools grade is shown separately in the Schools card above.
Census & demographics
- Census place
- Niagara Falls, NY
- County
- Niagara County · 157,377 people
- City population
- 62,983
- Metro
- Buffalo-Cheektowaga, NY
- Population (ZIP)
- 29,208
- Household income
- $66,660
- Rent vs Own
- Severe rent burden
- 698.0
Population outlook (Niagara County) Hauer SSP2
- Today (2025)
- 204,149 people
- By 2030
- 197,900 · -3.1%
- By 2040
- 182,239 · -10.7%
- By 2050
- 165,198 · -19.1%
- By 2075
- 129,416 · -36.6%
- By 2100
- 96,222 · -52.9%
Race, ethnicity, and origin ACS 2023
- Neighborhood character
- Predominantly White (85%)
- Race & ethnicity
- White 85% Two or more races 6% Hispanic / Latino 4% Black 3% Asian 2%
- Common ancestry
- Romanian 10% Lithuanian 3% Slovak 2%
- Foreign-born
- 3% · Canada, China, Vietnam
- Languages at home
- 93% English-only · Spanish 3% Other Indo-European 1% Russian/Polish/Slavic 1%
Political lean MEDSL · Niagara
- 2024 margin
- R (+14.9) · D 42.5% · R 57.5%
- 2008→2024 swing
- -15.9pp toward R · 2008: 1.0pp · 2024: -14.9pp
- All cycles
- 2024: R+14.9 2020: R+9.7 2016: R+19.0 2012: D+0.6 2008: D+1.0
Not yet ingested
- Civics
- —
Market trends
- HPI YoY
- ▼ -231.77%
- Current HPI
- 280.3295
- Rent YoY
- —
- Metro
- Buffalo-Cheektowaga, NY
- State GDP YoY
- ▲ 2.60%
- F500 in state
- 92
Industry mix (Fortune 500 HQ in NY)
| Industry | F500 HQs | Revenue |
|---|---|---|
| Financial Services | 10 | $950B |
|
||
| Consumer Goods | 9 | $162B |
|
||
| Insurance | 4 | $225B |
|
||
| Telecommunications | 2 | $144B |
|
||
| Pharmaceuticals | 2 | $112B |
|
||
| Media / Entertainment | 2 | $69B |
|
||
Price history
-10.0% since first listed3 events — show timeline
- 2026-05-18 Price Changed $134,900 WNYREIS
- 2026-04-10 Price Changed $139,900 WNYREIS
- 2026-03-25 Listed $149,900 WNYREIS
Property tax history
+5.8%/yrLatest (2025): $1,945 · +19.3% YoY. Source: county tax records.
Cash-flow waterfall
monthlySold comps — $/sqft
last 12 mo · ≤1 miLoading sold comps…