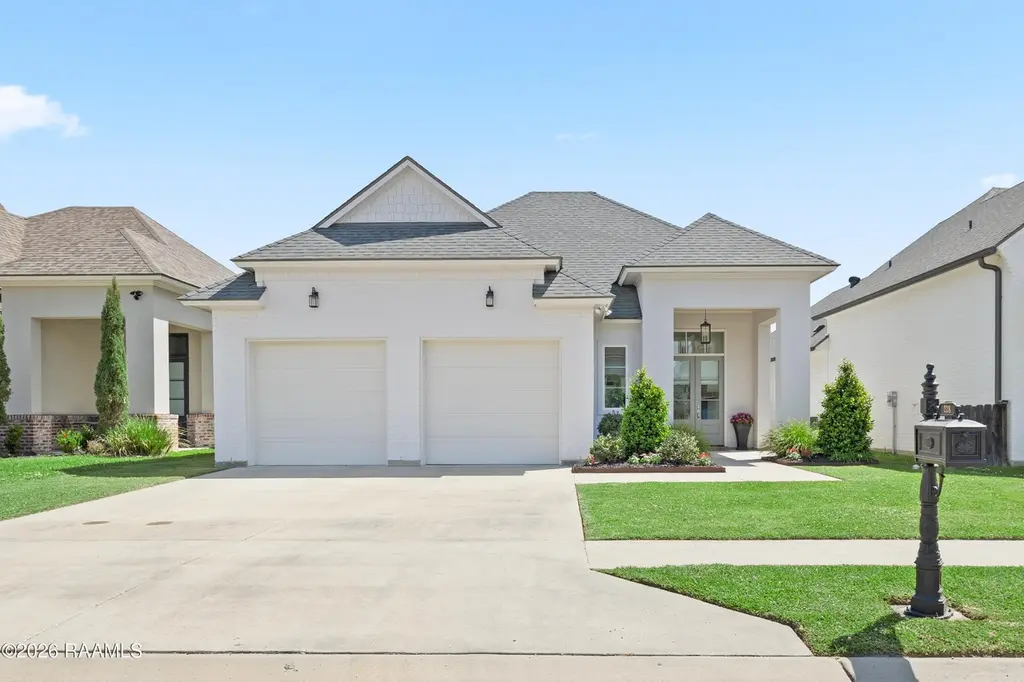
228 Santander Dr · Youngsville, LA
Flood risk 1/10 · Minimal
- FEMA flood zone
- X (unshaded)
- Chance of flooding over 30 yrs
- 0.0%
- Est. flood insurance / yr
- $507 – $1,088
Fire risk 3/10 · Minor
- Est. fire insurance / yr
- $1,269 – $2,357
Heat risk 9/10 · Severe
- Hot days now (above 109°F)
- 7 days/yr
- Hot days in 30 yrs
- 21 days/yr
Wind risk 9/10 · Severe
- Chance of severe wind over 30 yrs
- 99.0%
Air-quality risk 1/10 · Minimal
- Unhealthy air days now
- 0 days/yr
- Unhealthy air days in 30 yrs
- 0 days/yr
Risk factors via First Street. Map © Google.
Why this score? — see what drove the D- grade
The composite is a weighted blend of 9 inputs, each scored 0–100. Each bar is that input's sub-score; the figure is the points it added to the 100-point composite (weight × sub-score).
- Cash flow +11.7/30.0
- ARV discount +8.1/15.0
- Livability +3.9/5.0
- Schools +3.6/10.0
- DSCR +3.4/10.0
- Rent growth +2.9/5.0
- 1% rule +2.6/10.0
- Condition / age +2.5/5.0
- Appreciation +0.0/10.0
$349,900
🖨 Deal sheet 📄 Offer letter ✓ Due diligence
Listing remarks MLS
This 3 bedroom 2 bath split floor plan with vaulted ceilings is a must see! Open floor plan fro kitchen to the living room. The flow of the master bedroom with tall ceilings into the double vanity bathroom with soaker tub, walk-in shower flows into the spacious master closet. What a great floor plan. Enjoy the outdoors on the patio with a fireplace and bricked-in grill and mini-fridge; and fully fenced-in yard.
Key facts
- Open-concept design
- Soaking tub
- Split floor plan
Tags
Neighborhood map
What this means for you Summary
Snapshot
- This is a 3-bed/2.0-bath single-family listed at $350k.
Deal economics
- At list price, monthly cash flow is $-102 ($-1k/yr) — negative.
- To cash-flow at today's rent, offer at most $332k (5.2% below list).
- To meet the 1% rule (rent ≥ 1% of price), the offer needs to be $268k (23.5% below list).
- Recommended offer: $268k (23.5% below list) — sets the bar for 1% rule.
- Cap rate 5.9% vs local median 4.8% in Youngsville — meaningfully above typical; check what's discounted (condition, days-on-market, listing class) to confirm the premium yield is real.
Location & tenants
- Location reads 78/100 on livability (#8 in LA, #2,614 nationally) — a middle-class / working-renter tenant base. Strengths: employment A+, housing A+, health & safety A+; Watch: amenities F, commute F.
- Lafayette Parish (urban): math 38% / reading 46% proficiency, ranked #19 of 98 in LA (top 19%) — families likely to look elsewhere, expect single-tenant / working-renter base with shorter leases.
- Zoned schools: Ernest Gallet Elementary School (math 74% / reading 68%, grade A-, #23 of 646 statewide, top 4%, 702 students, 40% FRL); Youngsville Middle School (math 42% / reading 52%, grade D+, #37 of 218 statewide, top 18%, 646 students, 49% FRL); Southside High School (math 52% / reading 53%, grade C-, #30 of 265 statewide, top 12%, 1,910 students, 39% FRL).
- Zoned-school proficiency averages 57% at this address vs 42% district-wide (+15 pts) — the actual schools serving this property are materially stronger than the Lafayette Parish average implies; a family-tenant draw the district grade alone would hide.
- Market conditions: Rents rising (+1.6%/yr); 675 active listings in the ZIP; 6 comparable units currently listed for rent nearby; rentals lingering (median 44d on market — plan ~5-8 weeks vacancy on turnover, expect pricing pressure); 50% of comp listings sitting > 30 days — soft ceiling on asking rent; solid renter incomes; 1,585 units permitted in Lafayette Parish in 2024 (10 in 5+ unit buildings).
- This rent runs 34% of the median local income ($93k/yr) — at the standard rent-burdened threshold; future hikes will face affordability resistance.
Forward outlook
- Local home prices are declining (-3.0%/yr); year-one equity from $2k of loan paydown is wiped out by about $10k of value loss. Plan a longer hold.
- Lafayette County population projected at +34% by 2050 — long-run rental-demand tailwind backs the buy-and-hold thesis.
Negotiation context
- It's been on market 18 days — a 2% lower offer ($345k) is reasonable based on typical stale-listing flexibility.
- 4 sale attempts since 8y ago with the ask held roughly flat each time — persistent listings suggest the price (not the market) is what's stuck; bring a comps-based counter.
- Current owner paid $288k; 21% above their basis — modest negotiation headroom, anchor on the comps not their cost.
Risks & watch-outs
- Climate carrying-cost: severe wind risk, 99% chance of damaging wind over 30y; extreme-heat days projected 7→21/yr by 2055 (HVAC capex compounding) — expect insurance premiums to compound above CPI over the hold.
Questions for the listing agent
- What do current leases actually rent for vs. the listed asking? Can we see a recent rent roll and the last 12 months of T-12 income?
- What does the HOA fee cover, when was the last increase, and are there any pending special assessments or reserve-fund shortfalls?
- Is there a deadline driving the sale (1031 exchange, divorce, estate, relocation)? That informs how much negotiation room exists.
- Schools are A-rated — typically a magnet for longer-tenancy family renters. What's the average tenant stay here, and is there a school-zone premium baked into asking?
- The area grade is low — what's the realistic commute time and amenity access for the typical tenant pool here? Any planned neighborhood developments (good or bad) we should know about?
- What's the average days-on-market for RENTAL listings here right now (not sales)? A rising rental-DOM trend means longer vacancies and softer asking-rent achievability than the comps imply.
- What's the recent tenant-quality profile in this submarket — average credit score on applications, eviction rate, late-payment / NSF rate, and stable-employment percentage? A property-management company in the area should have these aggregated.
- How much new for-sale + rental construction is in the pipeline within 1–3 miles? Heavy new supply typically softens prices + rents 12–24 months out; constrained supply supports both.
Investment metrics
- 1% rule
- 0.76% ✗
- Cap rate
- 5.94%
- Cash-on-cash
- -1.25%
- DSCR
- 0.94
- GRM
- 10.9
CMA / ARV
- ARV (on-the-fly)
- $354,464
- Comps found
- 12
Show comp detail 12 sales within ~0.75 mi
| Address | Dist | Beds/Ba | Sqft | Sold | Price | $/sf | Match |
|---|---|---|---|---|---|---|---|
| 228 Santander Dr | 0.00mi | 3/2.0 | 2,006 (-0%) | 1mo | $349,900 | $174 | 99 |
| 208 San Marcos Dr | 0.10mi | 3/2.0 | 1,953 (-3%) | 8mo | $390,000 | $200 | 84 |
| 204 Central Village Way | 0.16mi | 4/2.0 (+1) | 1,874 (-7%) | 0mo | $318,600 | $170 | 76 |
| 100 Rio Dr | 0.17mi | 3/2.5 | 1,843 (-8%) | 1mo | $321,900 | $175 | 75 |
| 200 Rio Dr | 0.08mi | 3/2.0 | 1,843 (-8%) | 9mo | $323,500 | $176 | 75 |
| 210 Central Village Way | 0.14mi | 3/2.5 | 1,843 (-8%) | 3mo | $317,000 | $172 | 75 |
| 103 Santander Dr | 0.16mi | 3/2.0 | 1,871 (-7%) | 8mo | $340,000 | $182 | 74 |
| 203 Central Village Way | 0.18mi | 4/2.0 (+1) | 1,873 (-7%) | 2mo | $318,500 | $170 | 73 |
| 226 Central Village Way | 0.16mi | 3/2.0 | 1,767 (-12%) | 7mo | $311,500 | $176 | 67 |
| 202 Central Village Way | 0.16mi | 3/2.0 | 1,719 (-15%) | 2mo | $302,200 | $176 | 66 |
| 227 Central Village Way | 0.16mi | 3/2.0 | 1,719 (-15%) | 10mo | $302,200 | $176 | 60 |
| 116 Border Ct | 0.60mi | 4/2.0 (+1) | 1,899 (-6%) | 8mo | $227,000 | $120 | 51 |
Match score weights: distance 35% · size 25% · config 20% · recency 20%. Top-matched comps best support the ARV.
Projected returns pro-forma
-3.0% appreciation · 1.65% rent growth · sell at horizon
- IRR
- -19.8%
- Equity multiple
- 0.32×
- Total profit
- $-66,867
- Equity at exit
- $52,171
- IRR
- -15.6%
- Equity multiple
- 0.17×
- Total profit
- $-81,258
- Equity at exit
- $30,253
Cash invested: $97,972 (down + closing). Projections, not guarantees.
Landlord ↔ Tenant lean methodology
- Overall (STATE)
- 90 Strongly Landlord-Friendly
- State Louisiana
- 90 Strongly Landlord-Friendly · R+12
- County
- — inherits STATE
- City
- — inherits STATE
ZIP-level market 70592
- Home prices YoY
- -23.4%
- Rents YoY
- 1.6%
- Active inventory
- 675
- Price-to-rent
- 10.9×
Monthly cashflow live
- Estimated rent
- $2,676 high interval (Pro) →
- Mortgage (P&I)
- −$1,835
- Tax from tax record
- −$206 /mo · $2,476/yr
- Insurance
- −$146
- HOA
- −$29
- Vacancy / Maint / Mgmt
- −$562
- Net cashflow
- $-102
Break-even live
UW: 25.0% down · 7.5% · 30yr · 1.5% tax · 5.0% vac · 8.0% maint · 8.0% mgmt
Financing live
Cash to close
- Down payment
- $87,475
- Closing costs
- $10,497
- Reserves months
- —
- Total cash needed
- —
Loan-product check · same deal, 3 products live
Conventional
25% down · 7.5% · 30yr
- Down + closing
- —
- Monthly P&I
- —
- Monthly cashflow
- —
- DSCR
- —
- Eligible?
- —
Personal DTI + credit; lowest rate.
DSCR
20% down · 8.5% · 30yr
- Down + closing
- —
- Monthly P&I
- —
- Monthly cashflow
- —
- DSCR
- —
- Eligible?
- —
No personal income docs; deal must DSCR.
Hard money
10% down · 12.0% · 12mo
- Down + closing
- —
- Monthly P&I
- —
- Monthly cashflow
- —
- DSCR
- —
- Eligible?
- —
Short-term bridge; refi at stabilization.
Rent comps 6 comps
| Address | Beds | Baths | Sqft | Rent | $/sqft | DOM | Units | Dist |
|---|---|---|---|---|---|---|---|---|
| 117 San Sebastian Dr Youngsville, LA | 4.0 | 3.0 | 2239 | $3,500 | $1.56 | 13d | 1 | 0.15mi |
| 305 San Sebastian Dr Youngsville, LA | 4.0 | 3.0 | 2128 | $2,800 | $1.32 | 43d | 1 | 0.17mi |
| 213 Garden Oaks Ave Youngsville, LA | 4.0 | 3.0 | 2334 | $2,600 | $1.11 | 43d | 1 | 0.51mi |
| 106 Royal Oak St Youngsville, LA | 3.0 | 2.0 | 1616 | $1,895 | $1.17 | 43d | 1 | 0.52mi |
| 111 Abbeywood Ct Youngsville, LA | 3.0 | 2.0 | 1616 | $1,800 | $1.11 | 21d | 1 | 0.65mi |
| 102 Border Ct Youngsville, LA | 4.0 | 2.0 | 1786 | $2,100 | $1.18 | 13d | 1 | 0.68mi |
HOA detail
- Monthly dues
- $29 · $348/yr
Listing history 8 events
-
2026-04-24status Pending
-
2026-04-13status Active
-
2026-04-07status Pending
-
2026-03-30$349,900 Active
-
2020-06-09soldstatus $288,500 414-char remark
Show marketing remark (414 chars)
This 3 bedroom 2 bath split floor plan with vaulted ceilings is a must see! Open floor plan fro kitchen to the living room. The flow of the master bedroom with tall ceilings into the double vanity bathroom with soaker tub, walk-in shower flows into the spacious master closet. What a great floor plan. Enjoy the outdoors on the patio with a fireplace and bricked-in grill and mini-fridge; and fully fenced-in yard.
-
2019-08-29$288,500 414-char remark
Show marketing remark (414 chars)
This 3 bedroom 2 bath split floor plan with vaulted ceilings is a must see! Open floor plan fro kitchen to the living room. The flow of the master bedroom with tall ceilings into the double vanity bathroom with soaker tub, walk-in shower flows into the spacious master closet. What a great floor plan. Enjoy the outdoors on the patio with a fireplace and bricked-in grill and mini-fridge; and fully fenced-in yard.
-
2018-08-01soldstatus $42,500 654-char remark
Show marketing remark (654 chars)
San Sebastian Neighborhood is located on Verot School road past Hwy 92 traffic circle and is within 5 minutes of Rouses, Youngsville Sport Complex and zoned for the new Southside High School. High & Dry in the August 2016 Flood! Developed, Built, and Sold by Locals - San Sebastian offers multiple local builders with a variety of floorplans. The neighborhood features a 7 acre lake with common area to fish, have a picnic, or take an evening stroll. Your children can enjoy the neighborhood park and playground which will be tucked away in a cul-de-sac lot. Call to start the process of picking your future homes lot. Lake lots are still available!!
-
2018-03-25$42,500 654-char remark
Show marketing remark (654 chars)
San Sebastian Neighborhood is located on Verot School road past Hwy 92 traffic circle and is within 5 minutes of Rouses, Youngsville Sport Complex and zoned for the new Southside High School. High & Dry in the August 2016 Flood! Developed, Built, and Sold by Locals - San Sebastian offers multiple local builders with a variety of floorplans. The neighborhood features a 7 acre lake with common area to fish, have a picnic, or take an evening stroll. Your children can enjoy the neighborhood park and playground which will be tucked away in a cul-de-sac lot. Call to start the process of picking your future homes lot. Lake lots are still available!!
ⓘ Source: listings_history table (triggers on properties + properties_extension) + one-shot
backfill from property_details.listing_events for pre-trigger history.
Tax reassessment forecast LA · Resets to sale price
- Current annual tax
- $2,476 · $206/mo
- Projected year-2 tax
- $2,476 · $206/mo
- Expected delta
- $0/yr ($0/mo · 0.0%)
ⓘ Screening estimate from a state-policy table — verify with the county assessor before closing.
Climate risk First Street
- Flood 1/10 Low FEMA zone X (unshaded) · 0% chance over 30 yrs
- Wildfire 3/10 Moderate
- Heat 9/10 Extreme 7 d/yr ≥109°F today · 21 d/yr by 30 yrs out
- Wind 9/10 Extreme 99% chance of damaging wind over 30 yrs
- Air quality 1/10 Low 0 unhealthy d/yr today · 0 by 30 yrs out
Nearby sold comps map
Loading sold comps map…
Walkable amenities ~0.75 mi
Loading nearby amenities…
Taxation est. · year 1
- Rental income
- $32,111
- − Mortgage interest
- −$19,600
- − Property taxes
- −$2,476
- − Insurance
- −$1,750
- − Repairs & maintenance
- −$2,569
- − Management
- −$2,569
- − HOA
- −$348
- − Depreciation
- −$10,179
- Taxable loss
- −$7,379
- Est. tax savings @ 24.0%
- +$1,771
- After-tax cash flow
- $547/yr
For passive investors: Depreciation is non-cash, so a rental often shows a tax loss while cash-flowing — sheltering income. Rental losses are passive: they offset passive income freely, and up to $25,000/yr can offset ordinary (W-2) income if you actively participate and your MAGI is under $100k (phasing out to $0 by $150k); unused losses carry forward. On sale, claimed depreciation is recaptured at up to 25%, and gains may owe capital-gains tax (a 1031 exchange can defer both). Figures are a year-1 estimate at your 24.0% rate — not tax advice; consult a CPA.
Schools (NCES district)
- District
- Lafayette Parish
- NCES district ID
- 2200870
- Math proficiency
- 38% ▼ -32.00%
- Reading proficiency
- 46% ▼ -24.00%
- Median HH income
- $50,238
- Composite
- 36.15/100
- National rank
- #4741
- State rank
- #19 of 98 in LA
Livability — Youngsville
- Score
- 78/100
- State rank
- #8
- US rank
- #2614
Category grades
Schools grade is shown separately in the Schools card above.
Census & demographics
- County
- Lafayette Parish · 207,544 people
- City population
- 32,167
- Metro
- Lafayette, LA
- Population (ZIP)
- 32,167
- Household income
- $93,204
- Rent vs Own
- Severe rent burden
- 424.0
Population outlook (Lafayette County) Hauer SSP2
- Today (2025)
- 280,930 people
- By 2030
- 301,092 · +7.2%
- By 2040
- 339,456 · +20.8%
- By 2050
- 375,156 · +33.5%
- By 2075
- 451,672 · +60.8%
- By 2100
- 497,203 · +77.0%
Race, ethnicity, and origin ACS 2023
- Neighborhood character
- Predominantly White (82%)
- Race & ethnicity
- White 82% Black 10% Two or more races 5% Hispanic / Latino 4% Asian 1%
- Common ancestry
- Lithuanian 24% Romanian 3% Italian 1%
- Foreign-born
- 3% · Canada
- Languages at home
- 94% English-only · French/Haitian/Cajun 3% Spanish 2%
Political lean MEDSL · Lafayette
- 2024 margin
- Solid R (+31.4) · D 33.5% · R 64.8% · Other 1.7%
- 2008→2024 swing
- -0.1pp no change · 2008: -31.3pp · 2024: -31.4pp
- All cycles
- 2024: R+31.4 2020: R+28.7 2016: R+33.6 2012: R+33.7 2008: R+31.3
Not yet ingested
- Civics
- —
Market trends
- HPI YoY
- ▼ -41.24%
- Current HPI
- 135.2825
- Rent YoY
- ▲ 1.65%
- Metro
- Lafayette, LA
- State GDP YoY
- ▲ 3.29%
- F500 in state
- 10
Industry mix (Fortune 500 HQ in LA)
| Industry | F500 HQs | Revenue |
|---|---|---|
| Telecommunications | 2 | $23B |
|
||
| Utilities | 1 | $12B |
|
||
| Wholesale / Distribution | 1 | $5B |
|
||
| Advertising | 1 | $2B |
|
||
Price history
+723.3% since first listed8 events — show timeline
- 2026-04-24 Pending — AcadianaMLS
- 2026-04-13 Relisted — AcadianaMLS
- 2026-04-07 Pending — AcadianaMLS
- 2026-03-30 Listed $349,900 AcadianaMLS
- 2020-06-09 Sold (MLS) $288,500 AcadianaMLS
- 2019-08-29 Listed $288,500 AcadianaMLS
- 2018-08-01 Sold (MLS) $42,500 AcadianaMLS
- 2018-03-25 Listed $42,500 AcadianaMLS
Property tax history
+73.6%/yrLatest (2025): $2,476 · -1.3% YoY. Source: county tax records.
Cash-flow waterfall
monthlySold comps — $/sqft
last 12 mo · ≤1 miLoading sold comps…