 Duplex
704 Marlin Ln · James Island, SC
Flood risk 4/10 · Minor
- FEMA flood zone
- X (unshaded)
- Chance of flooding over 30 yrs
- 0.13%
- Est. flood insurance / yr
- $507 – $1,088
Fire risk 1/10 · Minimal
- Est. fire insurance / yr
- $783 – $1,453
Heat risk 10/10 · Severe
- Hot days now (above 104°F)
- 7 days/yr
- Hot days in 30 yrs
- 19 days/yr
Wind risk 9/10 · Severe
- Chance of severe wind over 30 yrs
- 99.0%
Air-quality risk 3/10 · Minor
- Unhealthy air days now
- 2 days/yr
- Unhealthy air days in 30 yrs
- 3 days/yr
Risk factors via First Street. Map © Google.
Why this score? — see what drove the C- grade
The composite is a weighted blend of 9 inputs, each scored 0–100. Each bar is that input's sub-score; the figure is the points it added to the 100-point composite (weight × sub-score).
- Cash flow +21.2/30.0
- ARV discount +7.5/15.0
- DSCR +6.8/10.0
- 1% rule +4.7/10.0
- Schools +4.3/10.0
- Livability +3.5/5.0
- Rent growth +3.0/5.0
- Condition / age +2.5/5.0
- Appreciation +0.0/10.0
$600,000
🖨 Deal sheet 📄 Offer letter ✓ Due diligence
Multi-family units
County records classify this as Multi-Family (2-4 Unit). Listing-text estimate: 2 units. confirmed
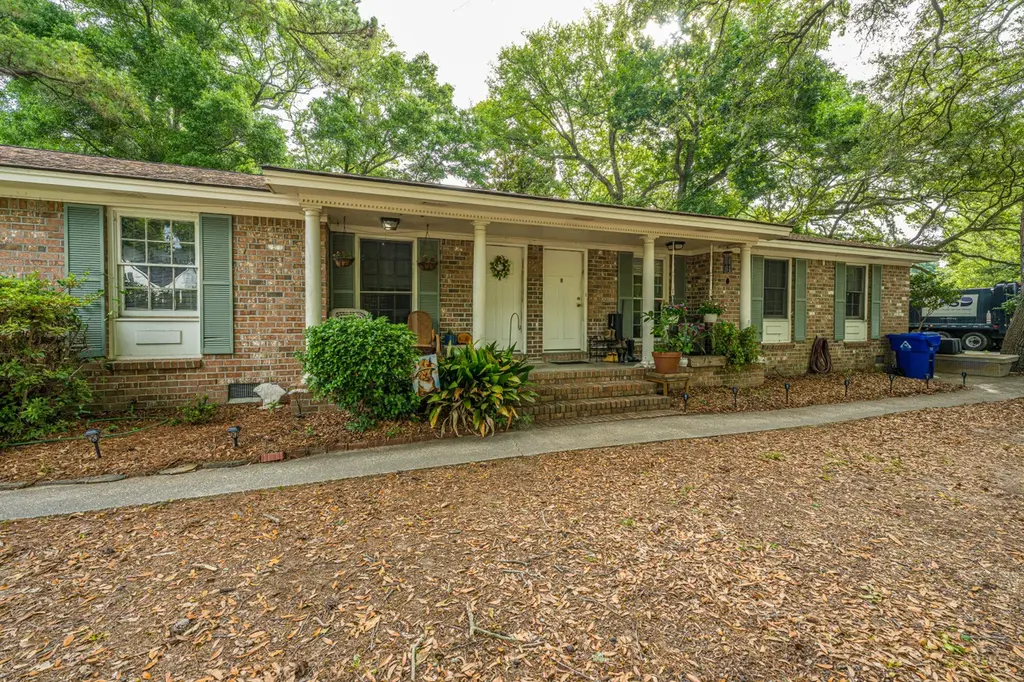
Listing remarks
Excellent investment opportunity in the highly desirable Clearview neighborhood on James Island. Located at 704 Marlin Lane, this well-positioned duplex offers strong rental income with both sides currently tenant occupied. Each unit features 3 bedrooms, 1 full bath, and approximately 1,100 square feet of living space, providing spacious layouts that appeal to long-term renters. Situated on a large . 4-acre lot, the property offers generous yard space, ample parking, and future upside in one of Charleston's most sought-after areas. Investors will love the unbeatable location -- just minutes to Downtown Charleston, MUSC, Folly Beach, shopping, dining, and everything James Island has to offer
Key facts
- Ample parking
- Large lot
- Generous yard space
Tags
Property features AI
Finance
- Financial info: 2 total units; Property marketed as residential income
Exterior
- Parking: Open parking; 2 parking spaces (2-car)
- Utilities: Public sewer; Electric service by Dominion Energy; Water service by James Island PSD
- Home design: Duplex (residential income); Ground-level entry; Located in the Clearview subdivision; James Island area
- Construction: Duplex structure
- Exterior features: Asphalt roof; No additional structures noted
Interior
- Kitchen: Dishwasher; Disposal; Electric cooktop
- Bedrooms: 6 bedrooms
- Bathrooms: 2 bathrooms
- Heating & cooling: Central heating (electric); Central air conditioning
- Interior features: Ceiling fans
- Laundry & utility: Tenants pay all utilities
Neighborhood map
What this means for you Summary
Snapshot
- This is a 2 × 3-bed/1.0-bath units multifamily listed at $600k.
Deal economics
- At list price, monthly cash flow is $866 ($10k/yr) — positive. Per door: $433/mo.
- The deal already cash-flows at list — no discount required.
- To meet the 1% rule (rent ≥ 1% of price), the offer needs to be $584k (2.7% below list).
- Recommended offer: $584k (2.7% below list) — sets the bar for 1% rule.
- Cap rate 8.0% vs local median 2.4% in James Island — top-decile yield for the area; either an underpriced asset or a hidden risk that comps aren't pricing in. Stress-test before assuming the spread holds.
Location & tenants
- Location reads 70/100 on livability (#64 in SC) — a middle-class / working-renter tenant base. Strengths: employment A+, housing A+, crime A; Watch: amenities F, commute F, cost of living F.
- Charleston 01 (urban): math 48% / reading 53% proficiency, ranked #7 of 80 in SC (top 9%) — acceptable for families but not a draw, mixed tenant base, ~2y average lease.
- Zoned schools: Stiles Point Elementary (math 74% / reading 71%, grade A, #24 of 597 statewide, top 4%, 817 students, 16% FRL); Camp Road Middle (math 50% / reading 57%, grade C+, #29 of 229 statewide, top 13%, 864 students, 38% FRL); James Island Charter High (math 73% / reading 89%, grade A, #21 of 196 statewide, top 11%, 1,589 students, 36% FRL, charter).
- Zoned-school proficiency averages 69% at this address vs 50% district-wide (+18 pts) — the actual schools serving this property are materially stronger than the Charleston 01 average implies; a family-tenant draw the district grade alone would hide.
- Market conditions: Rents rising (+2.1%/yr); 301 active listings in the ZIP; 4 comparable units currently listed for rent nearby; rentals at typical pace (median 21d on market — plan ~3-4 weeks tenant-placement turnaround); solid renter incomes; 4,156 units permitted in Charleston County in 2024 (857 in 5+ unit buildings).
- At $5,838/mo this rent would consume 69% of the median local household income ($102k/yr) (locally 1006% of renters already pay >50% of income on rent) — very limited rent-growth headroom before tenants either downsize or default.
Forward outlook
- Local home prices are declining (-3.0%/yr); year-one equity from $4k of loan paydown is wiped out by about $18k of value loss. Plan a longer hold.
- Charleston County population projected at +44% by 2050 — long-run rental-demand tailwind backs the buy-and-hold thesis.
Negotiation context
- It's been on market 16 days — a 2% lower offer ($591k) is reasonable based on typical stale-listing flexibility.
- Current owner paid $105k; list at $600k implies a 471% gain — meaningful room to come down on a strong offer.
Risks & watch-outs
- Climate carrying-cost: severe wind risk, 99% chance of damaging wind over 30y; extreme-heat days projected 7→19/yr by 2055 (HVAC capex compounding) — expect insurance premiums to compound above CPI over the hold.
Questions for the listing agent
- Can we see the unit-by-unit rent roll, current vacancy, and any below-market leases? What's the average tenancy length?
- What capital expenditures (roof, boiler, parking lot, exteriors) have been made in the last 5 years, and what's planned in the next 2?
- Built in 1975 — when were the roof, HVAC, electrical panel, plumbing, and water heater last replaced?
- Is there a deadline driving the sale (1031 exchange, divorce, estate, relocation)? That informs how much negotiation room exists.
- Schools are D-rated, which usually means shorter tenancies and higher turnover. Who's the typical renter profile here, and what's been the actual vacancy rate?
- What's the average days-on-market for RENTAL listings here right now (not sales)? A rising rental-DOM trend means longer vacancies and softer asking-rent achievability than the comps imply.
- What's the recent tenant-quality profile in this submarket — average credit score on applications, eviction rate, late-payment / NSF rate, and stable-employment percentage? A property-management company in the area should have these aggregated.
- How much new apartment / multifamily construction is in the pipeline within 1–3 miles? Heavy new supply (>2% of stock underway) typically softens rents 12–24 months out; light construction supports rent growth.
Investment metrics
- 1% rule
- 0.97% ✗
- Cap rate
- 8.03%
- Cash-on-cash
- 6.19%
- DSCR
- 1.28
- GRM
- 8.6
CMA / ARV
No comps found within radius.
Projected returns pro-forma
-3.0% appreciation · 2.06% rent growth · sell at horizon
- IRR
- -7.8%
- Equity multiple
- 0.72×
- Total profit
- $-47,677
- Equity at exit
- $89,462
- IRR
- 0.6%
- Equity multiple
- 1.04×
- Total profit
- $6,864
- Equity at exit
- $51,877
Cash invested: $168,000 (down + closing). Projections, not guarantees.
Landlord ↔ Tenant lean methodology
- Overall (STATE)
- 90 Strongly Landlord-Friendly
- State South Carolina
- 90 Strongly Landlord-Friendly · R+6
- County
- — inherits STATE
- City
- — inherits STATE
ZIP-level market 29412
- Rents YoY
- 2.1%
- Active inventory
- 301
- Price-to-rent
- 17.1×
Monthly cashflow live
- Estimated rent
- $5,838 high interval (Pro) →
- Mortgage (P&I)
- −$3,146
- Tax from tax record
- −$349 /mo · $4,191/yr
- Insurance
- −$250
- HOA
- −$0
- Vacancy / Maint / Mgmt
- −$1,226
- Net cashflow
- $866
Break-even live
2-unit breakdown (identical units grouped — click to expand)
| Units | Beds | Baths | Est. rent |
|---|---|---|---|
| 2× units | 3 | 1 | $5,838 |
| #1 | 3 | 1 | $2,919 |
| #2 | 3 | 1 | $2,919 |
| Total (2 units) | $5,838 | ||
UW: 25.0% down · 7.5% · 30yr · 1.5% tax · 5.0% vac · 8.0% maint · 8.0% mgmt
Financing live
Cash to close
- Down payment
- $150,000
- Closing costs
- $18,000
- Reserves months
- —
- Total cash needed
- —
Loan-product check · same deal, 3 products live
Conventional
25% down · 7.5% · 30yr
- Down + closing
- —
- Monthly P&I
- —
- Monthly cashflow
- —
- DSCR
- —
- Eligible?
- —
Personal DTI + credit; lowest rate.
DSCR
20% down · 8.5% · 30yr
- Down + closing
- —
- Monthly P&I
- —
- Monthly cashflow
- —
- DSCR
- —
- Eligible?
- —
No personal income docs; deal must DSCR.
Hard money
10% down · 12.0% · 12mo
- Down + closing
- —
- Monthly P&I
- —
- Monthly cashflow
- —
- DSCR
- —
- Eligible?
- —
Short-term bridge; refi at stabilization.
Rent comps 4 comps
| Address | Beds | Baths | Sqft | Rent | $/sqft | DOM | Units | Dist |
|---|---|---|---|---|---|---|---|---|
| 838 Fred St Charleston, SC | 3.0 | 2.0 | 1534 | $2,800 | $1.83 | 21d | 1 | 0.16mi |
| 729 Harbor View Rd Charleston, SC | 3.0 | 2.0 | 1500 | $3,021 | $2.01 | 21d | 1 | 0.24mi |
| 1129 Quail Dr Charleston, SC | 4.0 | 3.0 | 1475 | $5,200 | $3.53 | 23d | 1 | 1.17mi |
| 1213 Captain Rivers Dr Charleston, SC | 4.0 | 4.0 | 2954 | $5,500 | $1.86 | 18d | 1 | 1.42mi |
Listing history 12 events
-
2026-06-18days on market $600,000 Active 16 DOM
-
2026-06-17days on market $600,000 Active 15 DOM
-
2026-06-16days on market $600,000 Active 14 DOM
-
2026-06-15statusdays on market $600,000 Active 13 DOM
-
2026-06-10days on market $600,000 Active Under Contract 8 DOM
-
2026-06-09days on market $600,000 Active Under Contract 7 DOM
-
2026-06-08days on market $600,000 Active Under Contract 6 DOM
-
2026-06-07days on market $600,000 Active Under Contract 5 DOM
-
2026-06-05days on market $600,000 Active Under Contract 2 DOM
-
2026-06-03status $600,000 Active Under Contract 1 DOM
-
2026-06-03remarks 699-char remark
-
2026-06-03$600,000 Active 1 DOM
ⓘ Source: listings_history table (triggers on properties + properties_extension) + one-shot
backfill from property_details.listing_events for pre-trigger history.
Tax reassessment forecast SC · Resets to sale price
- Current annual tax
- $4,191 · $349/mo
- Projected year-2 tax
- $4,191 · $349/mo
- Expected delta
- $0/yr ($0/mo · 0.0%)
ⓘ Screening estimate from a state-policy table — verify with the county assessor before closing.
Climate risk First Street
- Flood 4/10 Moderate FEMA zone X (unshaded) · 13% chance over 30 yrs
- Wildfire 1/10 Low
- Heat 10/10 Extreme 7 d/yr ≥104°F today · 19 d/yr by 30 yrs out
- Wind 9/10 Extreme 99% chance of damaging wind over 30 yrs
- Air quality 3/10 Moderate 2 unhealthy d/yr today · 3 by 30 yrs out
Nearby sold comps map
Loading sold comps map…
Walkable amenities ~0.75 mi
Loading nearby amenities…
Taxation est. · year 1
- Rental income
- $70,056
- − Mortgage interest
- −$33,609
- − Property taxes
- −$4,191
- − Insurance
- −$3,000
- − Repairs & maintenance
- −$5,604
- − Management
- −$5,604
- − Depreciation
- −$17,455
- Taxable income
- $593
- Est. tax owed @ 24.0%
- −$142
- After-tax cash flow
- $10,254/yr
For passive investors: Depreciation is non-cash, so a rental often shows a tax loss while cash-flowing — sheltering income. Rental losses are passive: they offset passive income freely, and up to $25,000/yr can offset ordinary (W-2) income if you actively participate and your MAGI is under $100k (phasing out to $0 by $150k); unused losses carry forward. On sale, claimed depreciation is recaptured at up to 25%, and gains may owe capital-gains tax (a 1031 exchange can defer both). Figures are a year-1 estimate at your 24.0% rate — not tax advice; consult a CPA.
Schools (NCES district)
- District
- Charleston 01
- NCES district ID
- 4501440
- Math proficiency
- 48% ▼ -2.00%
- Reading proficiency
- 53% ▬ 0.00%
- Median HH income
- $52,376
- Composite
- 43.41/100
- National rank
- #3018
- State rank
- #7 of 80 in SC
Livability — James Island
- Score
- 70/100
- State rank
- #64
- US rank
- #7731
Category grades
Schools grade is shown separately in the Schools card above.
Census & demographics
- Census place
- James Island, SC
- County
- Charleston County · 366,793 people
- Metro
- Charleston-North Charleston, SC
- Population (ZIP)
- 39,256
- Household income
- $101,509
- Rent vs Own
- Severe rent burden
- 1006.0
Population outlook (Charleston County) Hauer SSP2
- Today (2025)
- 480,562 people
- By 2030
- 525,921 · +9.4%
- By 2040
- 612,189 · +27.4%
- By 2050
- 691,627 · +43.9%
- By 2075
- 847,979 · +76.5%
- By 2100
- 926,482 · +92.8%
Race, ethnicity, and origin ACS 2023
- Neighborhood character
- Predominantly White (74%)
- Race & ethnicity
- White 74% Black 16% Hispanic / Latino 5% Two or more races 4% Asian 2%
- Common ancestry
- Slovak 3% Italian 3% Lithuanian 2%
- Foreign-born
- 5% · Canada, China
- Languages at home
- 94% English-only · Spanish 3% French/Haitian/Cajun 1% Other Indo-European 1%
Political lean MEDSL · Charleston
- 2024 margin
- Lean D (+5.7) · D 51.9% · R 46.3% · Other 1.8%
- 2008→2024 swing
- -2.7pp toward R · 2008: 8.3pp · 2024: 5.7pp
- All cycles
- 2024: D+5.7 2020: D+12.9 2016: D+7.9 2012: D+2.4 2008: D+8.3
Not yet ingested
- Civics
- —
Market trends
- HPI YoY
- ▼ -564.80%
- Current HPI
- 400.0617
- Rent YoY
- ▲ 2.06%
- Metro
- Charleston-North Charleston, SC
- State GDP YoY
- ▲ 4.51%
- F500 in state
- 2
Industry mix (Fortune 500 HQ in SC)
| Industry | F500 HQs | Revenue |
|---|---|---|
| Packaging | 1 | $7B |
|
||
Price history
+638.7% since first listed3 events — show timeline
- 2026-06-02 Listed $600,000 Charleston Trident MLS
- 1996-10-25 Sold (Public Records) $105,000 Public Records
- 1989-08-21 Sold (Public Records) $81,220 Public Records
Property tax history
+2.7%/yrLatest (2022): $4,191 · +0.4% YoY. Source: county tax records.
Cash-flow waterfall
monthlySold comps — $/sqft
last 12 mo · ≤1 miLoading sold comps…