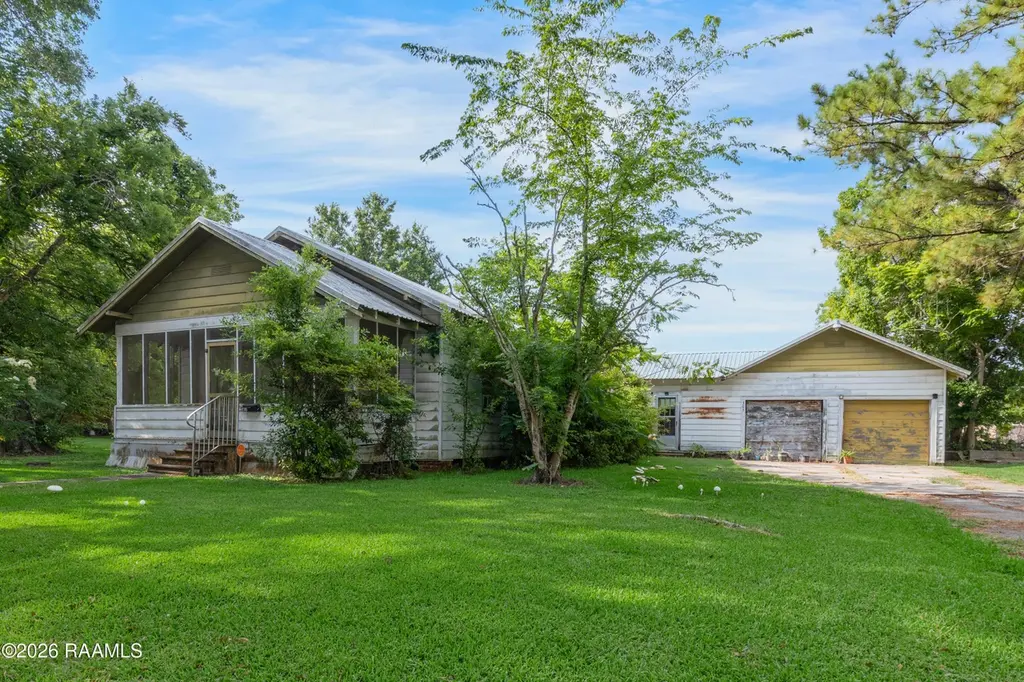
305 Hanson St · Franklin, LA
Flood risk 5/10 · Moderate
- FEMA flood zone
- X (unshaded)
- Chance of flooding over 30 yrs
- 0.14%
- Est. flood insurance / yr
- $507 – $1,088
Fire risk 1/10 · Minimal
- Est. fire insurance / yr
- $1,269 – $2,357
Heat risk 9/10 · Severe
- Hot days now (above 106°F)
- 7 days/yr
- Hot days in 30 yrs
- 23 days/yr
Wind risk 9/10 · Severe
- Chance of severe wind over 30 yrs
- 99.0%
Air-quality risk 1/10 · Minimal
- Unhealthy air days now
- 0 days/yr
- Unhealthy air days in 30 yrs
- 0 days/yr
Risk factors via First Street. Map © Google.
Why this score? — see what drove the B- grade
The composite is a weighted blend of 9 inputs, each scored 0–100. Each bar is that input's sub-score; the figure is the points it added to the 100-point composite (weight × sub-score).
- Cash flow +30.0/30.0
- 1% rule +10.0/10.0
- DSCR +10.0/10.0
- Appreciation +6.3/10.0
- Livability +3.4/5.0
- Schools +2.8/10.0
- Rent growth +2.5/5.0
- Condition / age +2.5/5.0
- ARV discount +0.0/15.0
$85,000
🖨 Deal sheet 📄 Offer letter ✓ Due diligence
Listing remarks
Opportunity awaits in Franklin! This charming home features 3 bedrooms, 1 bathroom, and a versatile flex space that can be used as a dining room, home office, or extra storage. Large windows throughout the home fill the space with beautiful natural light, while the kitchen, living room, and laundry room showcase warm pine walls that add character and charm. Outside, you'll find a two-car garage with an additional storage room attached to the back, plus a covered porch that is partially screened -- perfect for relaxing outdoors. The backyard is fully fenced with chain-link fencing, offering plenty of space for pets, play, or entertaining.
Key facts
- 0.5 acre lot
- 2 garage spots
- Listed 29 days
Property features AI
Exterior
- Parking: 2 parking spaces total; 2 covered spaces; Garage and open parking
- Utilities: Public sewer; Electric service: CLECO
- Home design: Single family residence; City street frontage on a paved road
- Construction: Aluminum and metal siding; Metal roof
- Exterior features: Partial chain-link fencing; Open screened porch; Attached garage structure noted
Interior
- Kitchen: Refrigerator; Gas stove/convection
- Flooring: Carpet; Laminate
- Bathrooms: 1 full bathroom
- Heating & cooling: Wall furnace heating; Wall units and multiple cooling units
- Interior features: Built-in features; Kitchen island; Solid surface counters
Neighborhood map
What this means for you Summary
Snapshot
- This is a 3-bed/1.0-bath single-family listed at $85k.
Deal economics
- At list price, monthly cash flow is $493 ($6k/yr) — positive.
- The deal already cash-flows at list — no discount required.
- Meets the 1% rule at list price ($1k rent vs $85k).
- Recommended offer: $84k (1.5% below list) — sets the bar for market timing.
- Cap rate 13.3% vs local median 6.2% in Franklin — top-decile yield for the area; either an underpriced asset or a hidden risk that comps aren't pricing in. Stress-test before assuming the spread holds.
Location & tenants
- Location reads 67/100 on livability (#107 in LA) — a middle-class / working-renter tenant base. Strengths: cost of living A+, housing A+, health & safety B+; Watch: crime F, amenities F, commute F.
- St. Mary Parish (town): math 28% / reading 39% proficiency, ranked #37 of 98 in LA (top 38%) — families likely to look elsewhere, expect single-tenant / working-renter base with shorter leases; 68% free/reduced lunch — lower-income household profile, screen leases tightly.
- Zoned schools: Franklin Junior High School (math 17% / reading 27%, grade F, #153 of 218 statewide, top 72%, 211 students, 88% FRL); Franklin Senior High School (math 5% / reading 37%, grade F, #179 of 265 statewide, top 68%, 297 students, 86% FRL) — zoned schools average 87% FRL vs 68% district-wide (19 pts higher); higher-poverty schools than district average — tighter screening recommended.
- Zoned-school proficiency averages 22% at this address vs 34% district-wide (-12 pts) — the specific schools serving this property underperform the St. Mary Parish average; the district grade overstates school quality for this exact location.
- Market conditions: 92 active listings in the ZIP; 37 units permitted in St. Mary Parish in 2024 (20 in 5+ unit buildings).
Forward outlook
- In year one you build about $3k of equity ($588 loan paydown + $2k appreciation (2.6% local appreciation)).
- St. Mary County population projected at -18% by 2050 — secular population decline; favor cash flow + early exit over multi-decade hold.
- At projected returns (2.6% appreciation + 3.0% rent growth), your $24k cash investment doubles in ~3 years — after that, you're playing with house money.
Negotiation context
- It's been on market 29 days — a 2% lower offer ($84k) is reasonable based on typical stale-listing flexibility.
- 5 sale attempts since 6y ago with the ask held roughly flat each time — persistent listings suggest the price (not the market) is what's stuck; bring a comps-based counter.
- Current owner paid $45k; list at $85k implies a 89% gain — meaningful room to come down on a strong offer.
Risks & watch-outs
- Climate carrying-cost: moderate flood risk; severe wind risk, 99% chance of damaging wind over 30y; extreme-heat days projected 7→23/yr by 2055 (HVAC capex compounding) — expect insurance premiums to compound above CPI over the hold.
Questions for the listing agent
- Is there a deadline driving the sale (1031 exchange, divorce, estate, relocation)? That informs how much negotiation room exists.
- Crime grade is F in this area — have there been break-ins, vandalism, or insurance claims at this property in the last 3 years? What carrier currently insures it and at what premium?
- What's the average days-on-market for RENTAL listings here right now (not sales)? A rising rental-DOM trend means longer vacancies and softer asking-rent achievability than the comps imply.
- What's the recent tenant-quality profile in this submarket — average credit score on applications, eviction rate, late-payment / NSF rate, and stable-employment percentage? A property-management company in the area should have these aggregated.
- How much new for-sale + rental construction is in the pipeline within 1–3 miles? Heavy new supply typically softens prices + rents 12–24 months out; constrained supply supports both.
Investment metrics
- 1% rule
- 1.51% ✓
- Cap rate
- 13.25%
- Cash-on-cash
- 24.86%
- DSCR
- 2.11
- GRM
- 5.5
CMA / ARV
- ARV (on-the-fly)
- $66,696
- Comps found
- 9
Show comp detail 9 sales within ~0.75 mi
| Address | Dist | Beds/Ba | Sqft | Sold | Price | $/sf | Match |
|---|---|---|---|---|---|---|---|
| 1016 West Third St | 0.09mi | 3/1.5 | 1,419 (-11%) | 6mo | $79,900 | $56 | 72 |
| 620 Iberia St | 0.22mi | 3/1.0 | 1,696 (+7%) | 14mo | $27,000 | $16 | 67 |
| 224 Sanders St | 0.27mi | 3/2.0 | 1,624 (+2%) | 19mo | $81,350 | $50 | 64 |
| 214 Hanson St | 0.07mi | 3/2.0 | 1,472 (-7%) | 23mo | $170,000 | $115 | 62 |
| 1013 Cayce St | 0.46mi | 3/2.0 | 1,516 (-4%) | 13mo | $105,000 | $69 | 56 |
| 806 Carl C Foulcard Dr | 0.62mi | 3/1.0 | 1,700 (+7%) | 4mo | $28,000 | $16 | 56 |
| 408 Sanders St | 0.41mi | 3/2.0 | 1,795 (+13%) | 12mo | $75,000 | $42 | 45 |
| 927 Tenth St | 0.54mi | 4/1.0 (+1) | 1,404 (-12%) | 22mo | $50,000 | $36 | 32 |
| 217 Morris St | 0.73mi | 3/2.0 | 1,796 (+13%) | 12mo | $76,000 | $42 | 30 |
Match score weights: distance 35% · size 25% · config 20% · recency 20%. Top-matched comps best support the ARV.
Projected returns pro-forma
2.56% appreciation · 3.0% rent growth · sell at horizon
- IRR
- 30.1%
- Equity multiple
- 2.67×
- Total profit
- $39,634
- Equity at exit
- $36,110
- IRR
- 30.9%
- Equity multiple
- 5.18×
- Total profit
- $99,587
- Equity at exit
- $54,062
Cash invested: $23,800 (down + closing). Projections, not guarantees.
Landlord ↔ Tenant lean methodology
- Overall (STATE)
- 90 Strongly Landlord-Friendly
- State Louisiana
- 90 Strongly Landlord-Friendly · R+12
- County
- — inherits STATE
- City
- — inherits STATE
ZIP-level market 70538
- Home prices YoY
- 3.2%
- Active inventory
- 92
- Price-to-rent
- 5.5×
Monthly cashflow live
- Estimated rent
- $1,286 medium interval (Pro) →
- Mortgage (P&I)
- −$446
- Tax from tax record
- −$42 /mo · $499/yr
- Insurance
- −$35
- HOA
- −$0
- Vacancy / Maint / Mgmt
- −$270
- Net cashflow
- $493
Break-even live
UW: 25.0% down · 7.5% · 30yr · 1.5% tax · 5.0% vac · 8.0% maint · 8.0% mgmt
Financing live
Cash to close
- Down payment
- $21,250
- Closing costs
- $2,550
- Reserves months
- —
- Total cash needed
- —
Loan-product check · same deal, 3 products live
Conventional
25% down · 7.5% · 30yr
- Down + closing
- —
- Monthly P&I
- —
- Monthly cashflow
- —
- DSCR
- —
- Eligible?
- —
Personal DTI + credit; lowest rate.
DSCR
20% down · 8.5% · 30yr
- Down + closing
- —
- Monthly P&I
- —
- Monthly cashflow
- —
- DSCR
- —
- Eligible?
- —
No personal income docs; deal must DSCR.
Hard money
10% down · 12.0% · 12mo
- Down + closing
- —
- Monthly P&I
- —
- Monthly cashflow
- —
- DSCR
- —
- Eligible?
- —
Short-term bridge; refi at stabilization.
Listing history 23 events
-
2026-06-18days on market $85,000 Active 29 DOM
-
2026-06-17days on market $85,000 Active 28 DOM
-
2026-06-16days on market $85,000 Active 27 DOM
-
2026-06-15days on market $85,000 Active 26 DOM
-
2026-06-13days on market $85,000 Active 24 DOM
-
2026-06-12days on market $85,000 Active 23 DOM
-
2026-06-09days on market $85,000 Active 20 DOM
-
2026-06-08days on market $85,000 Active 19 DOM
-
2026-06-07days on market $85,000 Active 18 DOM
-
2026-06-07days on market $85,000 Active 17 DOM
-
2026-06-04days on market $85,000 Active 14 DOM
-
2026-06-02days on market $85,000 Active 13 DOM
-
2026-06-01days on market $85,000 Active 12 DOM
-
2026-05-31days on market $85,000 Active 11 DOM
-
2026-05-31days on market $85,000 Active 10 DOM
-
2026-05-20$85,000 Active
-
2025-07-15price $80,000
-
2025-07-15price $80,000
-
2025-06-07$85,000 Active
-
2025-06-07$85,000 Active
-
2025-06-07$80,000 Active
-
2021-09-17soldstatus $45,000
-
2020-07-22$45,000
ⓘ Source: listings_history table (triggers on properties + properties_extension) + one-shot
backfill from property_details.listing_events for pre-trigger history.
Tax reassessment forecast LA · Resets to sale price
- Current annual tax
- $499 · $42/mo
- Projected year-2 tax
- $499 · $42/mo
- Expected delta
- $0/yr ($0/mo · 0.0%)
ⓘ Screening estimate from a state-policy table — verify with the county assessor before closing.
Climate risk First Street
- Flood 5/10 Major FEMA zone X (unshaded) · 14% chance over 30 yrs
- Wildfire 1/10 Low
- Heat 9/10 Extreme 7 d/yr ≥106°F today · 23 d/yr by 30 yrs out
- Wind 9/10 Extreme 99% chance of damaging wind over 30 yrs
- Air quality 1/10 Low 0 unhealthy d/yr today · 0 by 30 yrs out
Nearby sold comps map
Loading sold comps map…
Walkable amenities ~0.75 mi
Loading nearby amenities…
Taxation est. · year 1
- Rental income
- $15,429
- − Mortgage interest
- −$4,761
- − Property taxes
- −$499
- − Insurance
- −$425
- − Repairs & maintenance
- −$1,234
- − Management
- −$1,234
- − Depreciation
- −$2,473
- Taxable income
- $4,802
- Est. tax owed @ 24.0%
- −$1,153
- After-tax cash flow
- $4,763/yr
For passive investors: Depreciation is non-cash, so a rental often shows a tax loss while cash-flowing — sheltering income. Rental losses are passive: they offset passive income freely, and up to $25,000/yr can offset ordinary (W-2) income if you actively participate and your MAGI is under $100k (phasing out to $0 by $150k); unused losses carry forward. On sale, claimed depreciation is recaptured at up to 25%, and gains may owe capital-gains tax (a 1031 exchange can defer both). Figures are a year-1 estimate at your 24.0% rate — not tax advice; consult a CPA.
Schools (NCES district)
- District
- St. Mary Parish
- NCES district ID
- 2201620
- Math proficiency
- 28% ▼ -40.00%
- Reading proficiency
- 39% ▼ -33.00%
- Median HH income
- $39,843
- Composite
- 28.1/100
- National rank
- #6828
- State rank
- #37 of 98 in LA
Livability — Franklin
- Score
- 67/100
- State rank
- #107
- US rank
- #10368
Category grades
Schools grade is shown separately in the Schools card above.
Census & demographics
- Census place
- Franklin, LA
- Population (ZIP)
- 12,561
Population outlook (St. Mary County) Hauer SSP2
- Today (2025)
- 49,510 people
- By 2030
- 47,570 · -3.9%
- By 2040
- 43,880 · -11.4%
- By 2050
- 40,655 · -17.9%
- By 2075
- 37,190 · -24.9%
- By 2100
- 38,101 · -23.0%
Race, ethnicity, and origin ACS 2023
- Neighborhood character
- Diverse neighborhood (Simpson 0.60)
- Race & ethnicity
- White 48% Black 41% Two or more races 7% Hispanic / Latino 5% Native American 2%
- Hispanic origin (detail)
- Mexican 2%
- Common ancestry
- Lithuanian 8% Italian 1%
- Foreign-born
- 1% · Canada, Vietnam
- Languages at home
- 95% English-only · Spanish 4% French/Haitian/Cajun 1% Vietnamese 1%
Political lean MEDSL · St. Mary
- 2024 margin
- Solid R (+31.9) · D 33.5% · R 65.4% · Other 1.0%
- 2008→2024 swing
- -15.1pp toward R · 2008: -16.8pp · 2024: -31.9pp
- All cycles
- 2024: R+31.9 2020: R+29.1 2016: R+27.6 2012: R+18.8 2008: R+16.8
Not yet ingested
- Civics
- —
Market trends
- HPI YoY
- ▲ 2.56%
- Current HPI
- 82.9321
- Rent YoY
- —
- Metro
- —
- State GDP YoY
- ▲ 3.29%
- F500 in state
- 10
Industry mix (Fortune 500 HQ in LA)
| Industry | F500 HQs | Revenue |
|---|---|---|
| Telecommunications | 2 | $23B |
|
||
| Utilities | 1 | $12B |
|
||
| Wholesale / Distribution | 1 | $5B |
|
||
| Advertising | 1 | $2B |
|
||
Price history
+88.9% since first listed8 events — show timeline
- 2026-05-20 Listed $85,000 AcadianaMLS
- 2025-07-15 Price Changed $80,000 AcadianaMLS
- 2025-07-15 Price Changed $80,000 GBRMLS
- 2025-06-07 Listed $80,000 AcadianaMLS
- 2025-06-07 Listed $85,000 AcadianaMLS
- 2025-06-07 Listed $85,000 GBRMLS
- 2021-09-17 Sold (MLS) $45,000 AcadianaMLS
- 2020-07-22 Listed $45,000 AcadianaMLS
Property tax history
-1.0%/yrLatest (2025): $499 · +0.0% YoY. Source: county tax records.
Cash-flow waterfall
monthlySold comps — $/sqft
last 12 mo · ≤1 miLoading sold comps…