 🌊 Lakefront
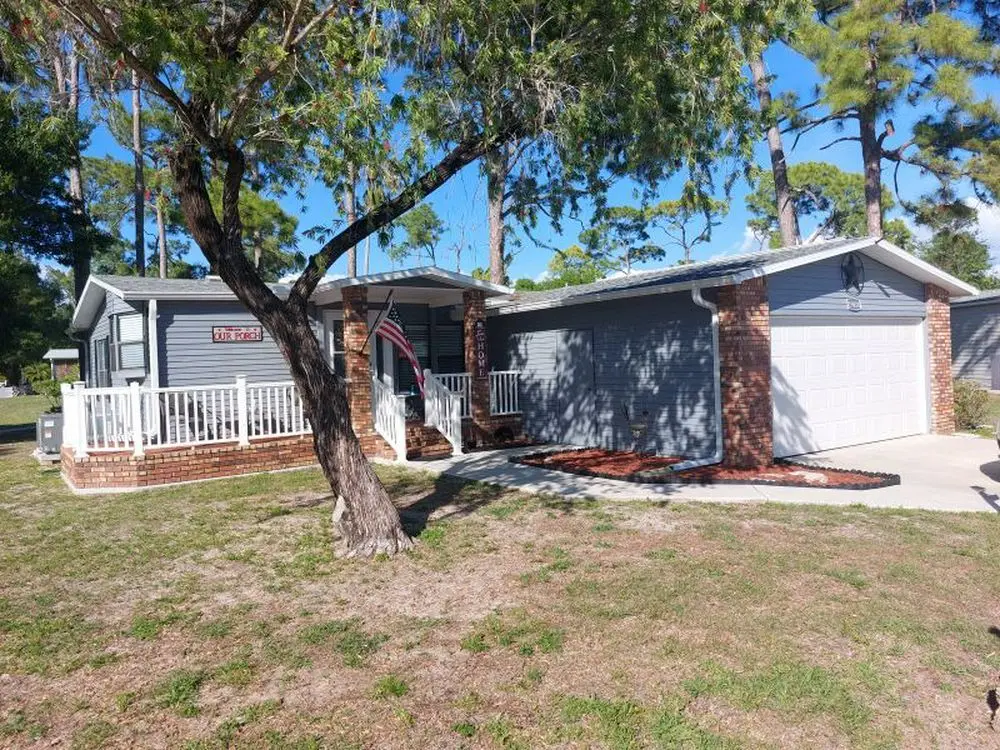
19418 Tarpon Woods Ct · North Fort Myers, FL
Flood risk No data
- FEMA flood zone
- —
- Chance of flooding over 30 yrs
- —
- Est. flood insurance / yr
- —
Fire risk No data
- Est. fire insurance / yr
- —
Heat risk No data
- Hot days now (above threshold)
- —
- Hot days in 30 yrs
- —
Wind risk No data
- Chance of severe wind over 30 yrs
- —
Air-quality risk No data
- Unhealthy air days now
- —
- Unhealthy air days in 30 yrs
- —
Risk factors via First Street. Map © Google.
Why this score? — see what drove the D grade
The composite is a weighted blend of 9 inputs, each scored 0–100. Each bar is that input's sub-score; the figure is the points it added to the 100-point composite (weight × sub-score).
- Cash flow +15.0/30.0
- ARV discount +7.5/15.0
- 1% rule +5.0/10.0
- DSCR +5.0/10.0
- Schools +4.1/10.0
- Livability +3.7/5.0
- Condition / age +2.5/5.0
- Rent growth +2.0/5.0
- Appreciation +0.0/10.0
$20,000
🖨 Deal sheet 📄 Offer letter ✓ Due diligence
Listing remarks
Exceptional Value. Seller is Moving Due to Job Relocation Discover the ultimate Florida lifestyle in this beautifully updated, move-in-ready 2-bedroom, 2-bathroom manufactured home located in the highly desirable Pine Lakes Country Club age-qualified gated community. Boasting 1,496 sq. ft. of pristine living space (includes a 200 sq. ft. conditioned flex room), this partially furnished home features premium vinyl flooring throughout and a modern, cohesive design. Home Highlights: Gourmet Updates: Fully updated kitchen and bathrooms, both featuring sleek walk-in showers. Versatile Flex Space: The enclosed lanai is equipped with a mini-split AC and a closet perfect for a 3rd bedroom, home
Key facts
- Extended front porch
- Private yard space
- Updated bathrooms
Tags
Neighborhood map
What this means for you Summary
Snapshot
- This is a 2-bed/2.0-bath single-family listed at $20k.
Deal economics
- At list price, monthly cash flow is $1k ($17k/yr) — positive.
- The deal already cash-flows at list — no discount required.
- Meets the 1% rule at list price ($2k rent vs $20k).
- Cap rate 93.2% vs local median 3.6% in North Fort Myers — top-decile yield for the area; either an underpriced asset or a hidden risk that comps aren't pricing in. Stress-test before assuming the spread holds.
Location & tenants
- Location reads 74/100 on livability (#269 in FL, #4,409 nationally) — a middle-class / working-renter tenant base. Strengths: cost of living A+, housing A+, health & safety A+; Watch: employment C-, amenities F, commute F.
- Lee (suburban): math 47% / reading 50% proficiency, ranked #42 of 73 in FL (top 58%) — families likely to look elsewhere, expect single-tenant / working-renter base with shorter leases.
- Market conditions: Rents soft (-1.9%/yr); 472 active listings in the ZIP; 22 comparable units currently listed for rent nearby; rentals at typical pace (median 19d on market — plan ~3-4 weeks tenant-placement turnaround); 15,411 units permitted in Lee County in 2024 (4,686 in 5+ unit buildings).
- This rent runs 42% of the median local income ($57k/yr) — at the standard rent-burdened threshold; future hikes will face affordability resistance.
Forward outlook
- Local home prices are declining (-3.0%/yr); year-one equity from $138 of loan paydown is wiped out by about $600 of value loss. Plan a longer hold.
- Lee County population projected at +44% by 2050 — long-run rental-demand tailwind backs the buy-and-hold thesis.
- At projected returns (-3.0% appreciation + 0.0% rent growth), your $6k cash investment doubles in ~1 year — after that, you're playing with house money.
Negotiation context
- Only 13 days on market — expect competitive offers; lowballing is unlikely to land.
Questions for the listing agent
- Is there a deadline driving the sale (1031 exchange, divorce, estate, relocation)? That informs how much negotiation room exists.
- The area grade is low — what's the realistic commute time and amenity access for the typical tenant pool here? Any planned neighborhood developments (good or bad) we should know about?
- This sits on a lake — are riparian / water-frontage rights deeded with the parcel? Any dock permits, shoreline easements, or HOA water-use restrictions?
- What's the documented flood / surge / shoreline-erosion history here (FEMA AND non-FEMA — e.g., storm surge, creek backup, septic-field saturation)?
- Any water-quality or seasonal algae-bloom issues that affect tenant satisfaction or short-term-rental demand?
- What's the average days-on-market for RENTAL listings here right now (not sales)? A rising rental-DOM trend means longer vacancies and softer asking-rent achievability than the comps imply.
- What's the recent tenant-quality profile in this submarket — average credit score on applications, eviction rate, late-payment / NSF rate, and stable-employment percentage? A property-management company in the area should have these aggregated.
- How much new for-sale + rental construction is in the pipeline within 1–3 miles? Heavy new supply typically softens prices + rents 12–24 months out; constrained supply supports both.
Investment metrics
- 1% rule
- 10.04% ✓
- Cap rate
- 93.20%
- Cash-on-cash
- 310.38%
- DSCR
- 14.81
- GRM
- 0.8
CMA / ARV
No comps found within radius.
Projected returns pro-forma
-3.0% appreciation · 0.0% rent growth · sell at horizon
- IRR
- —
- Equity multiple
- 15.85×
- Total profit
- $83,156
- Equity at exit
- $2,982
- IRR
- —
- Equity multiple
- 31.10×
- Total profit
- $168,576
- Equity at exit
- $1,729
Cash invested: $5,600 (down + closing). Projections, not guarantees.
Landlord ↔ Tenant lean methodology
- Overall (STATE)
- 87 Strongly Landlord-Friendly
- State Florida
- 87 Strongly Landlord-Friendly · R+3
- County
- — inherits STATE
- City
- — inherits STATE
ZIP-level market 33903
- Rents YoY
- -1.9%
- Active inventory
- 472
- Price-to-rent
- 0.8×
Monthly cashflow live
- Estimated rent
- $2,008 high interval (Pro) →
- Mortgage (P&I)
- −$105
- Tax est. 1.5%
- −$25 /mo · $300/yr
- Insurance
- −$8
- HOA
- −$0
- Vacancy / Maint / Mgmt
- −$422
- Net cashflow
- $1,448
Break-even live
UW: 25.0% down · 7.5% · 30yr · 1.5% tax · 5.0% vac · 8.0% maint · 8.0% mgmt
Financing live
Cash to close
- Down payment
- $5,000
- Closing costs
- $600
- Reserves months
- —
- Total cash needed
- —
Loan-product check · same deal, 3 products live
Conventional
25% down · 7.5% · 30yr
- Down + closing
- —
- Monthly P&I
- —
- Monthly cashflow
- —
- DSCR
- —
- Eligible?
- —
Personal DTI + credit; lowest rate.
DSCR
20% down · 8.5% · 30yr
- Down + closing
- —
- Monthly P&I
- —
- Monthly cashflow
- —
- DSCR
- —
- Eligible?
- —
No personal income docs; deal must DSCR.
Hard money
10% down · 12.0% · 12mo
- Down + closing
- —
- Monthly P&I
- —
- Monthly cashflow
- —
- DSCR
- —
- Eligible?
- —
Short-term bridge; refi at stabilization.
Rent comps 22 comps
| Address | Beds | Baths | Sqft | Rent | $/sqft | DOM | Units | Dist |
|---|---|---|---|---|---|---|---|---|
| 10401 Circle Pine Rd North Fort Myers, FL | 2.0 | 2.0 | 1294 | $3,000 | $2.32 | 23d | 1 | 0.07mi |
| 19621 N Tamiami Trl North Fort Myers, FL | 3.0 | 2.0 | 1205 | $1,300 | $1.08 | 23d | 1 | 0.14mi |
| 19477 Bermuda Ct North Fort Myers, FL | 3.0 | 2.0 | 1460 | $1,499 | $1.03 | 1d | 1 | 0.16mi |
| 19421 Bermuda Ct North Fort Myers, FL | 3.0 | 2.0 | 1198 | $1,499 | $1.25 | 1d | 1 | 0.19mi |
| 19414 Bermuda Ct North Fort Myers, FL | 3.0 | 2.0 | 1251 | $1,499 | $1.20 | 1d | 1 | 0.21mi |
| 19152 Meadowbrook Ct North Fort Myers, FL | 3.0 | 2.0 | 1251 | $1,499 | $1.20 | 1d | 1 | 0.44mi |
| 20038 Fiddlewood Ave North Fort Myers, FL | 3.0 | 2.0 | 1519 | $1,999 | $1.32 | 19d | 1 | 0.71mi |
| 20056 Sweetbay Dr North Fort Myers, FL | 3.0 | 2.0 | 1672 | $4,000 | $2.39 | 23d | 1 | 0.86mi |
| 1701 NE 44th Ter Cape Coral, FL | 3.0 | 2.0 | 1147 | $1,800 | $1.57 | 13d | 1 | 0.97mi |
| 1701 NE 44th Ter Cape Coral, FL | 3.0 | 2.0 | 1147 | $1,800 | $1.57 | 15d | 1 | 0.97mi |
| 4215 E Gator Cir Cape Coral, FL | 3.0 | 2.0 | 1385 | $1,725 | $1.25 | 3d | 1 | 1.00mi |
| 4036 Avenue Del Tura North Fort Myers, FL | 2.0 | 2.0 | 1568 | $1,950 | $1.24 | 23d | 1 | 1.04mi |
| 4421 NE 15th Pl Cape Coral, FL | 3.0 | 2.0 | 1240 | $2,000 | $1.61 | 23d | 1 | 1.06mi |
| 20559 Long Pond Rd North Fort Myers, FL | 3.0 | 2.0 | 1805 | $2,295 | $1.27 | 23d | 1 | 1.07mi |
| 2117 NE 40th St Cape Coral, FL | 3.0 | 3.0 | 1776 | $2,100 | $1.18 | 15d | 1 | 1.16mi |
| 1900 Corona del Sire Dr North Fort Myers, FL | 2.0 | 2.0 | 1449 | $2,400 | $1.66 | 23d | 1 | 1.26mi |
| 4125 NE 15th Pl Cape Coral, FL | 3.0 | 2.0 | 1556 | $2,000 | $1.29 | 23d | 1 | 1.27mi |
| 1670 Palo Duro Blvd North Fort Myers, FL | 2.0 | 2.0 | 1604 | $2,700 | $1.68 | 3d | 1 | 1.28mi |
| 2130 Rio Nuevo Dr Unit 1546442P North Fort Myers, FL | 2.0 | 2.0 | 1248 | $4,682 | $3.75 | 14d | 1 | 1.38mi |
| 20919 Villareal Way North Fort Myers, FL | 2.0 | 2.0 | 1428 | $4,000 | $2.80 | 23d | 1 | 1.41mi |
| 2481 Palo Duro Blvd North Fort Myers, FL | 3.0 | 2.0 | 1450 | $4,000 | $2.76 | 21d | 1 | 1.46mi |
| 2481 Palo Duro Blvd North Fort Myers, FL | 3.0 | 2.0 | 1450 | $4,000 | $2.76 | 15d | 1 | 1.46mi |
Listing history 7 events
-
2026-06-17days on market $20,000 Active 13 DOM
-
2026-06-16days on market $20,000 Active 12 DOM
-
2026-06-16days on market $20,000 Active 11 DOM
-
2026-06-13days on market $20,000 Active 9 DOM
-
2026-06-09days on market $20,000 Active 5 DOM
-
2026-06-07remarks 699-char remark
-
2026-06-07$20,000 Active 3 DOM
ⓘ Source: listings_history table (triggers on properties + properties_extension) + one-shot
backfill from property_details.listing_events for pre-trigger history.
Nearby sold comps map
Loading sold comps map…
Walkable amenities ~0.75 mi
Loading nearby amenities…
Taxation est. · year 1
- Rental income
- $24,101
- − Mortgage interest
- −$1,120
- − Property taxes
- −$300
- − Insurance
- −$100
- − Repairs & maintenance
- −$1,928
- − Management
- −$1,928
- − Depreciation
- −$582
- Taxable income
- $18,143
- Est. tax owed @ 24.0%
- −$4,354
- After-tax cash flow
- $13,027/yr
For passive investors: Depreciation is non-cash, so a rental often shows a tax loss while cash-flowing — sheltering income. Rental losses are passive: they offset passive income freely, and up to $25,000/yr can offset ordinary (W-2) income if you actively participate and your MAGI is under $100k (phasing out to $0 by $150k); unused losses carry forward. On sale, claimed depreciation is recaptured at up to 25%, and gains may owe capital-gains tax (a 1031 exchange can defer both). Figures are a year-1 estimate at your 24.0% rate — not tax advice; consult a CPA.
Schools (NCES district)
- District
- Lee
- NCES district ID
- 1201080
- Math proficiency
- 47% ▼ -11.00%
- Reading proficiency
- 50% ▼ -4.00%
- Median HH income
- $49,518
- Composite
- 41.49/100
- National rank
- #3458
- State rank
- #42 of 73 in FL
Livability — North Fort Myers
- Score
- 74/100
- State rank
- #269
- US rank
- #4409
Category grades
Schools grade is shown separately in the Schools card above.
Census & demographics
- Census place
- North Fort Myers, FL
- County
- Lee County · 788,662 people
- City population
- 57,035
- Metro
- Cape Coral-Fort Myers, FL
- Population (ZIP)
- 23,655
- Household income
- $56,993
- Rent vs Own
- Severe rent burden
- 468.0
Population outlook (Lee County) Hauer SSP2
- Today (2025)
- 871,946 people
- By 2030
- 955,468 · +9.6%
- By 2040
- 1,113,587 · +27.7%
- By 2050
- 1,256,891 · +44.1%
- By 2075
- 1,560,270 · +78.9%
- By 2100
- 1,726,848 · +98.0%
Race, ethnicity, and origin ACS 2023
- Neighborhood character
- Predominantly White (81%)
- Race & ethnicity
- White 81% Hispanic / Latino 14% Two or more races 8% Black 2%
- Hispanic origin (detail)
- Mexican 3% Puerto Rican 3% Cuban 3%
- Common ancestry
- Lithuanian 4% Romanian 4% Italian 3%
- Foreign-born
- 11% · Canada
- Languages at home
- 88% English-only · Spanish 9% Other Indo-European 1%
Political lean MEDSL · Lee
- 2024 margin
- Strong R (+28.4) · D 35.5% · R 63.9%
- 2008→2024 swing
- -18.0pp toward R · 2008: -10.4pp · 2024: -28.4pp
- All cycles
- 2024: R+28.4 2020: R+19.2 2016: R+20.4 2012: R+16.6 2008: R+10.4
Not yet ingested
- Civics
- —
Market trends
- HPI YoY
- ▼ -172.26%
- Current HPI
- 256.773
- Rent YoY
- ▼ -1.94%
- Metro
- Cape Coral-Fort Myers, FL
- State GDP YoY
- ▲ 3.28%
- F500 in state
- 36
Industry mix (Fortune 500 HQ in FL)
| Industry | F500 HQs | Revenue |
|---|---|---|
| Industrial Technology | 2 | $29B |
|
||
| Insurance | 2 | $17B |
|
||
| Retail | 1 | $60B |
|
||
| Technology Distribution | 1 | $58B |
|
||
| Homebuilding | 1 | $35B |
|
||
| Technology Manufacturing | 1 | $35B |
|
||
Price history
-13.0% since first listed2 events — show timeline
- 2026-06-06 Price Changed $20,000 ForSaleByOwner.com
- 2026-06-04 Listed $23,000 ForSaleByOwner.com
Cash-flow waterfall
monthlySold comps — $/sqft
last 12 mo · ≤1 miLoading sold comps…