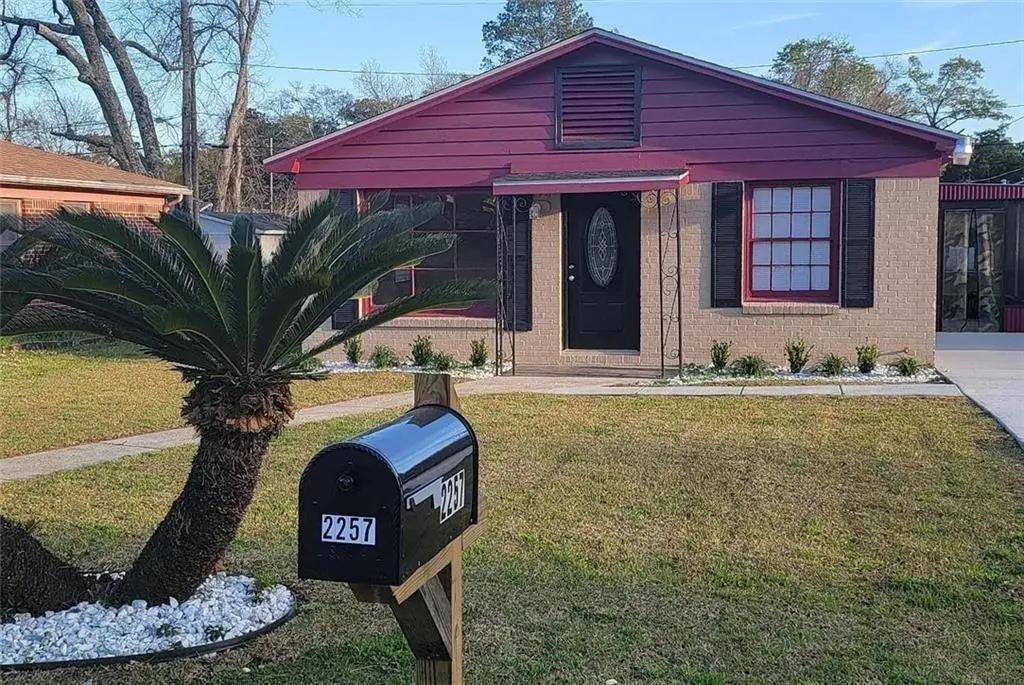
2257 Roberta Dr · Mobile, AL
Flood risk 4/10 · Minor
- FEMA flood zone
- X (unshaded)
- Chance of flooding over 30 yrs
- 0.22%
- Est. flood insurance / yr
- $507 – $1,088
Fire risk 1/10 · Minimal
- Est. fire insurance / yr
- $916 – $1,700
Heat risk 9/10 · Severe
- Hot days now (above 104°F)
- 7 days/yr
- Hot days in 30 yrs
- 21 days/yr
Wind risk 9/10 · Severe
- Chance of severe wind over 30 yrs
- 99.0%
Air-quality risk 2/10 · Minimal
- Unhealthy air days now
- 1 days/yr
- Unhealthy air days in 30 yrs
- 1 days/yr
Risk factors via First Street. Map © Google.
Why this score? — see what drove the C+ grade
The composite is a weighted blend of 9 inputs, each scored 0–100. Each bar is that input's sub-score; the figure is the points it added to the 100-point composite (weight × sub-score).
- Cash flow +25.2/30.0
- DSCR +8.3/10.0
- ARV discount +7.5/15.0
- Appreciation +7.4/10.0
- 1% rule +5.5/10.0
- Livability +3.8/5.0
- Rent growth +2.5/5.0
- Condition / age +2.5/5.0
- Schools +2.3/10.0
$134,900
🖨 Deal sheet 📄 Offer letter ✓ Due diligence
Listing remarks
2257 Roberta Drive Mobile, AL 36617 must see home. This property is centrally located near local hospitals, shopping, and entertainment. Easy interstate access is available. This spacious home features 3 bedrooms and 2 bathrooms with 1,344 square feet. As bonus, this home offers a large private den that could be used as a bedroom or second living room. This home features large rooms and a nice yard, perfect for family get togethers. This home is perfect for a first-time home buyer or investor. This home is priced to sell fast. Please allow notice before showing this property is occupied. The home is currently tenant occupied. Tenant is at the end of the lease agreement. Buyer to verify all
Key facts
- Centrally located
- Large private den
- Nice yard
Tags
Property features AI
Exterior
- Parking: Driveway with space for 2 vehicles
- Utilities: Cable available; Electricity available (110V and 220V); Phone available; Public sewer; Water available
- Home design: Single-family residence; Residential property
- Construction: Brick 4 sides; Shingle roof; Built in 1986; Concrete perimeter and slab foundation; Wood frame windows
- Exterior features: Storage; Fenced yard; View
Interior
- Kitchen: Eat-in kitchen
- Bedrooms: 3 bedrooms
- Flooring: Hardwood; Laminate
- Bathrooms: 2 full bathrooms
- Heating & cooling: Central heating; Central air conditioning
- Interior features: Other
- Laundry & utility: Other
Neighborhood map
What this means for you Summary
Snapshot
- This is a 3-bed/2.0-bath single-family listed at $135k.
Deal economics
- At list price, monthly cash flow is $302 ($4k/yr) — positive.
- The deal already cash-flows at list — no discount required.
- Meets the 1% rule at list price ($1k rent vs $135k).
- Recommended offer: $131k (3.0% below list) — sets the bar for market timing.
- Cap rate 9.0% vs local median 4.9% in Mobile — top-decile yield for the area; either an underpriced asset or a hidden risk that comps aren't pricing in. Stress-test before assuming the spread holds.
Location & tenants
- Location reads 75/100 on livability (#20 in AL, #4,262 nationally) — a middle-class / working-renter tenant base. Strengths: commute A+, cost of living A+, housing A+; Watch: crime F, employment D-.
- Mobile County (urban): math 15% / reading 39% proficiency, ranked #81 of 129 in AL (top 63%) — low school quality limits family demand, transient renter base, plan for 1-2y turnover; 67% free/reduced lunch — lower-income household profile, screen leases tightly.
- Zoned schools: Holloway Elementary (math 5% / reading 19%, grade F, #554 of 627 statewide, top 88%, 498 students, 98% FRL); John L Leflore Magnet School (math 2% / reading 2%, grade F, #291 of 305 statewide, top 100%, 618 students, 84% FRL) — zoned schools average 91% FRL vs 67% district-wide (23 pts higher); higher-poverty schools than district average — tighter screening recommended.
- Zoned-school proficiency averages 7% at this address vs 27% district-wide (-20 pts) — the specific schools serving this property underperform the Mobile County average; the district grade overstates school quality for this exact location.
- Market conditions: 40 active listings in the ZIP; 16 comparable units currently listed for rent nearby; rentals at typical pace (median 21d on market — plan ~3-4 weeks tenant-placement turnaround); 1,678 units permitted in Mobile County in 2024 (264 in 5+ unit buildings).
Forward outlook
- In year one you build about $7k of equity ($933 loan paydown + $6k appreciation (4.8% local appreciation)).
- Mobile County population projected to shrink 8% by 2050 — rents likely to lag national; underwrite the cash flow, not the appreciation.
- At projected returns (4.8% appreciation + 3.0% rent growth), your $38k cash investment doubles in ~4 years — after that, you're playing with house money.
- By year 5, paydown + projected appreciation supports a ~$32k cash-out refi (75% LTV) — recoverable capital for the next deal without selling this one.
Negotiation context
- It's been on market 43 days — a 3% lower offer ($131k) is reasonable based on typical stale-listing flexibility.
- Current owner paid $62k; list at $135k implies a 118% gain — meaningful room to come down on a strong offer.
Risks & watch-outs
- Climate carrying-cost: severe wind risk, 99% chance of damaging wind over 30y; extreme-heat days projected 7→21/yr by 2055 (HVAC capex compounding) — expect insurance premiums to compound above CPI over the hold.
Questions for the listing agent
- It's been on market 43 days. Have you received any prior offers? Is the seller open to a 3% concession, seller financing, or rate buy-down credit?
- Is there a deadline driving the sale (1031 exchange, divorce, estate, relocation)? That informs how much negotiation room exists.
- Schools are D-rated, which usually means shorter tenancies and higher turnover. Who's the typical renter profile here, and what's been the actual vacancy rate?
- Crime grade is F in this area — have there been break-ins, vandalism, or insurance claims at this property in the last 3 years? What carrier currently insures it and at what premium?
- What's the average days-on-market for RENTAL listings here right now (not sales)? A rising rental-DOM trend means longer vacancies and softer asking-rent achievability than the comps imply.
- What's the recent tenant-quality profile in this submarket — average credit score on applications, eviction rate, late-payment / NSF rate, and stable-employment percentage? A property-management company in the area should have these aggregated.
- How much new for-sale + rental construction is in the pipeline within 1–3 miles? Heavy new supply typically softens prices + rents 12–24 months out; constrained supply supports both.
Investment metrics
- 1% rule
- 1.05% ✓
- Cap rate
- 8.98%
- Cash-on-cash
- 9.59%
- DSCR
- 1.43
- GRM
- 7.9
CMA / ARV
- ARV (median comp)
- $57,925
- List price
- $134,900
- Delta
- 132.89%
- Verdict
- OVERPRICED
- Comps
- 20 within 1.0 mi
Show comp detail 12 sales within ~0.75 mi
| Address | Dist | Beds/Ba | Sqft | Sold | Price | $/sf | Match |
|---|---|---|---|---|---|---|---|
| 2211 Barlow St | 0.12mi | 3/2.0 | 1,392 (+4%) | 2mo | $24,000 | $17 | 86 |
| 2302 Roosevelt St | 0.28mi | 3/2.0 | 1,404 (+4%) | 7mo | $47,000 | $33 | 74 |
| 421 Chavers St | 0.37mi | 3/2.0 | 1,208 (-10%) | 2mo | $71,500 | $59 | 64 |
| 2666 Betbeze St | 0.55mi | 4/2.0 (+1) | 1,429 (+6%) | 5mo | $19,900 | $14 | 55 |
| 292 Siena Vis | 0.61mi | 3/2.0 | 1,416 (+5%) | 10mo | $169,000 | $119 | 55 |
| 619 Caton Ave | 0.54mi | 3/1.0 | 1,296 (-4%) | 15mo | $60,000 | $46 | 52 |
| 1854 St Stephens Ct | 0.68mi | 4/2.0 (+1) | 1,350 (+0%) | 14mo | $148,000 | $110 | 51 |
| 2014 Clinton St | 0.69mi | 3/1.5 | 1,264 (-6%) | 13mo | $125,000 | $99 | 45 |
| 2203 Rosa Dr | 0.66mi | 3/1.0 | 1,171 (-13%) | 0mo | $160,500 | $137 | 44 |
| 1856 Nabers Dr | 0.69mi | 3/1.0 | 1,414 (+5%) | 16mo | $100,000 | $71 | 42 |
| 687 Welworth St | 0.60mi | 3/1.0 | 1,534 (+14%) | 11mo | $129,900 | $85 | 36 |
| 2507 Myrtle St | 0.74mi | 2/1.0 (-1) | 1,150 (-14%) | 4mo | $169,500 | $147 | 29 |
Match score weights: distance 35% · size 25% · config 20% · recency 20%. Top-matched comps best support the ARV.
Projected returns pro-forma
4.78% appreciation · 3.0% rent growth · sell at horizon
- IRR
- 20.6%
- Equity multiple
- 2.29×
- Total profit
- $48,549
- Equity at exit
- $74,625
- IRR
- 20.4%
- Equity multiple
- 4.47×
- Total profit
- $130,908
- Equity at exit
- $127,311
Cash invested: $37,772 (down + closing). Projections, not guarantees.
Landlord ↔ Tenant lean methodology
- Overall (STATE)
- 90 Strongly Landlord-Friendly
- State Alabama
- 90 Strongly Landlord-Friendly · R+15
- County
- — inherits STATE
- City
- — inherits STATE
ZIP-level market 36617
- Home prices YoY
- 3.9%
- Active inventory
- 40
- Price-to-rent
- 7.9×
Monthly cashflow live
- Estimated rent
- $1,415 high interval (Pro) →
- Mortgage (P&I)
- −$707
- Tax from tax record
- −$52 /mo · $626/yr
- Insurance
- −$56
- HOA
- −$0
- Vacancy / Maint / Mgmt
- −$297
- Net cashflow
- $302
Break-even live
UW: 25.0% down · 7.5% · 30yr · 1.5% tax · 5.0% vac · 8.0% maint · 8.0% mgmt
Financing live
Cash to close
- Down payment
- $33,725
- Closing costs
- $4,047
- Reserves months
- —
- Total cash needed
- —
Loan-product check · same deal, 3 products live
Conventional
25% down · 7.5% · 30yr
- Down + closing
- —
- Monthly P&I
- —
- Monthly cashflow
- —
- DSCR
- —
- Eligible?
- —
Personal DTI + credit; lowest rate.
DSCR
20% down · 8.5% · 30yr
- Down + closing
- —
- Monthly P&I
- —
- Monthly cashflow
- —
- DSCR
- —
- Eligible?
- —
No personal income docs; deal must DSCR.
Hard money
10% down · 12.0% · 12mo
- Down + closing
- —
- Monthly P&I
- —
- Monthly cashflow
- —
- DSCR
- —
- Eligible?
- —
Short-term bridge; refi at stabilization.
Rent comps 16 comps
| Address | Beds | Baths | Sqft | Rent | $/sqft | DOM | Units | Dist |
|---|---|---|---|---|---|---|---|---|
| 423 Devon Dr Mobile, AL | 3.0 | 1.0 | 1220 | $950 | $0.78 | 43d | 1 | 0.21mi |
| 402 Havens St Mobile, AL | 4.0 | 2.0 | 960 | $1,350 | $1.41 | 13d | 1 | 0.38mi |
| 510 Schwartz St Mobile, AL | 3.0 | 2.0 | 1288 | $1,400 | $1.09 | 13d | 1 | 0.44mi |
| 2007 Allison St Unit 1 Mobile, AL | 3.0 | 2.0 | 1805 | $1,575 | $0.87 | 43d | 1 | 0.55mi |
| 186 Stanton Rd Mobile, AL | 1.0–3.0 | 1.0–2.5 | 1263 | $2,450 | $1.94 | 43d | 1 | 0.81mi |
| 305 Indian Creek Dr E Unit 1043809P Mobile, AL | 3.0 | 2.5 | 1496 | $3,985 | $2.66 | 13d | 1 | 0.89mi |
| 1821 Seale St Mobile, AL | 4.0 | 2.0 | 1584 | $1,400 | $0.88 | 21d | 1 | 1.03mi |
| 107 Grand Blvd Mobile, AL | 2.0 | 2.0 | 1200 | $1,295 | $1.08 | 21d | 1 | 1.06mi |
| 672 Burden St Mobile, AL | 3.0 | 1.5 | 1421 | $1,300 | $0.91 | 21d | 1 | 1.08mi |
| 708 Bond St Mobile, AL | 3.0 | 1.0 | 1100 | $1,350 | $1.23 | 21d | 1 | 1.17mi |
| 129 Shell Road Pl Unit 1043713P Mobile, AL | 4.0 | 2.0 | 1496 | $3,389 | $2.27 | 21d | 1 | 1.19mi |
| 156 Hemley Ave Mobile, AL | 3.0 | 1.0 | 936 | $1,195 | $1.28 | 43d | 1 | 1.23mi |
| 2604 Dauphin St #210 Mobile, AL | 2.0 | 1.0 | 950 | $1,150 | $1.21 | 21d | 1 | 1.28mi |
| 2604 Dauphin St Mobile, AL | 2.0 | 1.0 | 950 | $1,072 | $1.13 | 43d | 2 | 1.28mi |
| 2500 Dauphinwood Dr Mobile, AL | 2.0–3.0 | 1.0–2.0 | 1250 | $1,395 | $1.12 | 13d | 19 | 1.39mi |
| 104 Ellinor St Mobile, AL | 2.0 | 1.0 | 896 | $1,275 | $1.42 | 21d | 1 | 1.48mi |
Listing history 18 events
-
2026-06-18days on market $134,900 Active 43 DOM
-
2026-06-17days on market $134,900 Active 42 DOM
-
2026-06-16days on market $134,900 Active 41 DOM
-
2026-06-15days on market $134,900 Active 40 DOM
-
2026-06-14days on market $134,900 Active 38 DOM
-
2026-06-13days on market $134,900 Active 37 DOM
-
2026-06-10days on market $134,900 Active 35 DOM
-
2026-06-09days on market $134,900 Active 34 DOM
-
2026-06-08days on market $134,900 Active 33 DOM
-
2026-06-07days on market $134,900 Active 32 DOM
-
2026-06-05days on market $134,900 Active 29 DOM
-
2026-06-03days on market $134,900 Active 28 DOM
-
2026-06-02days on market $134,900 Active 27 DOM
-
2026-06-01days on market $134,900 Active 26 DOM
-
2026-05-31days on market $134,900 Active 25 DOM
-
2026-05-30days on market $134,900 Active 24 DOM
-
2026-05-06$134,900 Active 753-char remark
-
2010-10-08soldstatus $62,000
ⓘ Source: listings_history table (triggers on properties + properties_extension) + one-shot
backfill from property_details.listing_events for pre-trigger history.
Tax reassessment forecast AL · Resets to sale price
- Current annual tax
- $626 · $52/mo
- Projected year-2 tax
- $626 · $52/mo
- Expected delta
- $0/yr ($0/mo · 0.0%)
ⓘ Screening estimate from a state-policy table — verify with the county assessor before closing.
Climate risk First Street
- Flood 4/10 Moderate FEMA zone X (unshaded) · 22% chance over 30 yrs
- Wildfire 1/10 Low
- Heat 9/10 Extreme 7 d/yr ≥104°F today · 21 d/yr by 30 yrs out
- Wind 9/10 Extreme 99% chance of damaging wind over 30 yrs
- Air quality 2/10 Low 1 unhealthy d/yr today · 1 by 30 yrs out
Nearby sold comps map
Loading sold comps map…
Walkable amenities ~0.75 mi
Loading nearby amenities…
Taxation est. · year 1
- Rental income
- $16,976
- − Mortgage interest
- −$7,556
- − Property taxes
- −$626
- − Insurance
- −$674
- − Repairs & maintenance
- −$1,358
- − Management
- −$1,358
- − Depreciation
- −$3,924
- Taxable income
- $1,478
- Est. tax owed @ 24.0%
- −$355
- After-tax cash flow
- $3,266/yr
For passive investors: Depreciation is non-cash, so a rental often shows a tax loss while cash-flowing — sheltering income. Rental losses are passive: they offset passive income freely, and up to $25,000/yr can offset ordinary (W-2) income if you actively participate and your MAGI is under $100k (phasing out to $0 by $150k); unused losses carry forward. On sale, claimed depreciation is recaptured at up to 25%, and gains may owe capital-gains tax (a 1031 exchange can defer both). Figures are a year-1 estimate at your 24.0% rate — not tax advice; consult a CPA.
Schools (NCES district)
- District
- Mobile County
- NCES district ID
- 0102370
- Math proficiency
- 15% ▼ -28.00%
- Reading proficiency
- 39% ▬ 0.00%
- Median HH income
- $42,455
- Composite
- 22.9/100
- National rank
- #8002
- State rank
- #81 of 129 in AL
Livability — Mobile
- Score
- 75/100
- State rank
- #20
- US rank
- #4262
Category grades
Schools grade is shown separately in the Schools card above.
Census & demographics
- Census place
- Mobile, AL
- City population
- 205,729
- Population (ZIP)
- 11,952
Population outlook (Mobile County) Hauer SSP2
- Today (2025)
- 415,303 people
- By 2030
- 411,755 · -0.9%
- By 2040
- 399,670 · -3.8%
- By 2050
- 382,616 · -7.9%
- By 2075
- 337,353 · -18.8%
- By 2100
- 283,391 · -31.8%
Race, ethnicity, and origin ACS 2023
- Neighborhood character
- Predominantly Black (97%)
- Race & ethnicity
- Black 97% White 2%
- Foreign-born
- 0%
Political lean MEDSL · Mobile
- 2024 margin
- R (+16.4) · D 41.3% · R 57.7%
- 2008→2024 swing
- -7.7pp toward R · 2008: -8.7pp · 2024: -16.4pp
- All cycles
- 2024: R+16.4 2020: R+11.9 2016: R+13.9 2012: R+9.3 2008: R+8.7
Not yet ingested
- Civics
- —
Market trends
- HPI YoY
- ▲ 4.78%
- Current HPI
- 128.8377
- Rent YoY
- —
- Metro
- —
- State GDP YoY
- ▲ 2.94%
- F500 in state
- 4
Industry mix (Fortune 500 HQ in AL)
| Industry | F500 HQs | Revenue |
|---|---|---|
| Financial Services | 1 | $8B |
|
||
| Healthcare | 1 | $5B |
|
||
Price history
+117.6% since first listed2 events — show timeline
- 2026-05-06 Listed $134,900 GCMLS AL
- 2010-10-08 Sold (Public Records) $62,000 Public Records
Property tax history
+8.1%/yrLatest (2025): $626 · +0.0% YoY. Source: county tax records.
Cash-flow waterfall
monthlySold comps — $/sqft
last 12 mo · ≤1 miLoading sold comps…