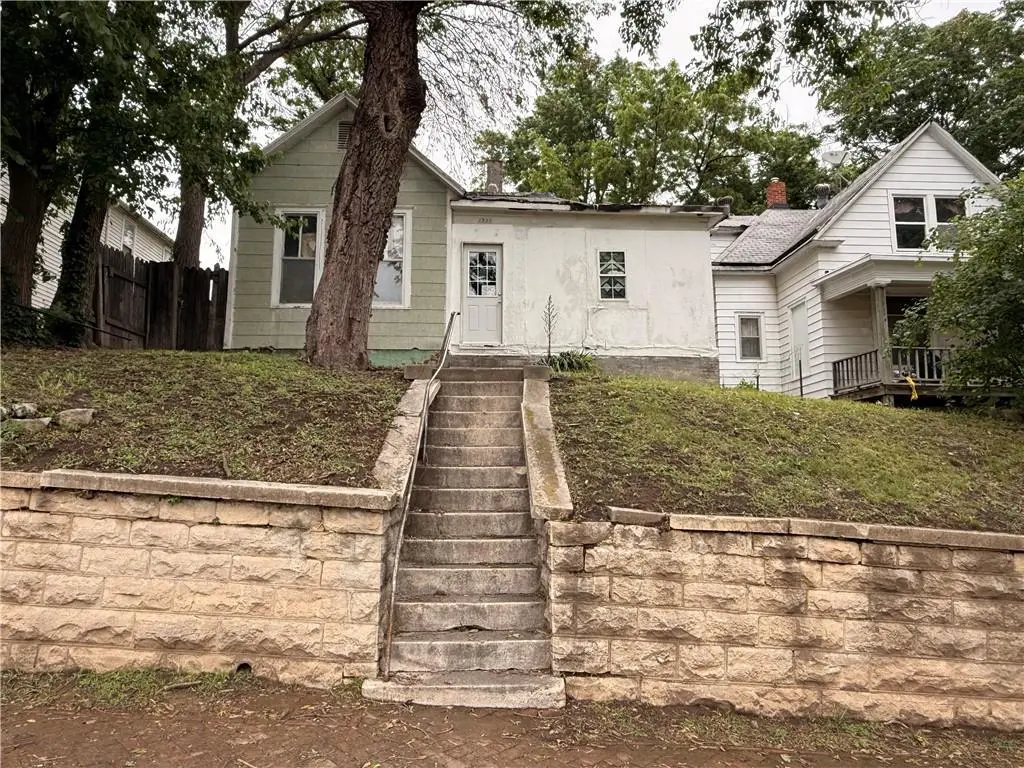
1921 Jones St · St. Joseph, MO
Flood risk 1/10 · Minimal
- FEMA flood zone
- X
- Chance of flooding over 30 yrs
- 0.0%
- Est. flood insurance / yr
- $473 – $860
Fire risk 1/10 · Minimal
- Est. fire insurance / yr
- $1,054 – $1,958
Heat risk 4/10 · Minor
- Hot days now (above 106°F)
- 7 days/yr
- Hot days in 30 yrs
- 16 days/yr
Wind risk 2/10 · Minimal
- Chance of severe wind over 30 yrs
- —
Air-quality risk 2/10 · Minimal
- Unhealthy air days now
- 1 days/yr
- Unhealthy air days in 30 yrs
- 1 days/yr
Risk factors via First Street. Map © Google.
Why this score? — see what drove the B- grade
The composite is a weighted blend of 9 inputs, each scored 0–100. Each bar is that input's sub-score; the figure is the points it added to the 100-point composite (weight × sub-score).
- Cash flow +30.0/30.0
- 1% rule +10.0/10.0
- DSCR +10.0/10.0
- ARV discount +7.5/15.0
- Schools +2.8/10.0
- Rent growth +2.5/5.0
- Livability +2.5/5.0
- Condition / age +2.5/5.0
- Appreciation +0.0/10.0
$30,000
🖨 Deal sheet (PDF) 📄 Offer letter ✓ Due diligence
Listing remarks
This home features 2 bedrooms, 1 bathroom, all level living. This property is a project property that would be perfect for someone looking to make it their own, use as a flip property or an investor who wants to add it to their investment portfolio.
Key facts
- 5,320 sq ft lot
- Built 1912
- Listed 2 days
Property features AI
Finance
- HOA & community: No association fees
Exterior
- Parking: Off-street parking
- Utilities: Public water; Public sewer
- Home design: Single-family residence; Residential property; Bungalow; Living area listed as 980 (above grade)
- Construction: Asbestos construction materials; Composition roof; Property is over 100 years old
- Exterior features: Lot approximately 5,320 square feet
Interior
- Kitchen: Kitchen on the main level
- Bedrooms: 2 bedrooms on the main level
- Bathrooms: 1 full bathroom on the main level
- Heating & cooling: Natural gas heating; Electric cooling (has cooling)
- Interior features: Bungalow floor plan; Unfinished basement
Neighborhood map
What this means for you Summary
Snapshot
- This is a 2-bed/1.0-bath single-family listed at $30k.
Deal economics
- At list price, monthly cash flow is $511 ($6k/yr) — positive.
- The deal already cash-flows at list — no discount required.
- Meets the 1% rule at list price ($897 rent vs $30k).
- Cap rate 26.7% vs local median 4.7% in St. Joseph — top-decile yield for the area; either an underpriced asset or a hidden risk that comps aren't pricing in. Stress-test before assuming the spread holds.
Location & tenants
- Location reads: area grade B — affects rentability + tenant quality, not the cash-flow math above.
- St. Joseph (urban): math 28% / reading 38% proficiency, ranked #241 of 324 in MO (top 74%) — families likely to look elsewhere, expect single-tenant / working-renter base with shorter leases.
- Zoned schools: Coleman Elem. (math 27% / reading 37%, grade F, #761 of 1,115 statewide, top 72%, 349 students, 99% FRL); Robidoux Middle (math 19% / reading 28%, grade F, #328 of 391 statewide, top 84%, 390 students, 99% FRL); Lafayette High (math 16% / reading 47%, grade F, #371 of 521 statewide, top 71%, 717 students, 100% FRL) — zoned schools average 99% FRL vs 53% district-wide (47 pts higher); higher-poverty schools than district average — tighter screening recommended.
- Market conditions: 97 active listings in the ZIP; 12 comparable units currently listed for rent nearby; rentals lingering (median 46d on market — plan ~5-8 weeks vacancy on turnover, expect pricing pressure); 100% of comp listings sitting > 30 days — soft ceiling on asking rent; 70 units permitted in Buchanan County in 2024 (0 in 5+ unit buildings).
Forward outlook
- Local home prices are declining (-3.0%/yr); year-one equity from $207 of loan paydown is wiped out by about $900 of value loss. Plan a longer hold.
- Buchanan County population projected to shrink 6% by 2050 — rents likely to lag national; underwrite the cash flow, not the appreciation.
- At projected returns (-3.0% appreciation + 3.0% rent growth), your $8k cash investment doubles in ~2 years — after that, you're playing with house money.
Negotiation context
- Only 2 days on market — expect competitive offers; lowballing is unlikely to land.
Risks & watch-outs
- Watch-outs: built in 1912 — expect roof / HVAC / electrical / plumbing capex.
Questions for the listing agent
- Built in 1912 — when were the roof, HVAC, electrical panel, plumbing, and water heater last replaced?
- Is there a deadline driving the sale (1031 exchange, divorce, estate, relocation)? That informs how much negotiation room exists.
- What's the average days-on-market for RENTAL listings here right now (not sales)? A rising rental-DOM trend means longer vacancies and softer asking-rent achievability than the comps imply.
- What's the recent tenant-quality profile in this submarket — average credit score on applications, eviction rate, late-payment / NSF rate, and stable-employment percentage? A property-management company in the area should have these aggregated.
- How much new for-sale + rental construction is in the pipeline within 1–3 miles? Heavy new supply typically softens prices + rents 12–24 months out; constrained supply supports both.
Investment metrics
- 1% rule
- 2.99% ✓
- Cap rate
- 26.72%
- Cash-on-cash
- 72.97%
- DSCR
- 4.25
- GRM
- 2.8
CMA / ARV
- ARV (on-the-fly)
- $118,580
- Comps found
- 12
Show comp detail 12 sales within ~0.75 mi
| Address | Dist | Beds/Ba | Sqft | Sold | Price | $/sf | Match |
|---|---|---|---|---|---|---|---|
| 1921 Jones St | 0.00mi | 2/1.0 | 980 (0%) | 0mo | $30,000 | $31 | 100 |
| 1901 Jones St | 0.04mi | 2/1.0 | 1,018 (+4%) | 5mo | $120,000 | $118 | 88 |
| 1912 Holman St | 0.18mi | 3/1.0 (+1) | 955 (-3%) | 8mo | $99,000 | $104 | 76 |
| 1607 Grand Ave | 0.48mi | 3/1.0 (+1) | 961 (-2%) | 2mo | $100,000 | $104 | 68 |
| 1521 N 15th St | 0.46mi | 2/1.0 | 912 (-7%) | 5mo | $169,900 | $186 | 63 |
| 1015 Corby St | 0.60mi | 2/1.0 | 1,028 (+5%) | 3mo | $75,000 | $73 | 61 |
| 1806 N 22nd St | 0.52mi | 2/1.0 | 1,068 (+9%) | 0mo | $123,900 | $116 | 60 |
| 1308 N 10th St | 0.65mi | 2/1.0 | 936 (-4%) | 7mo | $150,000 | $160 | 56 |
| 415 N 26th St | 0.61mi | 2/1.0 | 864 (-12%) | 2mo | $139,900 | $162 | 50 |
| 705 N 9 St | 0.75mi | 2/1.0 | 1,032 (+5%) | 7mo | $124,900 | $121 | 50 |
| 2234 Felix St | 0.68mi | 3/1.5 (+1) | 912 (-7%) | 3mo | $115,000 | $126 | 47 |
| 605 N 12th St | 0.58mi | 3/1.0 (+1) | 1,116 (+14%) | 0mo | $135,000 | $121 | 44 |
Match score weights: distance 35% · size 25% · config 20% · recency 20%. Top-matched comps best support the ARV.
Projected returns pro-forma
-3.0% appreciation · 3.0% rent growth · sell at horizon
- IRR
- 72.7%
- Equity multiple
- 4.30×
- Total profit
- $27,679
- Equity at exit
- $4,473
- IRR
- 76.6%
- Equity multiple
- 8.86×
- Total profit
- $66,026
- Equity at exit
- $2,594
Cash invested: $8,400 (down + closing). Projections, not guarantees.
Landlord ↔ Tenant lean methodology
- Overall (STATE)
- 81 Strongly Landlord-Friendly
- State Missouri
- 81 Strongly Landlord-Friendly · R+10
- County
- — inherits STATE
- City
- — inherits STATE
ZIP-level market 64501
- Active inventory
- 97
- Price-to-rent
- 2.8×
Monthly cashflow live
- Estimated rent
- $897 high interval (Pro) →
- Mortgage (P&I)
- −$157
- Tax from tax record
- −$28 /mo · $340/yr
- Insurance
- −$12
- HOA
- −$0
- Vacancy / Maint / Mgmt
- −$188
- Net cashflow
- $511
Break-even live
Sensitivity live
| Price | -10% $528 | -5% $519 | +0% $511 | +5% $502 | +10% $494 |
|---|---|---|---|---|---|
| Rent | -10% $440 | -5% $475 | +0% $511 | +5% $546 | +10% $582 |
| Rate | -1.0pp $526 | -0.5pp $518 | base $511 | +0.5pp $503 | +1.0pp $495 |
UW: 25.0% down · 7.5% · 30yr · 1.5% tax · 5.0% vac · 8.0% maint · 8.0% mgmt
Financing live
Cash to close
- Down payment
- $7,500
- Closing costs
- $900
- Reserves months
- —
- Total cash needed
- —
Loan-product check · same deal, 3 products live
Conventional
25% down · 7.5% · 30yr
- Down + closing
- —
- Monthly P&I
- —
- Monthly cashflow
- —
- DSCR
- —
- Eligible?
- —
Personal DTI + credit; lowest rate.
DSCR
20% down · 8.5% · 30yr
- Down + closing
- —
- Monthly P&I
- —
- Monthly cashflow
- —
- DSCR
- —
- Eligible?
- —
No personal income docs; deal must DSCR.
Hard money
10% down · 12.0% · 12mo
- Down + closing
- —
- Monthly P&I
- —
- Monthly cashflow
- —
- DSCR
- —
- Eligible?
- —
Short-term bridge; refi at stabilization.
Rent comps 12 comps
| Address | Beds | Baths | Sqft | Rent | $/sqft | DOM | Units | Dist |
|---|---|---|---|---|---|---|---|---|
| 917 N 24th St Unit 1 St Joseph, MO | 2.0 | 1.0 | 933 | $925 | $0.99 | 45d | 1 | 0.24mi |
| 425 N 25th St St Joseph, MO | 2.0 | 1.0 | 800 | $850 | $1.06 | 45d | 1 | 0.52mi |
| 2408 Jules St Saint Joseph, MO | 2.0 | 1.0 | 1032 | $1,100 | $1.07 | 45d | 1 | 0.60mi |
| 2901 Frederick Ave Saint Joseph, MO | 2.0–3.0 | 1.0 | 900 | $835 | $0.93 | 45d | 1 | 0.75mi |
| 1015 Faraon St St Joseph, MO | 1.0 | 1.0 | 743 | $820 | $1.10 | 45d | 1 | 0.76mi |
| 516 N 10th St Saint Joseph, MO | 1.0–2.0 | 1.0 | 700 | $900 | $1.29 | 45d | 1 | 0.76mi |
| 809 Hall St Unit B St Joseph, MO | 1.0 | 1.0 | 750 | $850 | $1.13 | 45d | 1 | 0.81mi |
| 303 S 13th St St Joseph, MO | 3.0 | 1.5 | 1000 | $950 | $0.95 | 45d | 1 | 0.88mi |
| 201 S 10th St Saint Joseph, MO | 2.0 | 1.0 | 600 | $1,000 | $1.67 | 45d | 1 | 0.96mi |
| 1416 N 3rd St Unit 1418 St Joseph, MO | 2.0 | 1.0 | 750 | $850 | $1.13 | 45d | 1 | 1.13mi |
| 1106 Olive St Saint Joseph, MO | 2.0 | 1.0 | 700 | $725 | $1.04 | 45d | 1 | 1.31mi |
| 3128 Midland St Saint Joseph, MO | 2.0 | 1.0 | 1104 | $975 | $0.88 | 45d | 1 | 1.36mi |
Listing history 4 events
-
2026-06-07status $30,000 Pending 2 DOM
-
2026-06-03days on market $30,000 Active 2 DOM
-
2026-06-02remarks 249-char remark
-
2026-06-02$30,000 Active 1 DOM
ⓘ Source: listings_history table (triggers on properties + properties_extension) + one-shot
backfill from property_details.listing_events for pre-trigger history.
Tax reassessment forecast MO · Resets to sale price
- Current annual tax
- $340 · $28/mo
- Projected year-2 tax
- $340 · $28/mo
- Expected delta
- $0/yr ($0/mo · 0.0%)
ⓘ Screening estimate from a state-policy table — verify with the county assessor before closing.
Climate risk First Street
- Flood 1/10 Low FEMA zone X · 0% chance over 30 yrs
- Wildfire 1/10 Low
- Heat 4/10 Moderate 7 d/yr ≥106°F today · 16 d/yr by 30 yrs out
- Wind 2/10 Low
- Air quality 2/10 Low 1 unhealthy d/yr today · 1 by 30 yrs out
Nearby sold comps map
Loading sold comps map…
Walkable amenities ~0.75 mi
Loading nearby amenities…
Taxation est. · year 1
- Rental income
- $10,769
- − Mortgage interest
- −$1,680
- − Property taxes
- −$340
- − Insurance
- −$150
- − Repairs & maintenance
- −$862
- − Management
- −$862
- − Depreciation
- −$873
- Taxable income
- $6,003
- Est. tax owed @ 24.0%
- −$1,441
- After-tax cash flow
- $4,689/yr
For passive investors: Depreciation is non-cash, so a rental often shows a tax loss while cash-flowing — sheltering income. Rental losses are passive: they offset passive income freely, and up to $25,000/yr can offset ordinary (W-2) income if you actively participate and your MAGI is under $100k (phasing out to $0 by $150k); unused losses carry forward. On sale, claimed depreciation is recaptured at up to 25%, and gains may owe capital-gains tax (a 1031 exchange can defer both). Figures are a year-1 estimate at your 24.0% rate — not tax advice; consult a CPA.
Schools (NCES district)
- District
- St. Joseph
- NCES district ID
- 2927060
- Math proficiency
- 28% ▼ -6.00%
- Reading proficiency
- 38% ▼ -1.00%
- Median HH income
- $43,007
- Composite
- 27.99/100
- National rank
- #6853
- State rank
- #241 of 324 in MO
Livability — St. Joseph
No livability data for this city. (Only ~50 U.S. cities are tracked.)
Census & demographics
- Census place
- St. Joseph, MO
- County
- Buchanan County · 32,150 people
- City population
- 44,382
- Metro
- St. Joseph, MO-KS
- Population (ZIP)
- 10,689
- Household income
- $46,731
- Rent vs Own
- Severe rent burden
- 721.0
Population outlook (Buchanan County) Hauer SSP2
- Today (2025)
- 89,041 people
- By 2030
- 88,401 · -0.7%
- By 2040
- 86,220 · -3.2%
- By 2050
- 83,603 · -6.1%
- By 2075
- 76,750 · -13.8%
- By 2100
- 67,623 · -24.1%
Race, ethnicity, and origin ACS 2023
- Neighborhood character
- Predominantly White (69%)
- Race & ethnicity
- White 69% Black 12% Hispanic / Latino 11% Two or more races 9%
- Hispanic origin (detail)
- Mexican 6% Puerto Rican 1%
- Common ancestry
- Italian 3% Romanian 1% Slovak 1%
- Foreign-born
- 7% · Canada, China
- Languages at home
- 89% English-only · Spanish 7% Arabic 1%
Political lean MEDSL · Buchanan
- 2024 margin
- Strong R (+28.0) · D 35.2% · R 63.3% · Other 1.5%
- 2008→2024 swing
- -28.2pp toward R · 2008: 0.1pp · 2024: -28.0pp
- All cycles
- 2024: R+28.0 2020: R+24.6 2016: R+26.2 2012: R+8.7 2008: D+0.1
Not yet ingested
- Civics
- —
Market trends
- HPI YoY
- ▼ -150.20%
- Current HPI
- 157.8706
- Rent YoY
- —
- Metro
- St. Joseph, MO-KS
- State GDP YoY
- ▲ 1.84%
- F500 in state
- 20
Industry mix (Fortune 500 HQ in MO)
| Industry | F500 HQs | Revenue |
|---|---|---|
| Healthcare | 1 | $163B |
|
||
| Insurance | 1 | $21B |
|
||
| Industrial Technology | 1 | $17B |
|
||
| Retail | 1 | $16B |
|
||
| Industrial Distribution | 1 | $10B |
|
||
| Utilities | 1 | $9B |
|
||
Price history
3 events — show timeline
- 2026-06-01 Listed $30,000 Heartland MLS as Distributed by MLS Grid
- 2011-09-28 Sold (Public Records) — Public Records
- 1991-11-25 Sold (Public Records) — Public Records
Property tax history
+1.4%/yrLatest (2025): $340 · +4.9% YoY. Source: county tax records.
Cash-flow waterfall
monthlySold comps — $/sqft
last 12 mo · ≤1 miLoading sold comps…