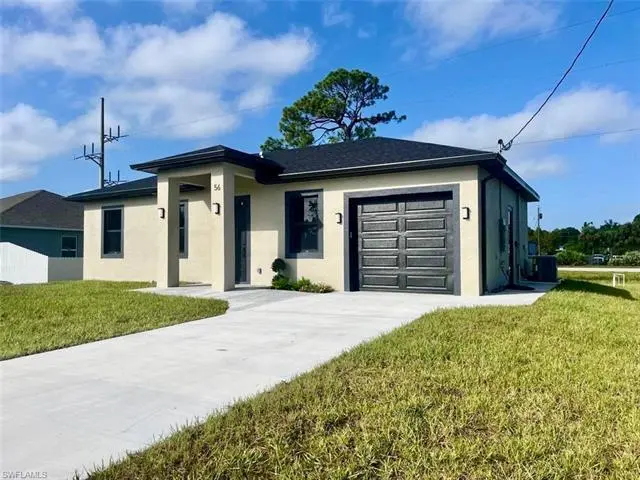
56 Floyd Ave S · Lehigh Acres, FL
Flood risk 5/10 · Moderate
- FEMA flood zone
- X (unshaded)
- Chance of flooding over 30 yrs
- 0.67%
- Est. flood insurance / yr
- $507 – $1,088
Fire risk 2/10 · Minimal
- Est. fire insurance / yr
- $947 – $1,759
Heat risk 10/10 · Severe
- Hot days now (above 107°F)
- 7 days/yr
- Hot days in 30 yrs
- 29 days/yr
Wind risk 10/10 · Severe
- Chance of severe wind over 30 yrs
- 99.0%
Air-quality risk 2/10 · Minimal
- Unhealthy air days now
- 1 days/yr
- Unhealthy air days in 30 yrs
- 1 days/yr
Risk factors via First Street. Map © Google.
Why this score? — see what drove the D- grade
The composite is a weighted blend of 9 inputs, each scored 0–100. Each bar is that input's sub-score; the figure is the points it added to the 100-point composite (weight × sub-score).
- Appreciation +10.0/10.0
- ARV discount +7.5/15.0
- Cash flow +6.1/30.0
- Schools +4.1/10.0
- Livability +3.0/5.0
- Condition / age +2.5/5.0
- Rent growth +2.1/5.0
- 1% rule +1.4/10.0
- DSCR +0.4/10.0
$279,000
🖨 Deal sheet 📄 Offer letter ✓ Due diligence
Listing remarks MLS
The land boasts a prime location with easy access to major roads, endless possibilities for development. Agents please view confidential remarks.
Key facts
- Modern design
- Centrally located
- Upgraded finishes
Tags
Property features AI
Finance
- Other: Property located in Lehigh Acres development; Zoning: RS-1; Lot is regular; total area noted from architectural plans
- HOA & community: No HOA maintenance; No community amenities; Community type: See remarks
Exterior
- Parking: Attached garage; 1 assigned parking space; 1 garage space
- Security: Impact-resistant doors and windows
- Utilities: Well water with filter; Septic system; Natural gas available; Cable available
- Home design: Single-family residential; 1 story (ranch); Rear exposure facing south
- Construction: Concrete block construction; Built in 2025
- Exterior features: Stucco exterior; Impact resistant windows; Impact resistant doors; Shingle roof; Landscaped area view
Interior
- Kitchen: Island kitchen; Pantry; Dishwasher; Disposal; Self-cleaning oven; Microwave; Refrigerator
- Bedrooms: 3 bedrooms
- Flooring: Tile
- Bathrooms: 3 full bathrooms; Master bath with shower (no tub)
- Heating & cooling: Central electric heating; Central electric cooling; Ceiling fans
- Interior features: Built-in cabinets; Great room floor plan; Split bedroom layout; Pantry; Island; Laundry in residence; Unfurnished
- Laundry & utility: Washer and dryer included; Water treatment system (owned); Auto garage door
Neighborhood map
What this means for you Summary
Snapshot
- This is a 3-bed/3.0-bath land listed at $279k.
Deal economics
- At list price, monthly cash flow is $-520 ($-6k/yr) — negative.
- To cash-flow at today's rent, offer at most $204k (27.0% below list).
- To meet the 1% rule (rent ≥ 1% of price), the offer needs to be $178k (36.1% below list).
- Recommended offer: $178k (36.1% below list) — sets the bar for 1% rule.
Location & tenants
- Location reads 59/100 on livability (#826 in FL) — a working-class tenant base; expect higher turnover. Strengths: cost of living A+, housing A+; Watch: crime C-, employment D+, schools D-.
- Lee (suburban): math 47% / reading 50% proficiency, ranked #42 of 73 in FL (top 58%) — families likely to look elsewhere, expect single-tenant / working-renter base with shorter leases.
- Market conditions: Rents soft (-1.5%/yr); 786 active listings in the ZIP; 40 comparable units currently listed for rent nearby; rentals at typical pace (median 24d on market — plan ~3-4 weeks tenant-placement turnaround); 15,411 units permitted in Lee County in 2024 (4,686 in 5+ unit buildings).
Forward outlook
- In year one you build about $30k of equity ($2k loan paydown + $28k appreciation (10.0% local appreciation)).
- Lee County population projected at +44% by 2050 — long-run rental-demand tailwind backs the buy-and-hold thesis.
- By year 2, paydown + projected appreciation supports a ~$48k cash-out refi (75% LTV) — recoverable capital for the next deal without selling this one.
Negotiation context
- It's been on market 58 days — a 3% lower offer ($271k) is reasonable based on typical stale-listing flexibility.
- 4 sale attempts since 4y ago with the ask held roughly flat each time — persistent listings suggest the price (not the market) is what's stuck; bring a comps-based counter.
- Current owner paid $27k; list at $279k implies a 933% gain — meaningful room to come down on a strong offer.
Risks & watch-outs
- Climate carrying-cost: moderate flood risk; severe wind risk, 99% chance of damaging wind over 30y; extreme-heat days projected 7→29/yr by 2055 (HVAC capex compounding) — expect insurance premiums to compound above CPI over the hold.
Questions for the listing agent
- What do current leases actually rent for vs. the listed asking? Can we see a recent rent roll and the last 12 months of T-12 income?
- It's been on market 58 days. Have you received any prior offers? Is the seller open to a 36% concession, seller financing, or rate buy-down credit?
- Is there a deadline driving the sale (1031 exchange, divorce, estate, relocation)? That informs how much negotiation room exists.
- Schools are D-rated, which usually means shorter tenancies and higher turnover. Who's the typical renter profile here, and what's been the actual vacancy rate?
- The area grade is low — what's the realistic commute time and amenity access for the typical tenant pool here? Any planned neighborhood developments (good or bad) we should know about?
- What's the average days-on-market for RENTAL listings here right now (not sales)? A rising rental-DOM trend means longer vacancies and softer asking-rent achievability than the comps imply.
- What's the recent tenant-quality profile in this submarket — average credit score on applications, eviction rate, late-payment / NSF rate, and stable-employment percentage? A property-management company in the area should have these aggregated.
- How much new for-sale + rental construction is in the pipeline within 1–3 miles? Heavy new supply typically softens prices + rents 12–24 months out; constrained supply supports both.
Investment metrics
- 1% rule
- 0.64% ✗
- Cap rate
- 4.06%
- Cash-on-cash
- -7.99%
- DSCR
- 0.64
- GRM
- 13.0
CMA / ARV
No comps found within radius.
Projected returns pro-forma
10.0% appreciation · 0.0% rent growth · sell at horizon
- IRR
- 17.9%
- Equity multiple
- 2.45×
- Total profit
- $113,616
- Equity at exit
- $251,345
- IRR
- 16.3%
- Equity multiple
- 5.50×
- Total profit
- $351,344
- Equity at exit
- $542,036
Cash invested: $78,120 (down + closing). Projections, not guarantees.
Landlord ↔ Tenant lean methodology
- Overall (STATE)
- 87 Strongly Landlord-Friendly
- State Florida
- 87 Strongly Landlord-Friendly · R+3
- County
- — inherits STATE
- City
- — inherits STATE
ZIP-level market 33976
- Home prices YoY
- 6.8%
- Rents YoY
- -1.5%
- Active inventory
- 786
- Price-to-rent
- 13.0×
Monthly cashflow live
- Estimated rent
- $1,782 high interval (Pro) →
- Mortgage (P&I)
- −$1,463
- Tax est. 1.5%
- −$349 /mo · $4,185/yr
- Insurance
- −$116
- HOA
- −$0
- Vacancy / Maint / Mgmt
- −$374
- Net cashflow
- $-520
Break-even live
UW: 25.0% down · 7.5% · 30yr · 1.5% tax · 5.0% vac · 8.0% maint · 8.0% mgmt
Financing live
Cash to close
- Down payment
- $69,750
- Closing costs
- $8,370
- Reserves months
- —
- Total cash needed
- —
Loan-product check · same deal, 3 products live
Conventional
25% down · 7.5% · 30yr
- Down + closing
- —
- Monthly P&I
- —
- Monthly cashflow
- —
- DSCR
- —
- Eligible?
- —
Personal DTI + credit; lowest rate.
DSCR
20% down · 8.5% · 30yr
- Down + closing
- —
- Monthly P&I
- —
- Monthly cashflow
- —
- DSCR
- —
- Eligible?
- —
No personal income docs; deal must DSCR.
Hard money
10% down · 12.0% · 12mo
- Down + closing
- —
- Monthly P&I
- —
- Monthly cashflow
- —
- DSCR
- —
- Eligible?
- —
Short-term bridge; refi at stabilization.
Rent comps 40 comps
| Address | Beds | Baths | Sqft | Rent | $/sqft | DOM | Units | Dist |
|---|---|---|---|---|---|---|---|---|
| 4400 Douglas Ln Lehigh Acres, FL | 3.0 | 2.0 | 1172 | $1,500 | $1.28 | 19d | 1 | 0.05mi |
| 104 Gordon Ave S Lehigh Acres, FL | 3.0 | 2.0 | 1123 | $1,300 | $1.16 | 3d | 1 | 0.21mi |
| 104 Gordon Ave S Lehigh Acres, FL | 3.0 | 2.0 | 1123 | $1,350 | $1.20 | 23d | 1 | 0.21mi |
| 122 Gordon Ave S Lehigh Acres, FL | 2.0 | 1.0 | 780 | $999 | $1.28 | 23d | 1 | 0.23mi |
| 107 Harold Ave S Lehigh Acres, FL | 3.0 | 2.0 | 1114 | $1,475 | $1.32 | 14d | 1 | 0.23mi |
| 142 Gordon Ave S Lehigh Acres, FL | 2.0 | 1.0 | 780 | $1,499 | $1.92 | 23d | 1 | 0.28mi |
| 305 Harold Ave S Lehigh Acres, FL | 3.0 | 2.0 | 1175 | $1,650 | $1.40 | 16d | 1 | 0.33mi |
| 310 Gordon Ave S Lehigh Acres, FL | 2.0 | 2.0 | 1166 | $1,599 | $1.37 | 3d | 1 | 0.34mi |
| 310 Gordon Ave S Lehigh Acres, FL | 2.0 | 2.0 | 1166 | $1,599 | $1.37 | 23d | 1 | 0.34mi |
| 136 Harry Ave S Lehigh Acres, FL | 3.0 | 2.0 | 1133 | $2,050 | $1.81 | 23d | 1 | 0.36mi |
| 113 Hightower Ave S Lehigh Acres, FL | 3.0 | 2.0 | 1200 | $1,800 | $1.50 | 21d | 1 | 0.36mi |
| 142 Harry Ave S Lehigh Acres, FL | 2.0 | 1.0 | 780 | $1,100 | $1.41 | 3d | 1 | 0.37mi |
| 142 Harry Ave S Lehigh Acres, FL | 2.0 | 1.0 | 780 | $1,100 | $1.41 | 23d | 1 | 0.37mi |
| 207 Hightower Ave S Lehigh Acres, FL | 2.0 | 2.0 | 1151 | $1,399 | $1.22 | 3d | 1 | 0.40mi |
| 210 Hightower Ave S Lehigh Acres, FL | 3.0 | 2.0 | 1181 | $1,295 | $1.10 | 21d | 1 | 0.44mi |
| 320 Harry Ave S Lehigh Acres, FL | 3.0 | 2.0 | 1212 | $1,550 | $1.28 | 23d | 1 | 0.45mi |
| 227 Hightower Ave S Lehigh Acres, FL | 2.0 | 2.0 | 1200 | $1,600 | $1.33 | 23d | 1 | 0.45mi |
| 610 Floyd Ave S Lehigh Acres, FL | 3.0 | 2.0 | 1400 | $2,100 | $1.50 | 23d | 1 | 0.49mi |
| 703 Felix Ave N Lehigh Acres, FL | 3.0 | 2.0 | 1272 | $2,600 | $2.04 | 23d | 1 | 0.49mi |
| 704 Gilbert Ave S Lehigh Acres, FL | 3.0 | 2.0 | 1203 | $1,475 | $1.23 | 19d | 1 | 0.50mi |
| 214 Ichabod Ave Lehigh Acres, FL | 3.0 | 2.0 | 1198 | $1,660 | $1.39 | 3d | 1 | 0.55mi |
| 4218 8th St SW Lehigh Acres, FL | 3.0 | 2.0 | 1408 | $1,800 | $1.28 | 23d | 1 | 0.56mi |
| 716 Gordon Ave S Lehigh Acres, FL | 3.0 | 2.0 | 1175 | $1,595 | $1.36 | 3d | 1 | 0.57mi |
| 151 Pine Ln Lehigh Acres, FL | 3.0 | 2.0 | 1198 | $1,660 | $1.39 | 3d | 1 | 0.61mi |
| 149 Pine Ln Lehigh Acres, FL | 3.0 | 2.0 | 1196 | $1,660 | $1.39 | 3d | 1 | 0.61mi |
| 4716 Douglas Ln Lehigh Acres, FL | 3.0 | 2.0 | 1200 | $1,850 | $1.54 | 23d | 1 | 0.63mi |
| 4715 4th St W Lehigh Acres, FL | 3.0 | 2.0 | 1445 | $1,695 | $1.17 | 23d | 1 | 0.65mi |
| 729 Harry Ave S Lehigh Acres, FL | 3.0 | 2.0 | 1125 | $1,500 | $1.33 | 23d | 1 | 0.66mi |
| 123 Pine Ln Lehigh Acres, FL | 3.0 | 2.0 | 1179 | $1,499 | $1.27 | 23d | 1 | 0.67mi |
| 4003 3rd St W Lehigh Acres, FL | 3.0 | 2.0 | 1311 | $1,985 | $1.51 | 23d | 1 | 0.68mi |
| 117 Pine Ln Lehigh Acres, FL | 3.0 | 2.0 | 1196 | $1,850 | $1.55 | 3d | 1 | 0.69mi |
| 745 Harry Ave S Lehigh Acres, FL | 3.0 | 2.0 | 1200 | $1,699 | $1.42 | 10d | 1 | 0.73mi |
| 3909 3rd St SW Lehigh Acres, FL | 2.0 | 1.0 | 852 | $2,250 | $2.64 | 23d | 1 | 0.73mi |
| 1105 Harold Ave S Lehigh Acres, FL | 3.0 | 2.0 | 988 | $1,250 | $1.27 | 23d | 1 | 0.75mi |
| 1117 Gordon Ave S Lehigh Acres, FL | 3.0 | 2.0 | 1170 | $1,750 | $1.50 | 21d | 1 | 0.79mi |
| 1113 Harry Ave S Lehigh Acres, FL | 2.0 | 2.0 | 1180 | $1,646 | $1.39 | 3d | 1 | 0.81mi |
| 1110 Hightower Ave S Lehigh Acres, FL | 3.0 | 2.0 | 1227 | $1,325 | $1.08 | 23d | 1 | 0.82mi |
| 127 John Ave S Lehigh Acres, FL | 3.0 | 2.0 | 1161 | $1,475 | $1.27 | 3d | 1 | 0.82mi |
| 3906 6th St W Lehigh Acres, FL | 3.0 | 2.0 | 1457 | $2,000 | $1.37 | 23d | 1 | 0.84mi |
| 4807 5th St W Lehigh Acres, FL | 4.0 | 2.0 | 1362 | $1,755 | $1.29 | 23d | 1 | 0.84mi |
Listing history 29 events
-
2026-06-17days on market $279,000 Active 58 DOM
-
2026-06-16days on market $279,000 Active 57 DOM
-
2026-06-15days on market $279,000 Active 56 DOM
-
2026-06-13days on market $279,000 Active 54 DOM
-
2026-06-10days on market $279,000 Active 51 DOM
-
2026-06-09days on market $279,000 Active 50 DOM
-
2026-06-07days on market $279,000 Active 48 DOM
-
2026-06-03days on market $279,000 Active 44 DOM
-
2026-06-02days on market $279,000 Active 43 DOM
-
2026-06-02price $279,000 Active 42 DOM
-
2026-06-01days on market $286,000 Active 42 DOM
-
2026-05-31days on market $286,000 Active 41 DOM
-
2026-05-14price $286,000
-
2026-04-20$287,000 Active
-
2026-04-11historical
-
2026-03-06price $289,900
-
2026-02-17price $294,000
-
2026-01-20price $296,000
-
2025-11-20price $297,000
-
2025-10-13$299,000 Active
-
2024-03-01soldstatus $27,000
-
2024-02-14soldstatus $27,000 Closed 145-char remark
Show marketing remark (145 chars)
The land boasts a prime location with easy access to major roads, endless possibilities for development. Agents please view confidential remarks.
-
2024-02-07status Pending 145-char remark
Show marketing remark (145 chars)
The land boasts a prime location with easy access to major roads, endless possibilities for development. Agents please view confidential remarks.
-
2024-02-02$28,000 Active 145-char remark
Show marketing remark (145 chars)
The land boasts a prime location with easy access to major roads, endless possibilities for development. Agents please view confidential remarks.
-
2022-09-06historical
-
2022-08-01price $34,900
-
2022-08-01$29,900 Active
-
2004-08-27soldstatus $17,500
-
2004-08-20soldstatus $17,500
ⓘ Source: listings_history table (triggers on properties + properties_extension) + one-shot
backfill from property_details.listing_events for pre-trigger history.
Climate risk First Street
- Flood 5/10 Major FEMA zone X (unshaded) · 67% chance over 30 yrs
- Wildfire 2/10 Low
- Heat 10/10 Extreme 7 d/yr ≥107°F today · 29 d/yr by 30 yrs out
- Wind 10/10 Extreme 99% chance of damaging wind over 30 yrs
- Air quality 2/10 Low 1 unhealthy d/yr today · 1 by 30 yrs out
Nearby sold comps map
Loading sold comps map…
Walkable amenities ~0.75 mi
Loading nearby amenities…
Taxation est. · year 1
- Rental income
- $21,384
- − Mortgage interest
- −$15,628
- − Property taxes
- −$4,185
- − Insurance
- −$1,395
- − Repairs & maintenance
- −$1,711
- − Management
- −$1,711
- − Depreciation
- −$8,116
- Taxable loss
- −$11,362
- Est. tax savings @ 24.0%
- +$2,727
- After-tax cash flow
- $-3,517/yr
For passive investors: Depreciation is non-cash, so a rental often shows a tax loss while cash-flowing — sheltering income. Rental losses are passive: they offset passive income freely, and up to $25,000/yr can offset ordinary (W-2) income if you actively participate and your MAGI is under $100k (phasing out to $0 by $150k); unused losses carry forward. On sale, claimed depreciation is recaptured at up to 25%, and gains may owe capital-gains tax (a 1031 exchange can defer both). Figures are a year-1 estimate at your 24.0% rate — not tax advice; consult a CPA.
Schools (NCES district)
- District
- Lee
- NCES district ID
- 1201080
- Math proficiency
- 47% ▼ -11.00%
- Reading proficiency
- 50% ▼ -4.00%
- Median HH income
- $49,518
- Composite
- 41.49/100
- National rank
- #3458
- State rank
- #42 of 73 in FL
Livability — Lehigh Acres
- Score
- 59/100
- State rank
- #826
- US rank
- #20055
Category grades
Schools grade is shown separately in the Schools card above.
Census & demographics
- Census place
- Lehigh Acres, FL
- County
- Lee County · 788,662 people
- City population
- 130,638
- Metro
- Cape Coral-Fort Myers, FL
- Population (ZIP)
- 20,277
- Household income
- $72,679
- Rent vs Own
- Severe rent burden
- 574.0
Population outlook (Lee County) Hauer SSP2
- Today (2025)
- 871,946 people
- By 2030
- 955,468 · +9.6%
- By 2040
- 1,113,587 · +27.7%
- By 2050
- 1,256,891 · +44.1%
- By 2075
- 1,560,270 · +78.9%
- By 2100
- 1,726,848 · +98.0%
Race, ethnicity, and origin ACS 2023
- Neighborhood character
- Diverse neighborhood (Simpson 0.65)
- Race & ethnicity
- Hispanic / Latino 50% Two or more races 30% White 24% Black 20% Asian 3%
- Hispanic origin (detail)
- Mexican 8% Puerto Rican 8% Cuban 18% Dominican 4%
- Common ancestry
- Hispanic 8% Slovak 1% Lithuanian 1%
- Foreign-born
- 35% · Canada, Jamaica, Vietnam
- Languages at home
- 46% English-only · Spanish 43% French/Haitian/Cajun 8% Vietnamese 1%
Political lean MEDSL · Lee
- 2024 margin
- Strong R (+28.4) · D 35.5% · R 63.9%
- 2008→2024 swing
- -18.0pp toward R · 2008: -10.4pp · 2024: -28.4pp
- All cycles
- 2024: R+28.4 2020: R+19.2 2016: R+20.4 2012: R+16.6 2008: R+10.4
Not yet ingested
- Civics
- —
Market trends
- HPI YoY
- ▲ 21.77%
- Current HPI
- 340.4255
- Rent YoY
- ▼ -1.54%
- Metro
- Cape Coral-Fort Myers, FL
- State GDP YoY
- ▲ 3.28%
- F500 in state
- 36
Industry mix (Fortune 500 HQ in FL)
| Industry | F500 HQs | Revenue |
|---|---|---|
| Industrial Technology | 2 | $29B |
|
||
| Insurance | 2 | $17B |
|
||
| Retail | 1 | $60B |
|
||
| Technology Distribution | 1 | $58B |
|
||
| Homebuilding | 1 | $35B |
|
||
| Technology Manufacturing | 1 | $35B |
|
||
Price history
+1534.3% since first listed17 events — show timeline
- 2026-05-14 Price Changed $286,000 NAPLESMLS
- 2026-04-20 Listed $287,000 NAPLESMLS
- 2026-04-11 Listing Removed — NAPLESMLS
- 2026-03-06 Price Changed $289,900 NAPLESMLS
- 2026-02-17 Price Changed $294,000 NAPLESMLS
- 2026-01-20 Price Changed $296,000 NAPLESMLS
- 2025-11-20 Price Changed $297,000 NAPLESMLS
- 2025-10-13 Listed $299,000 NAPLESMLS
- 2024-03-01 Sold (Public Records) $27,000 Public Records
- 2024-02-14 Sold (MLS) $27,000 FORTMLS
- 2024-02-07 Pending — FORTMLS
- 2024-02-02 Listed $28,000 FORTMLS
- 2022-09-06 Listing Removed — FORTMLS
- 2022-08-01 Price Changed $34,900 FORTMLS
- 2022-08-01 Listed $29,900 FORTMLS
- 2004-08-27 Sold (Public Records) $17,500 Public Records
- 2004-08-20 Sold (MLS) $17,500 FORTMLS
Property tax history
+19.7%/yrLatest (2025): $520 · +34.9% YoY. Source: county tax records.
Cash-flow waterfall
monthlySold comps — $/sqft
last 12 mo · ≤1 miLoading sold comps…