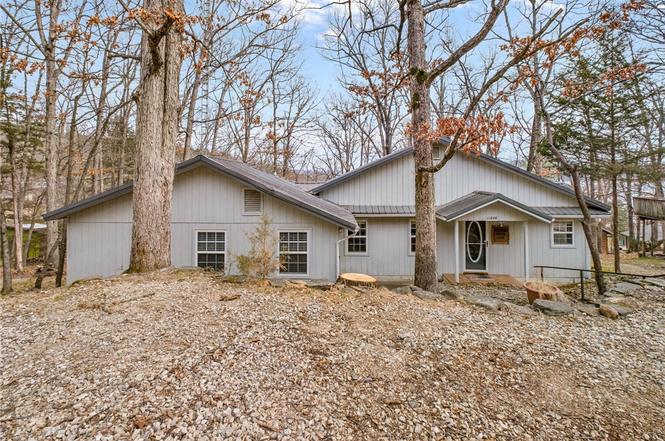
11646 Cedar Dr · Lost Bridge Village, AR
Flood risk 1/10 · Minimal
- FEMA flood zone
- X (unshaded)
- Chance of flooding over 30 yrs
- 0.0%
- Est. flood insurance / yr
- $507 – $1,088
Fire risk 1/10 · Minimal
- Est. fire insurance / yr
- $1,499 – $2,785
Heat risk 4/10 · Minor
- Hot days now (above 105°F)
- 7 days/yr
- Hot days in 30 yrs
- 21 days/yr
Wind risk 2/10 · Minimal
- Chance of severe wind over 30 yrs
- 1.0%
Air-quality risk 1/10 · Minimal
- Unhealthy air days now
- 0 days/yr
- Unhealthy air days in 30 yrs
- 0 days/yr
Risk factors via First Street. Map © Google.
Why this score? — see what drove the A- grade
The composite is a weighted blend of 9 inputs, each scored 0–100. Each bar is that input's sub-score; the figure is the points it added to the 100-point composite (weight × sub-score).
- Cash flow +30.0/30.0
- ARV discount +15.0/15.0
- DSCR +10.0/10.0
- 1% rule +9.2/10.0
- Appreciation +8.8/10.0
- Schools +3.9/10.0
- Livability +2.9/5.0
- Rent growth +2.5/5.0
- Condition / age +2.5/5.0
$299,000
🖨 Deal sheet 📄 Offer letter ✓ Due diligence
Listing remarks
Enjoy seasonal lake views of Beaver Lake from this inviting 3-bedroom, 3-bath home, perfectly suited for full-time living or a relaxing getaway. The interior features stunning vaulted wood ceilings that create a warm, open feel, along with an updated kitchen designed for both style and functionality. Step outside to over 600 sq ft of covered deck space, ideal for entertaining, dining, or simply taking in the serene surroundings year-round. Located in a desirable community, residents enjoy amenities including a swimming pool, pickleball courts, and the convenience of being just a short distance to lake access for boating, fishing, and recreation. This property combines natural beauty, comfor
Key facts
- Pickleball courts
- Swimming pool
- Seasonal lake views
Tags
Property features AI
Finance
- HOA & community: Part of Lost Bridge Village HOA; HOA fee $160 annually; Community amenities include recreation area, lake access, and community pool
Exterior
- Parking: Gravel driveway (on-site parking)
- Security: Smoke detectors
- Utilities: Electricity available; Public water; Public sewer
- Home design: Single-story home; Metal roof; Rock and wood siding construction; Has a view
- Construction: Built 25+ years ago; Metal roof; Rock and wood siding
- Exterior features: Covered patio/porch; Deck; Storage structure; Gravel driveway; Subdivision setting; Views of Beaver Lake; Public paved road frontage
Interior
- Kitchen: Electric range; Dishwasher; Microwave; Refrigerator
- Bedrooms: 3 bedrooms
- Flooring: Carpet; Laminate; Tile
- Bathrooms: 3 full bathrooms
- Heating & cooling: Central heating (electric); Central air conditioning (electric)
- Interior features: Ceiling fans; Blinds and window treatments
- Laundry & utility: Washer hookup; Dryer hookup; Washer; Dryer; Electric water heater
Neighborhood map
What this means for you Summary
Snapshot
- This is a 3-bed/2.0-bath single-family listed at $299k.
Deal economics
- At list price, monthly cash flow is $2k ($19k/yr) — positive.
- The deal already cash-flows at list — no discount required.
- Meets the 1% rule at list price ($4k rent vs $299k).
- Recommended offer: $272k (9.0% below list) — sets the bar for market timing.
- Cap rate 12.6% vs local median 2.8% in Lost Bridge Village — top-decile yield for the area; either an underpriced asset or a hidden risk that comps aren't pricing in. Stress-test before assuming the spread holds.
Location & tenants
- Location reads 57/100 on livability (#348 in AR) — a working-class tenant base; expect higher turnover. Strengths: housing A+, crime B+, employment B; Watch: cost of living C-, schools F, amenities F.
- Rogers School District (urban): math 45% / reading 45% proficiency, ranked #31 of 238 in AR (top 13%) — families likely to look elsewhere, expect single-tenant / working-renter base with shorter leases.
- Market conditions: 129 active listings in the ZIP; 2 comparable units currently listed for rent nearby; 4,359 units permitted in Benton County in 2024 (402 in 5+ unit buildings).
Forward outlook
- In year one you build about $25k of equity ($2k loan paydown + $23k appreciation (7.6% local appreciation)).
- Benton County population projected at +56% by 2050 — long-run rental-demand tailwind backs the buy-and-hold thesis.
- At projected returns (7.6% appreciation + 3.0% rent growth), your $84k cash investment doubles in ~2 years — after that, you're playing with house money.
- By year 2, paydown + projected appreciation supports a ~$40k cash-out refi (75% LTV) — recoverable capital for the next deal without selling this one.
Negotiation context
- It's been on market 112 days — a 9% lower offer ($272k) is reasonable based on typical stale-listing flexibility.
- Current owner paid $64k; list at $299k implies a 367% gain — meaningful room to come down on a strong offer.
Questions for the listing agent
- It's been on market 112 days. Have you received any prior offers? Is the seller open to a 9% concession, seller financing, or rate buy-down credit?
- Built in 1968 — when were the roof, HVAC, electrical panel, plumbing, and water heater last replaced?
- What does the HOA fee cover, when was the last increase, and are there any pending special assessments or reserve-fund shortfalls?
- Why hasn't it sold? Are there any deal-killer items the seller is aware of (foundation, flood, title, zoning, code violations)?
- Is there a deadline driving the sale (1031 exchange, divorce, estate, relocation)? That informs how much negotiation room exists.
- Schools are F-rated, which usually means shorter tenancies and higher turnover. Who's the typical renter profile here, and what's been the actual vacancy rate?
- What's the average days-on-market for RENTAL listings here right now (not sales)? A rising rental-DOM trend means longer vacancies and softer asking-rent achievability than the comps imply.
- What's the recent tenant-quality profile in this submarket — average credit score on applications, eviction rate, late-payment / NSF rate, and stable-employment percentage? A property-management company in the area should have these aggregated.
- How much new for-sale + rental construction is in the pipeline within 1–3 miles? Heavy new supply typically softens prices + rents 12–24 months out; constrained supply supports both.
Investment metrics
- 1% rule
- 1.42% ✓
- Cap rate
- 12.64%
- Cash-on-cash
- 22.66%
- DSCR
- 2.01
- GRM
- 5.9
CMA / ARV
- ARV (on-the-fly)
- $383,000
- Comps found
- 6
Show comp detail 6 sales within ~0.75 mi
| Address | Dist | Beds/Ba | Sqft | Sold | Price | $/sf | Match |
|---|---|---|---|---|---|---|---|
| 11747 Dogwood Dr | 0.34mi | 3/2.0 | 1,536 (+0%) | 7mo | $208,000 | $135 | 78 |
| 11579 Hickory Dr | 0.16mi | 2/2.0 (-1) | 1,440 (-6%) | 2mo | $125,000 | $87 | 76 |
| 11475 Country Club Dr | 0.12mi | 3/2.0 | 1,441 (-6%) | 13mo | $360,000 | $250 | 74 |
| 21293 Ridgeview Dr | 0.27mi | 3/2.0 | 1,395 (-9%) | 21mo | $400,000 | $287 | 55 |
| 11872 White Oak Dr | 0.48mi | 3/2.5 | 1,696 (+11%) | 15mo | $465,000 | $274 | 45 |
| 11823 Dogwood Dr | 0.61mi | 3/2.0 | 1,346 (-12%) | 20mo | $293,000 | $218 | 35 |
Match score weights: distance 35% · size 25% · config 20% · recency 20%. Top-matched comps best support the ARV.
Projected returns pro-forma
7.61% appreciation · 3.0% rent growth · sell at horizon
- IRR
- 37.2%
- Equity multiple
- 3.58×
- Total profit
- $216,302
- Equity at exit
- $219,220
- IRR
- 33.4%
- Equity multiple
- 7.60×
- Total profit
- $552,443
- Equity at exit
- $427,789
Cash invested: $83,720 (down + closing). Projections, not guarantees.
Landlord ↔ Tenant lean methodology
- Overall (STATE)
- 92 Strongly Landlord-Friendly
- State Arkansas
- 92 Strongly Landlord-Friendly · R+14
- County
- — inherits STATE
- City
- — inherits STATE
ZIP-level market 72732
- Home prices YoY
- 2.1%
- Active inventory
- 129
- Price-to-rent
- 5.9×
Monthly cashflow live
- Estimated rent
- $4,254 medium interval (Pro) →
- Mortgage (P&I)
- −$1,568
- Tax from tax record
- −$74 /mo · $890/yr
- Insurance
- −$125
- HOA
- −$13
- Vacancy / Maint / Mgmt
- −$893
- Net cashflow
- $1,581
Break-even live
UW: 25.0% down · 7.5% · 30yr · 1.5% tax · 5.0% vac · 8.0% maint · 8.0% mgmt
Financing live
Cash to close
- Down payment
- $74,750
- Closing costs
- $8,970
- Reserves months
- —
- Total cash needed
- —
Loan-product check · same deal, 3 products live
Conventional
25% down · 7.5% · 30yr
- Down + closing
- —
- Monthly P&I
- —
- Monthly cashflow
- —
- DSCR
- —
- Eligible?
- —
Personal DTI + credit; lowest rate.
DSCR
20% down · 8.5% · 30yr
- Down + closing
- —
- Monthly P&I
- —
- Monthly cashflow
- —
- DSCR
- —
- Eligible?
- —
No personal income docs; deal must DSCR.
Hard money
10% down · 12.0% · 12mo
- Down + closing
- —
- Monthly P&I
- —
- Monthly cashflow
- —
- DSCR
- —
- Eligible?
- —
Short-term bridge; refi at stabilization.
Rent comps 2 comps
| Address | Beds | Baths | Sqft | Rent | $/sqft | DOM | Units | Dist |
|---|---|---|---|---|---|---|---|---|
| 11889 White Oak Dr Unit 1221899P Garfield, AR | 3.0 | 2.0 | 1280 | $5,605 | $4.38 | 43d | 1 | 0.54mi |
| 10800 Red Bluff Rd Garfield, AR | 2.0 | 2.0 | 1500 | $2,250 | $1.50 | 23d | 1 | 0.94mi |
HOA detail
- Monthly dues
- $13 · $156/yr
- Likely covers
- pool
Listing history 22 events
-
2026-06-18days on market $299,000 Active 112 DOM
-
2026-06-17price $299,000 Active 111 DOM
-
2026-06-17days on market $319,000 Active 111 DOM
-
2026-06-16days on market $319,000 Active 110 DOM
-
2026-06-15days on market $319,000 Active 109 DOM
-
2026-06-14days on market $319,000 Active 107 DOM
-
2026-06-13days on market $319,000 Active 106 DOM
-
2026-06-10days on market $319,000 Active 104 DOM
-
2026-06-09days on market $319,000 Active 103 DOM
-
2026-06-09price $319,000 Active 102 DOM
-
2026-06-08days on market $349,000 Active 102 DOM
-
2026-06-07days on market $349,000 Active 101 DOM
-
2026-06-05days on market $349,000 Active 98 DOM
-
2026-06-03days on market $349,000 Active 97 DOM
-
2026-06-02days on market $349,000 Active 96 DOM
-
2026-06-01days on market $349,000 Active 95 DOM
-
2026-05-31days on market $349,000 Active 94 DOM
-
2026-05-31days on market $349,000 Active 93 DOM
-
2026-05-20price $349,000
-
2026-04-22price $369,000
-
2026-02-25$385,000 Active
-
2000-04-10soldstatus $64,000
ⓘ Source: listings_history table (triggers on properties + properties_extension) + one-shot
backfill from property_details.listing_events for pre-trigger history.
Tax reassessment forecast AR · Resets to sale price
- Current annual tax
- $890 · $74/mo
- Projected year-2 tax
- $1,914 · $159/mo
- Expected delta
- +$1,024/yr (+$85/mo · 115.0%)
ⓘ Screening estimate from a state-policy table — verify with the county assessor before closing.
Climate risk First Street
- Flood 1/10 Low FEMA zone X (unshaded) · 0% chance over 30 yrs
- Wildfire 1/10 Low
- Heat 4/10 Moderate 7 d/yr ≥105°F today · 21 d/yr by 30 yrs out
- Wind 2/10 Low 100% chance of damaging wind over 30 yrs
- Air quality 1/10 Low 0 unhealthy d/yr today · 0 by 30 yrs out
Nearby sold comps map
Loading sold comps map…
Walkable amenities ~0.75 mi
Loading nearby amenities…
Taxation est. · year 1
- Rental income
- $51,051
- − Mortgage interest
- −$16,749
- − Property taxes
- −$890
- − Insurance
- −$1,495
- − Repairs & maintenance
- −$4,084
- − Management
- −$4,084
- − HOA
- −$156
- − Depreciation
- −$8,698
- Taxable income
- $14,895
- Est. tax owed @ 24.0%
- −$3,575
- After-tax cash flow
- $15,399/yr
For passive investors: Depreciation is non-cash, so a rental often shows a tax loss while cash-flowing — sheltering income. Rental losses are passive: they offset passive income freely, and up to $25,000/yr can offset ordinary (W-2) income if you actively participate and your MAGI is under $100k (phasing out to $0 by $150k); unused losses carry forward. On sale, claimed depreciation is recaptured at up to 25%, and gains may owe capital-gains tax (a 1031 exchange can defer both). Figures are a year-1 estimate at your 24.0% rate — not tax advice; consult a CPA.
Schools (NCES district)
- District
- Rogers School District
- NCES district ID
- 0511970
- Math proficiency
- 45% ▼ -9.00%
- Reading proficiency
- 45% ▼ -9.00%
- Median HH income
- $51,712
- Composite
- 38.81/100
- National rank
- #4113
- State rank
- #31 of 238 in AR
Livability — Lost Bridge Village
- Score
- 57/100
- State rank
- #348
- US rank
- #21912
Category grades
Schools grade is shown separately in the Schools card above.
Census & demographics
- Census place
- Lost Bridge Village, AR
- Population (ZIP)
- 5,493
Population outlook (Benton County) Hauer SSP2
- Today (2025)
- 318,683 people
- By 2030
- 353,481 · +10.9%
- By 2040
- 425,280 · +33.4%
- By 2050
- 497,239 · +56.0%
- By 2075
- 662,114 · +107.8%
- By 2100
- 776,431 · +143.6%
Race, ethnicity, and origin ACS 2023
- Neighborhood character
- Diverse neighborhood (Simpson 0.56)
- Race & ethnicity
- White 65% Two or more races 27% Hispanic / Latino 11% Native American 1%
- Hispanic origin (detail)
- Mexican 7%
- Common ancestry
- Italian 3% Danish 2% Lithuanian 1%
- Foreign-born
- 3% · Canada
- Languages at home
- 97% English-only · Spanish 3%
Political lean MEDSL · Benton
- 2024 margin
- Strong R (+27.0) · D 35.2% · R 62.1% · Other 2.7%
- 2008→2024 swing
- +9.6pp toward D · 2008: -36.5pp · 2024: -27.0pp
- All cycles
- 2024: R+27.0 2020: R+26.4 2016: R+34.9 2012: R+40.4 2008: R+36.5
Not yet ingested
- Civics
- —
Market trends
- HPI YoY
- ▲ 7.61%
- Current HPI
- 368.3932
- Rent YoY
- —
- Metro
- —
- State GDP YoY
- ▲ 3.80%
- F500 in state
- 10
Industry mix (Fortune 500 HQ in AR)
| Industry | F500 HQs | Revenue |
|---|---|---|
| Retail | 1 | $681B |
|
||
| Food / Agriculture | 1 | $53B |
|
||
| Retail / Energy | 1 | $22B |
|
||
| Transportation / Logistics | 1 | $12B |
|
||
| Energy | 1 | $4B |
|
||
Price history
+445.3% since first listed4 events — show timeline
- 2026-05-20 Price Changed $349,000 NWARMLS
- 2026-04-22 Price Changed $369,000 NWARMLS
- 2026-02-25 Listed $385,000 NWARMLS
- 2000-04-10 Sold (Public Records) $64,000 Public Records
Property tax history
+2.5%/yrLatest (2025): $890 · +4.7% YoY. Source: county tax records.
Cash-flow waterfall
monthlySold comps — $/sqft
last 12 mo · ≤1 miLoading sold comps…