201 Webb Ave Unit Ave/203 · South Sumter, SC
Flood risk 1/10 · Minimal
- FEMA flood zone
- X (unshaded)
- Chance of flooding over 30 yrs
- 0.0%
- Est. flood insurance / yr
- $507 – $1,088
Fire risk 5/10 · Moderate
- Est. fire insurance / yr
- $783 – $1,453
Heat risk 7/10 · Major
- Hot days now (above 108°F)
- 7 days/yr
- Hot days in 30 yrs
- 16 days/yr
Wind risk 8/10 · Major
- Chance of severe wind over 30 yrs
- 80.0%
Air-quality risk 2/10 · Minimal
- Unhealthy air days now
- 2 days/yr
- Unhealthy air days in 30 yrs
- 2 days/yr
Risk factors via First Street. Map © Google.
Why this score? — see what drove the B+ grade
The composite is a weighted blend of 9 inputs, each scored 0–100. Each bar is that input's sub-score; the figure is the points it added to the 100-point composite (weight × sub-score).
- Cash flow +30.0/30.0
- ARV discount +15.0/15.0
- 1% rule +10.0/10.0
- DSCR +10.0/10.0
- Rent growth +3.1/5.0
- Livability +2.8/5.0
- Condition / age +2.2/5.0
- Schools +1.9/10.0
- Appreciation +0.0/10.0
$89,900
🖨 Deal sheet 📄 Offer letter ✓ Due diligence
Listing remarks
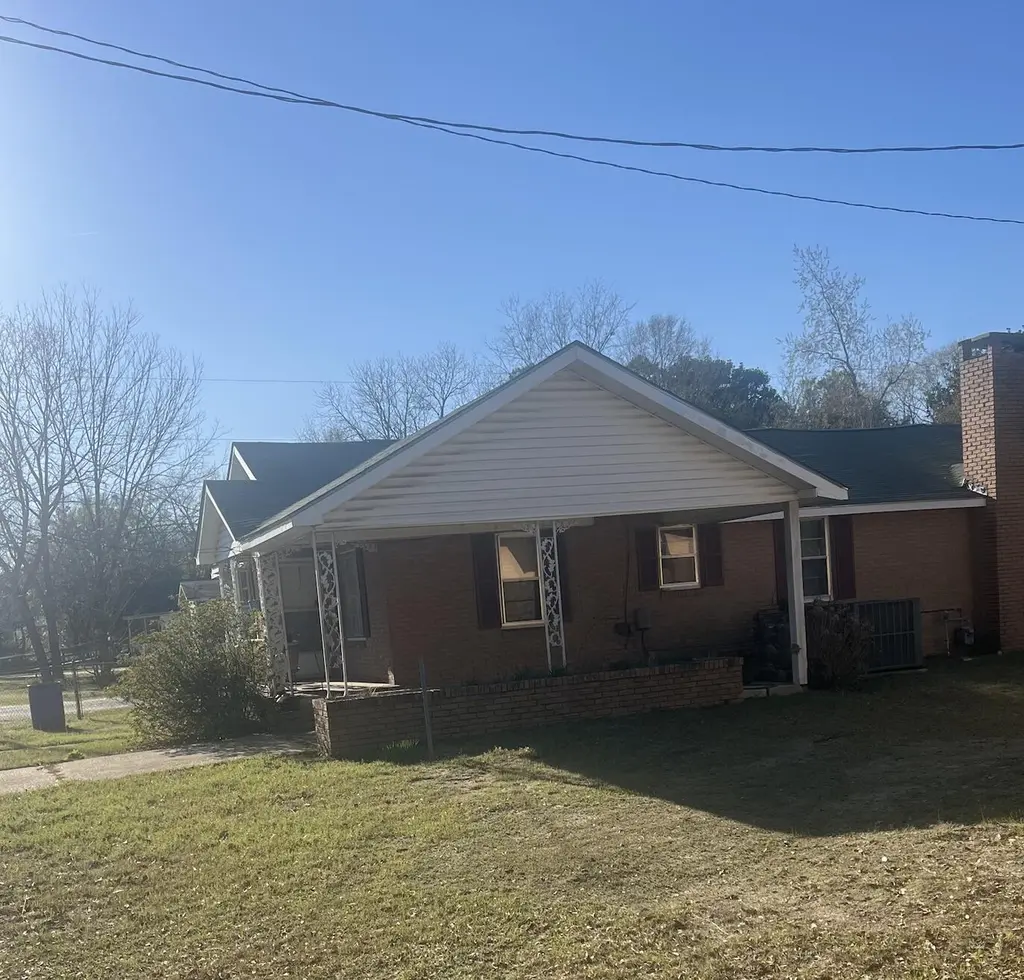
Unique Opportunity! This brick home features 3 bedrooms, 2 baths, a charming brick fireplace, a spacious walk-in shower, and a one-car carport. A separate building—formerly used for catering—offers endless possibilities! Situated on a corner fenced lot and conveniently located near downtown Sumter. Being sold AS IS.
Key facts
- Separate building
- Brick fireplace
- Corner fenced lot
Tags
Property features AI
Exterior
- Parking: Attached carport; 1-car carport
- Utilities: Public water; Public sewer
- Home design: Single-family residence; One story
- Construction: Brick and wood siding construction; Shingle roof; Crawl space foundation; Built in 1,535 sq ft
- Exterior features: Front porch; Shed(s); Other fencing
Interior
- Kitchen: Dishwasher; Range; Exhaust fan
- Flooring: Carpet; Linoleum; Other flooring
- Bathrooms: 1 full bathroom
- Heating & cooling: Heat pump heating; Central air; Ceiling fans
- Interior features: Other interior features; Wood-burning fireplace
- Laundry & utility: Washer hookup; Electric dryer hookup
Neighborhood map
What this means for you Summary
Snapshot
- This is a 3-bed/1.0-bath single-family listed at $90k. Condition is rated fair.
Deal economics
- At list price, monthly cash flow is $535 ($6k/yr) — positive.
- The deal already cash-flows at list — no discount required.
- Meets the 1% rule at list price ($1k rent vs $90k).
- Recommended offer: $87k (3.0% below list) — sets the bar for market timing.
Location & tenants
- Location reads 55/100 on livability (#313 in SC) — a working-class tenant base; expect higher turnover. Strengths: cost of living A+, housing A+, crime B; Watch: amenities F, commute F, employment F.
- Sumter 01 (urban): math 18% / reading 28% proficiency, ranked #64 of 80 in SC (top 80%) — low school quality limits family demand, transient renter base, plan for 1-2y turnover; 64% free/reduced lunch — lower-income household profile, screen leases tightly.
- Zoned schools: Kingsbury Elementary (math 22% / reading 22%, grade F, #475 of 597 statewide, top 81%, 612 students, 100% FRL); Bates Middle (math 9% / reading 21%, grade F, #202 of 229 statewide, top 89%, 569 students, 100% FRL); Sumter High School (math 22% / reading 67%, grade F, #166 of 196 statewide, top 87%, 2,289 students, 100% FRL) — zoned schools average 100% FRL vs 64% district-wide (36 pts higher); higher-poverty schools than district average — tighter screening recommended.
- Market conditions: Rents rising (+2.5%/yr); 376 active listings in the ZIP; 386 units permitted in Sumter County in 2024 (0 in 5+ unit buildings).
- This rent runs 34% of the median local income ($51k/yr) — at the standard rent-burdened threshold; future hikes will face affordability resistance.
Forward outlook
- Local home prices are declining (-3.0%/yr); year-one equity from $622 of loan paydown is wiped out by about $3k of value loss. Plan a longer hold.
- Sumter County population projected at -14% by 2050 — secular population decline; favor cash flow + early exit over multi-decade hold.
- At projected returns (-3.0% appreciation + 2.5% rent growth), your $25k cash investment doubles in ~5 years — after that, you're playing with house money.
Negotiation context
- It's been on market 49 days — a 3% lower offer ($87k) is reasonable based on typical stale-listing flexibility.
Risks & watch-outs
- Watch-outs: built in 1957 — expect roof / HVAC / electrical / plumbing capex.
- Climate carrying-cost: severe wind risk, 80% chance of damaging wind over 30y; moderate wildfire risk; extreme-heat days projected 7→16/yr by 2055 (HVAC capex compounding) — expect insurance premiums to compound above CPI over the hold.
Questions for the listing agent
- It's been on market 49 days. Have you received any prior offers? Is the seller open to a 3% concession, seller financing, or rate buy-down credit?
- Have any recent inspections been done? Can we get a copy of the seller's disclosures and any deferred-maintenance estimates?
- Built in 1957 — when were the roof, HVAC, electrical panel, plumbing, and water heater last replaced?
- Is there a deadline driving the sale (1031 exchange, divorce, estate, relocation)? That informs how much negotiation room exists.
- Schools are F-rated, which usually means shorter tenancies and higher turnover. Who's the typical renter profile here, and what's been the actual vacancy rate?
- What's the average days-on-market for RENTAL listings here right now (not sales)? A rising rental-DOM trend means longer vacancies and softer asking-rent achievability than the comps imply.
- What's the recent tenant-quality profile in this submarket — average credit score on applications, eviction rate, late-payment / NSF rate, and stable-employment percentage? A property-management company in the area should have these aggregated.
- How much new for-sale + rental construction is in the pipeline within 1–3 miles? Heavy new supply typically softens prices + rents 12–24 months out; constrained supply supports both.
Investment metrics
- 1% rule
- 1.63% ✓
- Cap rate
- 13.44%
- Cash-on-cash
- 25.51%
- DSCR
- 2.14
- GRM
- 5.1
CMA / ARV
- ARV (on-the-fly)
- $141,220
- Comps found
- 3
Show comp detail 3 sales within ~0.75 mi
| Address | Dist | Beds/Ba | Sqft | Sold | Price | $/sf | Match |
|---|---|---|---|---|---|---|---|
| 1234 Ivey St | 0.72mi | 3/1.5 | 1,721 (+12%) | 1mo | $159,000 | $92 | 44 |
| 110 Vernon Dr | 0.45mi | 3/1.0 | 1,360 (-11%) | 23mo | $28,000 | $21 | 41 |
| 991 Meadowbrook Rd | 0.67mi | 3/1.0 | 1,333 (-13%) | 23mo | $139,500 | $105 | 28 |
Match score weights: distance 35% · size 25% · config 20% · recency 20%. Top-matched comps best support the ARV.
Projected returns pro-forma
-3.0% appreciation · 2.55% rent growth · sell at horizon
- IRR
- 18.6%
- Equity multiple
- 1.75×
- Total profit
- $18,882
- Equity at exit
- $13,404
- IRR
- 26.7%
- Equity multiple
- 3.29×
- Total profit
- $57,741
- Equity at exit
- $7,773
Cash invested: $25,172 (down + closing). Projections, not guarantees.
Landlord ↔ Tenant lean methodology
- Overall (STATE)
- 90 Strongly Landlord-Friendly
- State South Carolina
- 90 Strongly Landlord-Friendly · R+6
- County
- — inherits STATE
- City
- — inherits STATE
ZIP-level market 29150
- Rents YoY
- 2.5%
- Active inventory
- 376
- Price-to-rent
- 5.1×
Monthly cashflow live
- Estimated rent
- $1,464 medium interval (Pro) →
- Mortgage (P&I)
- −$471
- Tax est. 1.5%
- −$112 /mo · $1,348/yr
- Insurance
- −$37
- HOA
- −$0
- Vacancy / Maint / Mgmt
- −$307
- Net cashflow
- $535
Break-even live
UW: 25.0% down · 7.5% · 30yr · 1.5% tax · 5.0% vac · 8.0% maint · 8.0% mgmt
Financing live
Cash to close
- Down payment
- $22,475
- Closing costs
- $2,697
- Reserves months
- —
- Total cash needed
- —
Loan-product check · same deal, 3 products live
Conventional
25% down · 7.5% · 30yr
- Down + closing
- —
- Monthly P&I
- —
- Monthly cashflow
- —
- DSCR
- —
- Eligible?
- —
Personal DTI + credit; lowest rate.
DSCR
20% down · 8.5% · 30yr
- Down + closing
- —
- Monthly P&I
- —
- Monthly cashflow
- —
- DSCR
- —
- Eligible?
- —
No personal income docs; deal must DSCR.
Hard money
10% down · 12.0% · 12mo
- Down + closing
- —
- Monthly P&I
- —
- Monthly cashflow
- —
- DSCR
- —
- Eligible?
- —
Short-term bridge; refi at stabilization.
Listing history 16 events
-
2026-06-19days on market $89,900 Active 49 DOM
-
2026-06-18days on market $89,900 Active 48 DOM
-
2026-06-17days on market $89,900 Active 47 DOM
-
2026-06-16days on market $89,900 Active 46 DOM
-
2026-06-15days on market $89,900 Active 45 DOM
-
2026-06-14days on market $89,900 Active 43 DOM
-
2026-06-13days on market $89,900 Active 42 DOM
-
2026-06-10days on market $89,900 Active 40 DOM
-
2026-06-09days on market $89,900 Active 39 DOM
-
2026-06-08days on market $89,900 Active 38 DOM
-
2026-06-07days on market $89,900 Active 37 DOM
-
2026-06-02days on market $89,900 Active 32 DOM
-
2026-06-01days on market $89,900 Active 31 DOM
-
2026-05-31days on market $89,900 Active 30 DOM
-
2026-05-30days on market $89,900 Active 29 DOM
-
2026-05-01$89,900 Active
ⓘ Source: listings_history table (triggers on properties + properties_extension) + one-shot
backfill from property_details.listing_events for pre-trigger history.
Climate risk First Street
- Flood 1/10 Low FEMA zone X (unshaded) · 0% chance over 30 yrs
- Wildfire 5/10 Major
- Heat 7/10 Severe 7 d/yr ≥108°F today · 16 d/yr by 30 yrs out
- Wind 8/10 Severe 80% chance of damaging wind over 30 yrs
- Air quality 2/10 Low 2 unhealthy d/yr today · 2 by 30 yrs out
Nearby sold comps map
Loading sold comps map…
Walkable amenities ~0.75 mi
Loading nearby amenities…
Taxation est. · year 1
- Rental income
- $17,567
- − Mortgage interest
- −$5,036
- − Property taxes
- −$1,348
- − Insurance
- −$450
- − Repairs & maintenance
- −$1,405
- − Management
- −$1,405
- − Depreciation
- −$2,615
- Taxable income
- $5,307
- Est. tax owed @ 24.0%
- −$1,274
- After-tax cash flow
- $5,149/yr
For passive investors: Depreciation is non-cash, so a rental often shows a tax loss while cash-flowing — sheltering income. Rental losses are passive: they offset passive income freely, and up to $25,000/yr can offset ordinary (W-2) income if you actively participate and your MAGI is under $100k (phasing out to $0 by $150k); unused losses carry forward. On sale, claimed depreciation is recaptured at up to 25%, and gains may owe capital-gains tax (a 1031 exchange can defer both). Figures are a year-1 estimate at your 24.0% rate — not tax advice; consult a CPA.
Condition & rehab AI · 6 photos
This 3-bedroom, 1-bath home with a brick fireplace and walk-in shower is in fair condition but requires moderate repairs and updates to increase its value.
Repairs flagged
- Minor Carpeted flooring — Worn and outdated
- Minor Ceiling fans — Worn and outdated
Value-add opportunities
- Resale Paint walls — Fresh paint enhances curb appeal
- Both Replace carpet with hardwood or tile — Hardwood or tile flooring is more durable and aesthetically pleasing
- Resale Upgrade ceiling fans — Modern fans improve air circulation and aesthetics
Renovation cost estimate screening
| Repair item | Severity | Est. cost |
|---|---|---|
| Carpeted flooring · Worn and outdated | Minor | $500–3,000 |
| Ceiling fans · Worn and outdated | Minor | $500–3,000 |
| Total estimated repair cost · 2 items | $1,000–6,000 |
Value-add ROI direction
- Resale Paint walls — Fresh paint enhances curb appeal ↑
- Both Replace carpet with hardwood or tile — Hardwood or tile flooring is more durable and aesthetically pleasing ↑
- Resale Upgrade ceiling fans — Modern fans improve air circulation and aesthetics ↑
ⓘ Cost ranges are severity-bucket heuristics (US national rule-of-thumb). Get contractor quotes + a written scope before underwriting a rehab budget.
Schools (NCES district)
- District
- Sumter 01
- NCES district ID
- 4503902
- Math proficiency
- 18% ▼ -13.00%
- Reading proficiency
- 28% ▼ -6.00%
- Median HH income
- $40,423
- Composite
- 19.45/100
- National rank
- #8775
- State rank
- #64 of 80 in SC
Livability — South Sumter
- Score
- 55/100
- State rank
- #313
- US rank
- #23603
Category grades
Schools grade is shown separately in the Schools card above.
Census & demographics
- Census place
- South Sumter, SC
- County
- Sumter County · 76,912 people
- Metro
- Sumter, SC
- Population (ZIP)
- 38,538
- Household income
- $50,965
- Rent vs Own
- Severe rent burden
- 1136.0
Population outlook (Sumter County) Hauer SSP2
- Today (2025)
- 104,585 people
- By 2030
- 102,282 · -2.2%
- By 2040
- 96,258 · -8.0%
- By 2050
- 89,592 · -14.3%
- By 2075
- 74,715 · -28.6%
- By 2100
- 60,235 · -42.4%
Race, ethnicity, and origin ACS 2023
- Neighborhood character
- Diverse neighborhood (Simpson 0.60)
- Race & ethnicity
- Black 50% White 39% Hispanic / Latino 5% Two or more races 4% Asian 2%
- Hispanic origin (detail)
- Mexican 3% Puerto Rican 1%
- Common ancestry
- Slovak 2% Lithuanian 1% Italian 1%
- Foreign-born
- 4% · Canada, China, Vietnam
- Languages at home
- 93% English-only · Spanish 4% Other Indo-European 1% German/W. Germanic 1%
Political lean MEDSL · Sumter
- 2024 margin
- Toss-up / Even · D 51.9% · R 47.0% · Other 1.2%
- 2008→2024 swing
- -10.6pp toward R · 2008: 15.4pp · 2024: 4.9pp
- All cycles
- 2024: D+4.9 2020: D+13.0 2016: D+12.0 2012: D+17.5 2008: D+15.4
Not yet ingested
- Civics
- —
Market trends
- HPI YoY
- ▼ -100.16%
- Current HPI
- 129.032
- Rent YoY
- ▲ 2.55%
- Metro
- Sumter, SC
- State GDP YoY
- ▲ 4.51%
- F500 in state
- 2
Industry mix (Fortune 500 HQ in SC)
| Industry | F500 HQs | Revenue |
|---|---|---|
| Packaging | 1 | $7B |
|
||
Price history
1 event — show timeline
- 2026-05-01 Listed $89,900 SBOR
Cash-flow waterfall
monthlySold comps — $/sqft
last 12 mo · ≤1 miLoading sold comps…