 Multi-family
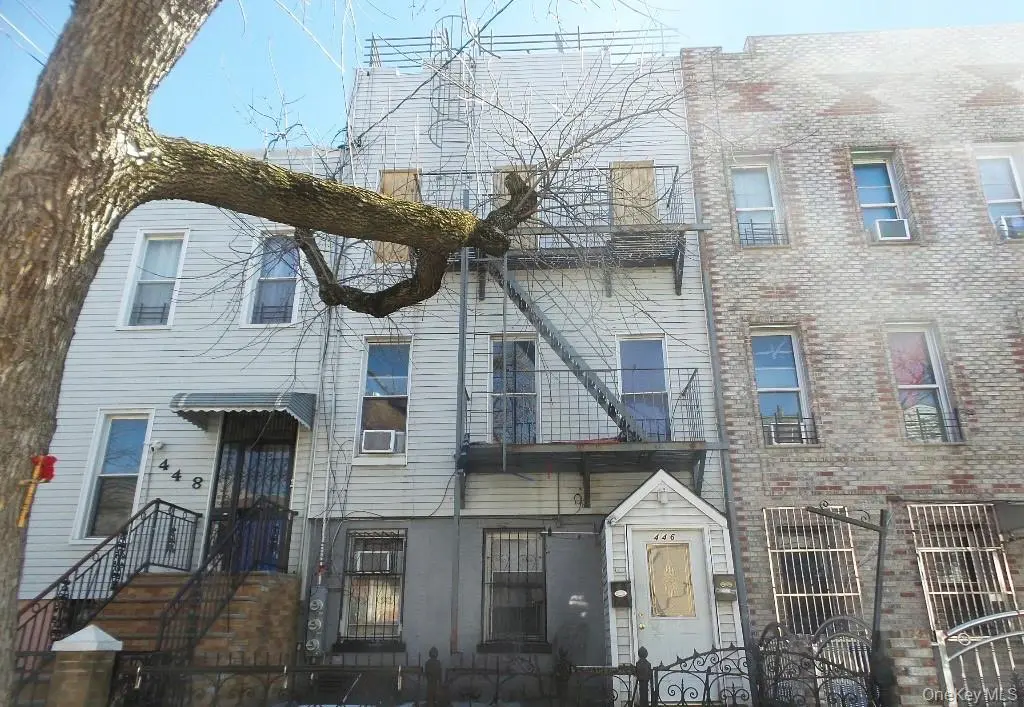
446 Harman St · New York, NY
Flood risk 1/10 · Minimal
- FEMA flood zone
- X (unshaded)
- Chance of flooding over 30 yrs
- 0.0%
- Est. flood insurance / yr
- $507 – $1,088
Fire risk 1/10 · Minimal
- Est. fire insurance / yr
- $691 – $1,283
Heat risk 6/10 · Moderate
- Hot days now (above 99°F)
- 7 days/yr
- Hot days in 30 yrs
- 15 days/yr
Wind risk 6/10 · Moderate
- Chance of severe wind over 30 yrs
- 40.0%
Air-quality risk 5/10 · Moderate
- Unhealthy air days now
- 6 days/yr
- Unhealthy air days in 30 yrs
- 8 days/yr
Risk factors via First Street. Map © Google.
Why this score? — see what drove the A- grade
The composite is a weighted blend of 9 inputs, each scored 0–100. Each bar is that input's sub-score; the figure is the points it added to the 100-point composite (weight × sub-score).
- Cash flow +25.9/30.0
- ARV discount +15.0/15.0
- Appreciation +10.0/10.0
- DSCR +8.7/10.0
- 1% rule +5.9/10.0
- Schools +5.0/10.0
- Livability +3.8/5.0
- Rent growth +3.7/5.0
- Condition / age +2.5/5.0
$924,900
🖨 Deal sheet (PDF) 📄 Offer letter ✓ Due diligence
Multi-family units
County records classify this as Multi-Family (2-4 Unit). Listing-text estimate: 1 unit. estimate disagrees with records
Listing remarks MLS
This property is located in the heart of Bushwick, Brooklyn. This is a prime value-add opportunity for investors looking to renovate and customize to their vision. Ideal for seasoned investors seeking rental income potential or long-term appreciation. Conveniently located near major bus lines, subway access, local parks, and neighborhood amenities. The building is presently occupied, and no rental income is being collected. It is being sold AS IS, subject to existing occupancy and any/all ECB and HPD violations. MLS Approve- No Financial provided due to no source of income
Key facts
- Subway access
- Near major bus lines
- Local parks
Tags
Property features AI
Exterior
- Parking: On-street parking
- Utilities: Con-Edison electric service; Public sewer; Electricity available
- Home design: Duplex
- Construction: Frame construction
- Exterior features: Frame construction; Not waterfront; No additional parcels
Interior
- Heating & cooling: Oil heating; No central cooling
- Interior features: Partial basement; Other interior features
Neighborhood map
What this means for you Summary
Snapshot
- This is a multifamily listed at $925k.
Deal economics
- At list price, monthly cash flow is $2k ($27k/yr) — positive.
- The deal already cash-flows at list — no discount required.
- Meets the 1% rule at list price ($10k rent vs $925k).
- Recommended offer: $911k (1.5% below list) — sets the bar for market timing.
- Cap rate 9.3% vs local median 2.6% in New York — top-decile yield for the area; either an underpriced asset or a hidden risk that comps aren't pricing in. Stress-test before assuming the spread holds.
Location & tenants
- Location reads 75/100 on livability (#268 in NY, #4,188 nationally) — a middle-class / working-renter tenant base. Strengths: amenities A+, commute A+, health & safety A; Watch: crime F, cost of living F.
- Market conditions: Rents rising fast (+4.8%/yr); 56 active listings in the ZIP; 8 comparable units currently listed for rent nearby; rentals leasing fast (median 6d on market — plan ~1-2 weeks tenant-placement turnaround); solid renter incomes; 10,063 units permitted in Kings County in 2024 (9,789 in 5+ unit buildings).
- At $10,049/mo this rent would consume 142% of the median local household income ($85k/yr) (locally 4577% of renters already pay >50% of income on rent) — very limited rent-growth headroom before tenants either downsize or default.
Forward outlook
- In year one you build about $99k of equity ($6k loan paydown + $92k appreciation (10.0% local appreciation)).
- Kings County population projected at +13% by 2050 — modest demand growth; plan on rents tracking national, not racing it.
- At projected returns (10.0% appreciation + 4.8% rent growth), your $259k cash investment doubles in ~2 years — after that, you're playing with house money.
- By year 2, paydown + projected appreciation supports a ~$159k cash-out refi (75% LTV) — recoverable capital for the next deal without selling this one.
Negotiation context
- It's been on market 22 days — a 2% lower offer ($911k) is reasonable based on typical stale-listing flexibility.
- 3 sale attempts since 13y ago with the ask held roughly flat each time — persistent listings suggest the price (not the market) is what's stuck; bring a comps-based counter.
- Current owner paid $175k; list at $925k implies a 429% gain — meaningful room to come down on a strong offer.
Risks & watch-outs
- Watch-outs: built in 1901 — expect roof / HVAC / electrical / plumbing capex.
- Climate carrying-cost: major wind risk, 40% chance of damaging wind over 30y; extreme-heat days projected 7→15/yr by 2055 (HVAC capex compounding) — expect insurance premiums to compound above CPI over the hold.
Questions for the listing agent
- Built in 1901 — when were the roof, HVAC, electrical panel, plumbing, and water heater last replaced?
- Is there a deadline driving the sale (1031 exchange, divorce, estate, relocation)? That informs how much negotiation room exists.
- Schools are B-rated — typically a magnet for longer-tenancy family renters. What's the average tenant stay here, and is there a school-zone premium baked into asking?
- Crime grade is F in this area — have there been break-ins, vandalism, or insurance claims at this property in the last 3 years? What carrier currently insures it and at what premium?
- What's the average days-on-market for RENTAL listings here right now (not sales)? A rising rental-DOM trend means longer vacancies and softer asking-rent achievability than the comps imply.
- What's the recent tenant-quality profile in this submarket — average credit score on applications, eviction rate, late-payment / NSF rate, and stable-employment percentage? A property-management company in the area should have these aggregated.
- How much new apartment / multifamily construction is in the pipeline within 1–3 miles? Heavy new supply (>2% of stock underway) typically softens rents 12–24 months out; light construction supports rent growth.
Investment metrics
- 1% rule
- 1.09% ✓
- Cap rate
- 9.26%
- Cash-on-cash
- 10.60%
- DSCR
- 1.47
- GRM
- 7.7
CMA / ARV
- ARV (on-the-fly)
- $1,594,080
- Comps found
- 12
Show comp detail 12 sales within ~0.75 mi
| Address | Dist | Beds/Ba | Sqft | Sold | Price | $/sf | Match |
|---|---|---|---|---|---|---|---|
| 16-91 Linden St | 0.26mi | 6/3.0 | 3,240 (0%) | 4mo | $1,635,000 | $505 | 84 |
| 474 Suydam St | 0.33mi | 7/3.0 | 3,200 (-1%) | 1mo | $1,670,000 | $522 | 81 |
| 248 Saint Nicholas Ave | 0.12mi | 11/3.0 | 3,300 (+2%) | 14mo | $1,625,000 | $492 | 80 |
| 16-16 Putnam Ave | 0.49mi | 5/3.0 | 3,120 (-4%) | 3mo | $1,750,000 | $561 | 68 |
| 994 Hart St | 0.25mi | 6/3.0 | 3,640 (+12%) | 3mo | $2,220,000 | $610 | 65 |
| 1220 Greene Ave | 0.59mi | 7/2.0 | 3,324 (+3%) | 4mo | $1,220,000 | $367 | 65 |
| 716 Woodward Ave | 0.56mi | —/— | 3,500 (+8%) | 2mo | $1,650,000 | $471 | 59 |
| 1234 Madison St | 0.60mi | 7/3.0 | 3,000 (-7%) | 3mo | $1,192,000 | $397 | 57 |
| 1285 Putnam Ave | 0.70mi | 5/3.0 | 2,850 (-12%) | 3mo | $1,100,000 | $386 | 45 |
| 2128 Rene Ct | 0.73mi | 1/1.0 | 2,886 (-11%) | 6mo | $1,030,000 | $357 | 42 |
| 1287 Putnam Ave | 0.69mi | 5/3.0 | 2,850 (-12%) | 9mo | $1,100,000 | $386 | 40 |
| 2135 Menahan St | 0.70mi | 7/5.0 | 2,760 (-15%) | 4mo | $1,450,000 | $525 | 39 |
Match score weights: distance 35% · size 25% · config 20% · recency 20%. Top-matched comps best support the ARV.
Projected returns pro-forma
10.0% appreciation · 4.78% rent growth · sell at horizon
- IRR
- 32.8%
- Equity multiple
- 3.58×
- Total profit
- $667,395
- Equity at exit
- $833,223
- IRR
- 28.8%
- Equity multiple
- 8.30×
- Total profit
- $1,890,178
- Equity at exit
- $1,796,877
Cash invested: $258,972 (down + closing). Projections, not guarantees.
Landlord ↔ Tenant lean methodology
- Overall (CITY)
- 0 Strongly Tenant-Friendly
- State New York
- 15 Strongly Tenant-Friendly · D+10
- County
- — inherits STATE
- City New York
- 0 Strongly Tenant-Friendly · D+34
ZIP-level market 11237
- Home prices YoY
- 3.1%
- Rents YoY
- 4.8%
- Active inventory
- 56
- Price-to-rent
- 23.0×
Monthly cashflow live
- Estimated rent
- $10,049 high interval (Pro) →
- Mortgage (P&I)
- −$4,850
- Tax from tax record
- −$416 /mo · $4,993/yr
- Insurance
- −$385
- HOA
- −$0
- Vacancy / Maint / Mgmt
- −$2,110
- Net cashflow
- $2,287
Break-even live
Sensitivity live
| Price | -10% $2,811 | -5% $2,549 | +0% $2,287 | +5% $2,025 | +10% $1,763 |
|---|---|---|---|---|---|
| Rent | -10% $1,493 | -5% $1,890 | +0% $2,287 | +5% $2,684 | +10% $3,081 |
| Rate | -1.0pp $2,753 | -0.5pp $2,522 | base $2,287 | +0.5pp $2,047 | +1.0pp $1,803 |
3-unit breakdown (identical units grouped — click to expand)
| Units | Beds | Baths | Est. rent |
|---|---|---|---|
| 3× units | 2 | 1 | $10,050 |
| #1 | 2 | 1 | $3,350 |
| #2 | 2 | 1 | $3,350 |
| #3 | 2 | 1 | $3,350 |
| Total (3 units) | $10,049 | ||
UW: 25.0% down · 7.5% · 30yr · 1.5% tax · 5.0% vac · 8.0% maint · 8.0% mgmt
Financing live
Cash to close
- Down payment
- $231,225
- Closing costs
- $27,747
- Reserves months
- —
- Total cash needed
- —
Loan-product check · same deal, 3 products live
Conventional
25% down · 7.5% · 30yr
- Down + closing
- —
- Monthly P&I
- —
- Monthly cashflow
- —
- DSCR
- —
- Eligible?
- —
Personal DTI + credit; lowest rate.
DSCR
20% down · 8.5% · 30yr
- Down + closing
- —
- Monthly P&I
- —
- Monthly cashflow
- —
- DSCR
- —
- Eligible?
- —
No personal income docs; deal must DSCR.
Hard money
10% down · 12.0% · 12mo
- Down + closing
- —
- Monthly P&I
- —
- Monthly cashflow
- —
- DSCR
- —
- Eligible?
- —
Short-term bridge; refi at stabilization.
Rent comps 8 comps
| Address | Beds | Baths | Sqft | Rent | $/sqft | DOM | Units | Dist |
|---|---|---|---|---|---|---|---|---|
| 1720 Menahan St Ridgewood, NY | 3.0 | 1.0 | 3252 | $3,500 | $1.08 | 25d | 1 | 0.25mi |
| 1823 Menahan St Ridgewood, NY | 2.0 | 1.0 | 2650 | $3,600 | $1.36 | 22d | 1 | 0.34mi |
| 7-87 Woodward Ave Unit 1L Ridgewood, NY | 2.0 | 1.0 | 3400 | $3,200 | $0.94 | 0d | 1 | 0.66mi |
| 60-88 67th Ave Unit 2 Flushing, NY | 3.0 | 1.0 | 3540 | $3,750 | $1.06 | 3d | 1 | 1.01mi |
| 60-08 78th Ave Unit 2 Glendale, NY | 3.0 | 1.0 | 2200 | $3,099 | $1.41 | 5d | 1 | 1.16mi |
| 69-46 64th St Unit 2R Flushing, NY | 1.0 | 1.0 | 3000 | $2,600 | $0.87 | 5d | 1 | 1.18mi |
| 7215 62nd St Glendale, NY | 2.0 | 1.0 | 3000 | $2,400 | $0.80 | 22d | 1 | 1.22mi |
| 6906 66th Pl Glendale, NY | 3.0 | 2.5 | 2308 | $5,900 | $2.56 | 3d | 1 | 1.41mi |
Listing history 10 events
-
2026-05-06$924,900 Active
-
2026-05-04price $924,900 583-char remark
Show marketing remark (583 chars)
This property is located in the heart of Bushwick, Brooklyn. This is a prime value-add opportunity for investors looking to renovate and customize to their vision. Ideal for seasoned investors seeking rental income potential or long-term appreciation. Conveniently located near major bus lines, subway access, local parks, and neighborhood amenities. The building is presently occupied, and no rental income is being collected. It is being sold AS IS, subject to existing occupancy and any/all ECB and HPD violations. MLS Approve- No Financial provided due to no source of income
-
2026-04-07price $959,900 583-char remark
Show marketing remark (583 chars)
This property is located in the heart of Bushwick, Brooklyn. This is a prime value-add opportunity for investors looking to renovate and customize to their vision. Ideal for seasoned investors seeking rental income potential or long-term appreciation. Conveniently located near major bus lines, subway access, local parks, and neighborhood amenities. The building is presently occupied, and no rental income is being collected. It is being sold AS IS, subject to existing occupancy and any/all ECB and HPD violations. MLS Approve- No Financial provided due to no source of income
-
2026-03-12price $999,900 583-char remark
Show marketing remark (583 chars)
This property is located in the heart of Bushwick, Brooklyn. This is a prime value-add opportunity for investors looking to renovate and customize to their vision. Ideal for seasoned investors seeking rental income potential or long-term appreciation. Conveniently located near major bus lines, subway access, local parks, and neighborhood amenities. The building is presently occupied, and no rental income is being collected. It is being sold AS IS, subject to existing occupancy and any/all ECB and HPD violations. MLS Approve- No Financial provided due to no source of income
-
2026-02-15price $1,039,900 583-char remark
Show marketing remark (583 chars)
This property is located in the heart of Bushwick, Brooklyn. This is a prime value-add opportunity for investors looking to renovate and customize to their vision. Ideal for seasoned investors seeking rental income potential or long-term appreciation. Conveniently located near major bus lines, subway access, local parks, and neighborhood amenities. The building is presently occupied, and no rental income is being collected. It is being sold AS IS, subject to existing occupancy and any/all ECB and HPD violations. MLS Approve- No Financial provided due to no source of income
-
2026-02-13$1,039,000 Active 583-char remark
Show marketing remark (583 chars)
This property is located in the heart of Bushwick, Brooklyn. This is a prime value-add opportunity for investors looking to renovate and customize to their vision. Ideal for seasoned investors seeking rental income potential or long-term appreciation. Conveniently located near major bus lines, subway access, local parks, and neighborhood amenities. The building is presently occupied, and no rental income is being collected. It is being sold AS IS, subject to existing occupancy and any/all ECB and HPD violations. MLS Approve- No Financial provided due to no source of income
-
2013-10-15historical
-
2013-10-08$325,000 New
-
1995-08-29soldstatus $175,000
-
1986-09-19soldstatus $95,000
ⓘ Source: listings_history table (triggers on properties + properties_extension) + one-shot
backfill from property_details.listing_events for pre-trigger history.
Tax reassessment forecast NY · Partial reset (capped growth)
- Current annual tax
- $4,993 · $416/mo
- Projected year-2 tax
- $10,312 · $859/mo
- Expected delta
- +$5,319/yr (+$443/mo · 106.5%)
ⓘ Screening estimate from a state-policy table — verify with the county assessor before closing.
Climate risk First Street
- Flood 1/10 Low FEMA zone X (unshaded) · 0% chance over 30 yrs
- Wildfire 1/10 Low
- Heat 6/10 Major 7 d/yr ≥99°F today · 15 d/yr by 30 yrs out
- Wind 6/10 Major 40% chance of damaging wind over 30 yrs
- Air quality 5/10 Major 6 unhealthy d/yr today · 8 by 30 yrs out
Nearby sold comps map
Loading sold comps map…
Walkable amenities ~0.75 mi
Loading nearby amenities…
Taxation est. · year 1
- Rental income
- $120,588
- − Mortgage interest
- −$51,809
- − Property taxes
- −$4,993
- − Insurance
- −$4,624
- − Repairs & maintenance
- −$9,647
- − Management
- −$9,647
- − Depreciation
- −$26,906
- Taxable income
- $12,961
- Est. tax owed @ 24.0%
- −$3,111
- After-tax cash flow
- $24,333/yr
For passive investors: Depreciation is non-cash, so a rental often shows a tax loss while cash-flowing — sheltering income. Rental losses are passive: they offset passive income freely, and up to $25,000/yr can offset ordinary (W-2) income if you actively participate and your MAGI is under $100k (phasing out to $0 by $150k); unused losses carry forward. On sale, claimed depreciation is recaptured at up to 25%, and gains may owe capital-gains tax (a 1031 exchange can defer both). Figures are a year-1 estimate at your 24.0% rate — not tax advice; consult a CPA.
Schools (NCES district)
No district data.
Livability — New York
- Score
- 75/100
- State rank
- #268
- US rank
- #4188
Category grades
Schools grade is shown separately in the Schools card above.
Census & demographics
- Census place
- New York, NY
- County
- Kings County · 2,614,986 people
- City population
- 7,731,280
- Metro
- New York-Newark-Jersey City, NY-NJ-PA
- Population (ZIP)
- 45,334
- Household income
- $85,196
- Rent vs Own
- Severe rent burden
- 4577.0
Population outlook (Kings County) Hauer SSP2
- Today (2025)
- 2,847,441 people
- By 2030
- 2,937,006 · +3.1%
- By 2040
- 3,095,491 · +8.7%
- By 2050
- 3,228,968 · +13.4%
- By 2075
- 3,321,723 · +16.7%
- By 2100
- 3,111,387 · +9.3%
Race, ethnicity, and origin ACS 2023
- Neighborhood character
- Diverse neighborhood (Simpson 0.65)
- Race & ethnicity
- Hispanic / Latino 52% White 26% Two or more races 17% Black 10% Asian 7% Native American 2%
- Hispanic origin (detail)
- Mexican 9% Puerto Rican 15% Cuban 1% Dominican 9%
- Common ancestry
- Romanian 2% Scotch-Irish 1% Lithuanian 1%
- Foreign-born
- 33% · Canada, China, Jamaica
- Languages at home
- 48% English-only · Spanish 41% Chinese 3% Other Indo-European 2%
Political lean MEDSL · Kings
- 2024 margin
- Solid D (+44.0) · D 72.0% · R 28.0%
- 2008→2024 swing
- -15.5pp toward R · 2008: 59.4pp · 2024: 44.0pp
- All cycles
- 2024: D+44.0 2020: D+54.8 2016: D+61.8 2012: D+63.9 2008: D+59.4
Not yet ingested
- Civics
- —
Market trends
- HPI YoY
- ▲ 14.38%
- Current HPI
- 481.1869
- Rent YoY
- ▲ 4.78%
- Metro
- New York-Newark-Jersey City, NY-NJ-PA
- State GDP YoY
- ▲ 2.60%
- F500 in state
- 92
Industry mix (Fortune 500 HQ in NY)
| Industry | F500 HQs | Revenue |
|---|---|---|
| Financial Services | 10 | $950B |
|
||
| Consumer Goods | 9 | $162B |
|
||
| Insurance | 4 | $225B |
|
||
| Telecommunications | 2 | $144B |
|
||
| Pharmaceuticals | 2 | $112B |
|
||
| Media / Entertainment | 2 | $69B |
|
||
Price history
+873.6% since first listed10 events — show timeline
- 2026-05-06 Listed $924,900 OneKey® MLS as Distributed by MLS Grid
- 2026-05-04 Price Changed $924,900 BNYMLS
- 2026-04-07 Price Changed $959,900 BNYMLS
- 2026-03-12 Price Changed $999,900 BNYMLS
- 2026-02-15 Price Changed $1,039,900 BNYMLS
- 2026-02-13 Listed $1,039,000 BNYMLS
- 2013-10-15 Listing Removed — OneKey® MLS as Distributed by MLS Grid
- 2013-10-08 Listed $325,000 OneKey® MLS as Distributed by MLS Grid
- 1995-08-29 Sold (Public Records) $175,000 Public Records
- 1986-09-19 Sold (Public Records) $95,000 Public Records
Property tax history
+5.8%/yrLatest (2025): $4,993 · +3.3% YoY. Source: county tax records.
Cash-flow waterfall
monthlySold comps — $/sqft
last 12 mo · ≤1 miLoading sold comps…