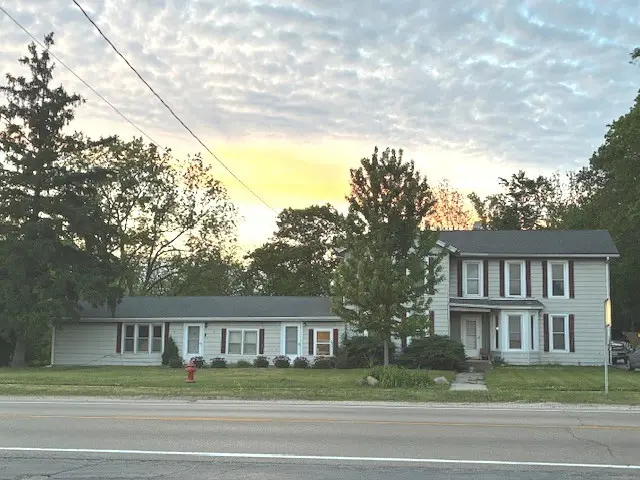
 Fourplex
722/724 W Grant Hwy · Marengo, IL
Flood risk 1/10 · Minimal
- FEMA flood zone
- X (unshaded)
- Chance of flooding over 30 yrs
- 0.0%
- Est. flood insurance / yr
- $473 – $860
Fire risk 1/10 · Minimal
- Est. fire insurance / yr
- $804 – $1,492
Heat risk 2/10 · Minimal
- Hot days now (above 102°F)
- 7 days/yr
- Hot days in 30 yrs
- 14 days/yr
Wind risk 2/10 · Minimal
- Chance of severe wind over 30 yrs
- —
Air-quality risk 3/10 · Minor
- Unhealthy air days now
- 2 days/yr
- Unhealthy air days in 30 yrs
- 3 days/yr
Risk factors via First Street. Map © Google.
Why this score? — see what drove the B- grade
The composite is a weighted blend of 9 inputs, each scored 0–100. Each bar is that input's sub-score; the figure is the points it added to the 100-point composite (weight × sub-score).
- Cash flow +30.0/30.0
- 1% rule +10.0/10.0
- DSCR +10.0/10.0
- ARV discount +7.5/15.0
- Schools +4.0/10.0
- Livability +3.2/5.0
- Rent growth +2.5/5.0
- Condition / age +2.2/5.0
- Appreciation +0.0/10.0
$395,000
🖨 Deal sheet 📄 Offer letter ✓ Due diligence
Multi-family units
County records classify this as Multi-Family (2-4 Unit). Listing-text estimate: 4 units. confirmed
Listing remarks
LOCATION, LOCATION, LOCATION!! Situated on Grant Highway (Rt 20.) here is a 4 unit, income producing property. The rents ($3,075 monthly)are below the present going rates, and could be adjusted, bringing in additional income in the range of $300-$400 easily. Separate electric bills. The . 6 of an acre has 125' frontage which encourages future development as it is in immediate B2 vicinity. .. all kinds of possible usages. .. as an added enticement, the adjoining property 704 W. Grant is also for sale. .. that parcel is . 55 acres. Purchase both and have 1.1 acre on Rt 20 . .. investors, give it some thought! Property being sold "AS IS" no exceptions.
Key facts
- 0.6 acre lot
- 4 garage spots
- Listed 22 days
Neighborhood map
What this means for you Summary
Snapshot
- This is a 4 × 2-bed/?-bath units multifamily listed at $395k. Condition is rated fair.
Deal economics
- At list price, monthly cash flow is $4k ($45k/yr) — positive. Per door: $930/mo.
- The deal already cash-flows at list — no discount required.
- Meets the 1% rule at list price ($8k rent vs $395k).
- Recommended offer: $389k (1.5% below list) — sets the bar for market timing.
- Cap rate 17.6% vs local median 4.2% in Marengo — top-decile yield for the area; either an underpriced asset or a hidden risk that comps aren't pricing in. Stress-test before assuming the spread holds.
Location & tenants
- Location reads 64/100 on livability (#708 in IL) — a middle-class / working-renter tenant base. Strengths: crime A+, cost of living A+, housing A+; Watch: amenities F, commute F, health & safety F.
- Marengo Chsd 154 (town): math 40% / reading 45% proficiency, ranked #240 of 919 in IL (top 26%) — families likely to look elsewhere, expect single-tenant / working-renter base with shorter leases.
- Zoned schools: Marengo High School (math 37% / reading 37%, grade F, #107 of 693 statewide, top 17%, 685 students, 0% FRL).
- Market conditions: 63 active listings in the ZIP; 1,595 units permitted in McHenry County in 2024 (485 in 5+ unit buildings).
Forward outlook
- Local home prices are declining (-3.0%/yr); year-one equity from $3k of loan paydown is wiped out by about $12k of value loss. Plan a longer hold.
- McHenry County population projected at -12% by 2050 — secular population decline; favor cash flow + early exit over multi-decade hold.
- At projected returns (-3.0% appreciation + 3.0% rent growth), your $111k cash investment doubles in ~3 years — after that, you're playing with house money.
Negotiation context
- It's been on market 23 days — a 2% lower offer ($389k) is reasonable based on typical stale-listing flexibility.
Questions for the listing agent
- Can we see the unit-by-unit rent roll, current vacancy, and any below-market leases? What's the average tenancy length?
- What capital expenditures (roof, boiler, parking lot, exteriors) have been made in the last 5 years, and what's planned in the next 2?
- Have any recent inspections been done? Can we get a copy of the seller's disclosures and any deferred-maintenance estimates?
- Is there a deadline driving the sale (1031 exchange, divorce, estate, relocation)? That informs how much negotiation room exists.
- What's the average days-on-market for RENTAL listings here right now (not sales)? A rising rental-DOM trend means longer vacancies and softer asking-rent achievability than the comps imply.
- What's the recent tenant-quality profile in this submarket — average credit score on applications, eviction rate, late-payment / NSF rate, and stable-employment percentage? A property-management company in the area should have these aggregated.
- How much new apartment / multifamily construction is in the pipeline within 1–3 miles? Heavy new supply (>2% of stock underway) typically softens rents 12–24 months out; light construction supports rent growth.
Investment metrics
- 1% rule
- 2.07% ✓
- Cap rate
- 17.60%
- Cash-on-cash
- 40.37%
- DSCR
- 2.80
- GRM
- 4.0
CMA / ARV
No comps found within radius.
Projected returns pro-forma
-3.0% appreciation · 3.0% rent growth · sell at horizon
- IRR
- 36.8%
- Equity multiple
- 2.56×
- Total profit
- $173,083
- Equity at exit
- $58,896
- IRR
- 43.4%
- Equity multiple
- 5.13×
- Total profit
- $456,350
- Equity at exit
- $34,152
Cash invested: $110,600 (down + closing). Projections, not guarantees.
Landlord ↔ Tenant lean methodology
- Overall (STATE)
- 43 Moderately Tenant-Leaning
- State Illinois
- 43 Moderately Tenant-Leaning · D+7
- County
- — inherits STATE
- City
- — inherits STATE
ZIP-level market 60152
- Home prices YoY
- -22.7%
- Active inventory
- 63
- Price-to-rent
- 16.1×
Monthly cashflow live
- Estimated rent
- $8,165 high interval (Pro) →
- Mortgage (P&I)
- −$2,071
- Tax est. 1.5%
- −$494 /mo · $5,925/yr
- Insurance
- −$165
- HOA
- −$0
- Vacancy / Maint / Mgmt
- −$1,715
- Net cashflow
- $3,721
Break-even live
4-unit breakdown (identical units grouped — click to expand)
| Units | Beds | Baths | Est. rent |
|---|---|---|---|
| 4× units | 2 | — | $8,164 |
| #1 | 2 | — | $2,041 |
| #2 | 2 | — | $2,041 |
| #3 | 2 | — | $2,041 |
| #4 | 2 | — | $2,041 |
| Total (4 units) | $8,165 | ||
UW: 25.0% down · 7.5% · 30yr · 1.5% tax · 5.0% vac · 8.0% maint · 8.0% mgmt
Financing live
Cash to close
- Down payment
- $98,750
- Closing costs
- $11,850
- Reserves months
- —
- Total cash needed
- —
Loan-product check · same deal, 3 products live
Conventional
25% down · 7.5% · 30yr
- Down + closing
- —
- Monthly P&I
- —
- Monthly cashflow
- —
- DSCR
- —
- Eligible?
- —
Personal DTI + credit; lowest rate.
DSCR
20% down · 8.5% · 30yr
- Down + closing
- —
- Monthly P&I
- —
- Monthly cashflow
- —
- DSCR
- —
- Eligible?
- —
No personal income docs; deal must DSCR.
Hard money
10% down · 12.0% · 12mo
- Down + closing
- —
- Monthly P&I
- —
- Monthly cashflow
- —
- DSCR
- —
- Eligible?
- —
Short-term bridge; refi at stabilization.
Listing history 15 events
-
2026-06-18days on market $395,000 Active 23 DOM
-
2026-06-17days on market $395,000 Active 22 DOM
-
2026-06-16days on market $395,000 Active 21 DOM
-
2026-06-15days on market $395,000 Active 20 DOM
-
2026-06-13days on market $395,000 Active 18 DOM
-
2026-06-13days on market $395,000 Active 17 DOM
-
2026-06-09days on market $395,000 Active 14 DOM
-
2026-06-08days on market $395,000 Active 13 DOM
-
2026-06-07days on market $395,000 Active 12 DOM
-
2026-06-04days on market $395,000 Active 9 DOM
-
2026-06-03days on market $395,000 Active 8 DOM
-
2026-06-02days on market $395,000 Active 7 DOM
-
2026-06-01days on market $395,000 Active 6 DOM
-
2026-05-31days on market $395,000 Active 5 DOM
-
2026-05-21historical $395,000
ⓘ Source: listings_history table (triggers on properties + properties_extension) + one-shot
backfill from property_details.listing_events for pre-trigger history.
Climate risk First Street
- Flood 1/10 Low FEMA zone X (unshaded) · 0% chance over 30 yrs
- Wildfire 1/10 Low
- Heat 2/10 Low 7 d/yr ≥102°F today · 14 d/yr by 30 yrs out
- Wind 2/10 Low
- Air quality 3/10 Moderate 2 unhealthy d/yr today · 3 by 30 yrs out
Nearby sold comps map
Loading sold comps map…
Walkable amenities ~0.75 mi
Loading nearby amenities…
Taxation est. · year 1
- Rental income
- $97,980
- − Mortgage interest
- −$22,126
- − Property taxes
- −$5,925
- − Insurance
- −$1,975
- − Repairs & maintenance
- −$7,838
- − Management
- −$7,838
- − Depreciation
- −$11,491
- Taxable income
- $40,786
- Est. tax owed @ 24.0%
- −$9,789
- After-tax cash flow
- $34,858/yr
For passive investors: Depreciation is non-cash, so a rental often shows a tax loss while cash-flowing — sheltering income. Rental losses are passive: they offset passive income freely, and up to $25,000/yr can offset ordinary (W-2) income if you actively participate and your MAGI is under $100k (phasing out to $0 by $150k); unused losses carry forward. On sale, claimed depreciation is recaptured at up to 25%, and gains may owe capital-gains tax (a 1031 exchange can defer both). Figures are a year-1 estimate at your 24.0% rate — not tax advice; consult a CPA.
Condition & rehab AI · 2 photos
This 4-unit property requires moderate exterior repairs and maintenance, including painting and roof repair. Upgrades will significantly enhance its curb appeal and value.
Repairs flagged
- Moderate exterior siding — Weathered and faded
- Moderate roof — Aged appearance
Value-add opportunities
- Both paint exterior — Fresh paint enhances curb appeal and value
- Both repair roof — A new roof improves the home's condition and value
Renovation cost estimate screening
| Repair item | Severity | Est. cost |
|---|---|---|
| exterior siding · Weathered and faded | Moderate | $3,000–15,000 |
| roof · Aged appearance | Moderate | $3,000–15,000 |
| Total estimated repair cost · 2 items | $6,000–30,000 |
Value-add ROI direction
- Both paint exterior — Fresh paint enhances curb appeal and value ↑
- Both repair roof — A new roof improves the home's condition and value ↑
ⓘ Cost ranges are severity-bucket heuristics (US national rule-of-thumb). Get contractor quotes + a written scope before underwriting a rehab budget.
Schools (NCES district)
- District
- Marengo Chsd 154
- NCES district ID
- 1724570
- Math proficiency
- 40% ▼ -5.00%
- Reading proficiency
- 45% ▲ 5.00%
- Median HH income
- $65,606
- Composite
- 40.37/100
- National rank
- #7752
- State rank
- #240 of 919 in IL
Livability — Marengo
- Score
- 64/100
- State rank
- #708
- US rank
- #14374
Category grades
Schools grade is shown separately in the Schools card above.
Census & demographics
- Census place
- Marengo, IL
- Population (ZIP)
- 12,006
Population outlook (McHenry County) Hauer SSP2
- Today (2025)
- 305,342 people
- By 2030
- 301,491 · -1.3%
- By 2040
- 288,211 · -5.6%
- By 2050
- 268,430 · -12.1%
- By 2075
- 226,209 · -25.9%
- By 2100
- 181,247 · -40.6%
Race, ethnicity, and origin ACS 2023
- Neighborhood character
- Predominantly White (88%)
- Race & ethnicity
- White 88% Hispanic / Latino 9% Two or more races 5%
- Hispanic origin (detail)
- Mexican 8%
- Common ancestry
- Romanian 10% Portuguese 1% Italian 1%
- Foreign-born
- 5% · Canada
- Languages at home
- 92% English-only · Spanish 6% Russian/Polish/Slavic 1% German/W. Germanic 1%
Political lean MEDSL · McHenry
- 2024 margin
- Lean R (+5.3) · D 46.6% · R 51.9% · Other 1.5%
- 2008→2024 swing
- -10.6pp toward R · 2008: 5.3pp · 2024: -5.3pp
- All cycles
- 2024: R+5.3 2020: R+2.5 2016: R+8.1 2012: R+8.8 2008: D+5.3
Not yet ingested
- Civics
- —
Market trends
- HPI YoY
- ▼ -66.07%
- Current HPI
- 224.4483
- Rent YoY
- —
- Metro
- —
- State GDP YoY
- ▲ 1.59%
- F500 in state
- 60
Industry mix (Fortune 500 HQ in IL)
| Industry | F500 HQs | Revenue |
|---|---|---|
| Insurance | 4 | $201B |
|
||
| Consumer Goods | 4 | $87B |
|
||
| Industrial Machinery | 3 | $64B |
|
||
| Healthcare | 2 | $55B |
|
||
| Retail / Pharmacy | 1 | $148B |
|
||
| Agriculture / Food | 1 | $86B |
|
||
Price history
1 event — show timeline
- 2026-05-21 Coming Soon $395,000 MRED as Distributed by MLS Grid
Cash-flow waterfall
monthlySold comps — $/sqft
last 12 mo · ≤1 miLoading sold comps…