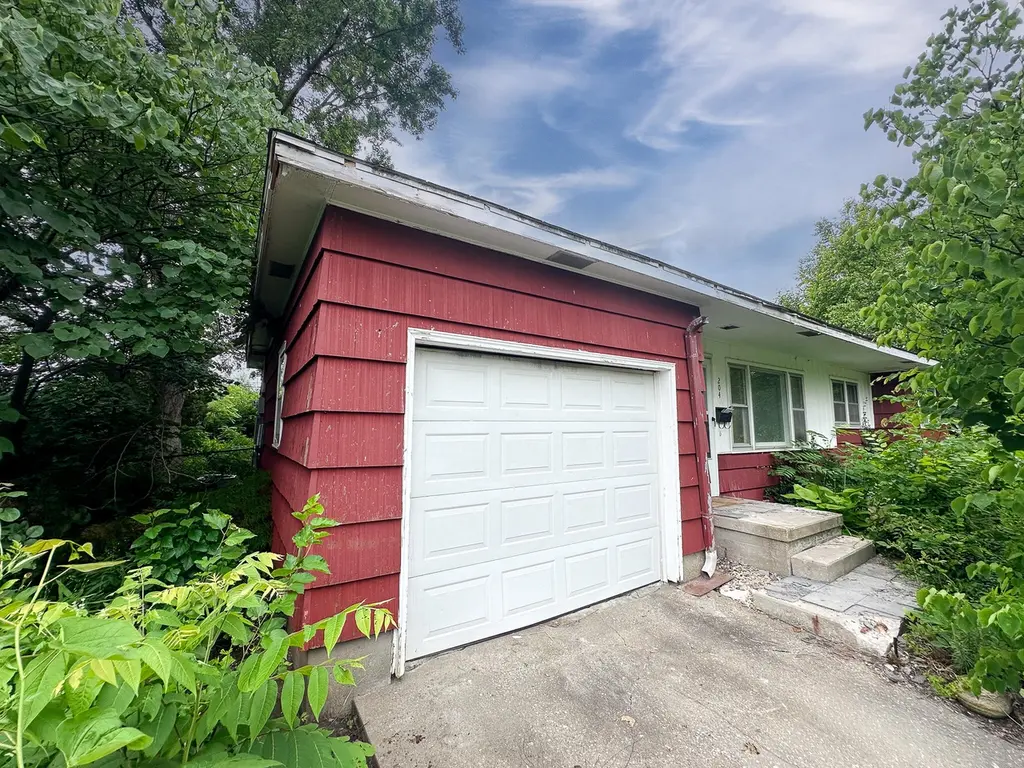
204 W Texas Ave · Columbia, MO
Flood risk 1/10 · Minimal
- FEMA flood zone
- X (unshaded)
- Chance of flooding over 30 yrs
- 0.0%
- Est. flood insurance / yr
- $473 – $860
Fire risk 1/10 · Minimal
- Est. fire insurance / yr
- $1,054 – $1,958
Heat risk 4/10 · Minor
- Hot days now (above 108°F)
- 7 days/yr
- Hot days in 30 yrs
- 19 days/yr
Wind risk 2/10 · Minimal
- Chance of severe wind over 30 yrs
- —
Air-quality risk 1/10 · Minimal
- Unhealthy air days now
- 0 days/yr
- Unhealthy air days in 30 yrs
- 0 days/yr
Risk factors via First Street. Map © Google.
Why this score? — see what drove the B+ grade
The composite is a weighted blend of 9 inputs, each scored 0–100. Each bar is that input's sub-score; the figure is the points it added to the 100-point composite (weight × sub-score).
- Cash flow +30.0/30.0
- ARV discount +15.0/15.0
- DSCR +10.0/10.0
- 1% rule +8.3/10.0
- Livability +4.2/5.0
- Rent growth +4.0/5.0
- Schools +3.1/10.0
- Condition / age +2.5/5.0
- Appreciation +0.0/10.0
$135,000
🖨 Deal sheet 📄 Offer letter ✓ Due diligence
Listing remarks MLS
MN K, LR, 3BR, B, UTR CUTE STARTER HOME REFINISHED HARDWOOD FLOORS LARGE SHADED FENCED BACKYARD NO SELLER DISCLOSURE PROVIDED
Key facts
- 0.32 acre lot
- Garage
- Listed 9 days
Property features AI
Exterior
- Parking: Attached garage (1 car)
- Home design: Single-family residence; Residential property
- Exterior features: Lot dimensions approximately 85 x 165.2; Subdivision: PARKADE HILLS
Interior
- Bedrooms: 1 total room (see room layout for details)
- Bathrooms: 1 full bathroom
- Interior features: Crawl space
Neighborhood map
What this means for you Summary
Snapshot
- This is a 3-bed/1.0-bath single-family listed at $135k.
Deal economics
- At list price, monthly cash flow is $533 ($6k/yr) — positive.
- The deal already cash-flows at list — no discount required.
- Meets the 1% rule at list price ($2k rent vs $135k).
- Cap rate 11.0% vs local median 2.9% in Columbia — top-decile yield for the area; either an underpriced asset or a hidden risk that comps aren't pricing in. Stress-test before assuming the spread holds.
Location & tenants
- Location reads 83/100 on livability (#9 in MO, #862 nationally) — a professional / high-income tenant draw. Strengths: amenities A+, commute A+, cost of living A+; Watch: crime D+.
- Columbia 93 (urban): math 30% / reading 43% proficiency, ranked #194 of 324 in MO (top 60%) — families likely to look elsewhere, expect single-tenant / working-renter base with shorter leases.
- Zoned schools: Parkade Elem. (math 12% / reading 27%, grade F, #941 of 1,115 statewide, top 86%, 364 students, 55% FRL); West Middle School (math 22% / reading 36%, grade F, #300 of 391 statewide, top 77%, 504 students, 58% FRL); David H. Hickman High (math 27% / reading 55%, grade F, #236 of 521 statewide, top 45%, 2,044 students, 33% FRL).
- Market conditions: Rents rising fast (+6.0%/yr); 351 active listings in the ZIP; 40 comparable units currently listed for rent nearby; rentals lingering (median 44d on market — plan ~5-8 weeks vacancy on turnover, expect pricing pressure); 55% of comp listings sitting > 30 days — soft ceiling on asking rent; 1,303 units permitted in Boone County in 2024 (549 in 5+ unit buildings).
Forward outlook
- Local home prices are declining (-3.0%/yr); year-one equity from $933 of loan paydown is wiped out by about $4k of value loss. Plan a longer hold.
- Boone County population projected at +36% by 2050 — long-run rental-demand tailwind backs the buy-and-hold thesis.
- At projected returns (-3.0% appreciation + 6.0% rent growth), your $38k cash investment doubles in ~6 years — after that, you're playing with house money.
Negotiation context
- Only 9 days on market — expect competitive offers; lowballing is unlikely to land.
- 3 sale attempts since 29y ago with the ask held roughly flat each time — persistent listings suggest the price (not the market) is what's stuck; bring a comps-based counter.
Risks & watch-outs
- Watch-outs: built in 1958 — expect roof / HVAC / electrical / plumbing capex.
Questions for the listing agent
- Built in 1958 — when were the roof, HVAC, electrical panel, plumbing, and water heater last replaced?
- Is there a deadline driving the sale (1031 exchange, divorce, estate, relocation)? That informs how much negotiation room exists.
- Schools are B-rated — typically a magnet for longer-tenancy family renters. What's the average tenant stay here, and is there a school-zone premium baked into asking?
- Crime grade is D in this area — have there been break-ins, vandalism, or insurance claims at this property in the last 3 years? What carrier currently insures it and at what premium?
- What's the average days-on-market for RENTAL listings here right now (not sales)? A rising rental-DOM trend means longer vacancies and softer asking-rent achievability than the comps imply.
- What's the recent tenant-quality profile in this submarket — average credit score on applications, eviction rate, late-payment / NSF rate, and stable-employment percentage? A property-management company in the area should have these aggregated.
- How much new for-sale + rental construction is in the pipeline within 1–3 miles? Heavy new supply typically softens prices + rents 12–24 months out; constrained supply supports both.
Investment metrics
- 1% rule
- 1.33% ✓
- Cap rate
- 11.03%
- Cash-on-cash
- 16.92%
- DSCR
- 1.75
- GRM
- 6.3
CMA / ARV
- ARV (on-the-fly)
- $186,550
- Comps found
- 12
Show comp detail 12 sales within ~0.75 mi
| Address | Dist | Beds/Ba | Sqft | Sold | Price | $/sf | Match |
|---|---|---|---|---|---|---|---|
| 210 W Texas Ave | 0.03mi | 3/1.5 | 1,060 (+3%) | 3mo | $225,000 | $212 | 89 |
| 1909 Bear Creek Dr | 0.21mi | 3/1.0 | 1,131 (+10%) | 2mo | $159,000 | $141 | 72 |
| 102 E Sexton Rd | 0.75mi | 2/1.0 (-1) | 1,022 (-0%) | 2mo | $184,000 | $180 | 58 |
| 1000 Hardin St | 0.72mi | 2/1.0 (-1) | 1,025 (0%) | 6mo | $205,000 | $200 | 56 |
| 1106 Jefferson St | 0.43mi | 3/1.0 | 1,140 (+11%) | 7mo | $169,900 | $149 | 55 |
| 1001 Jefferson St | 0.55mi | 3/1.0 | 956 (-7%) | 10mo | $210,000 | $220 | 55 |
| 713 Ridgeway Ave | 0.69mi | 3/1.0 | 1,106 (+8%) | 3mo | $182,000 | $165 | 52 |
| 506 Jackson St | 0.53mi | 2/1.5 (-1) | 960 (-6%) | 8mo | $175,000 | $182 | 51 |
| 515 Jackson St | 0.49mi | 3/1.0 | 912 (-11%) | 12mo | $180,000 | $197 | 49 |
| 112 W Thurman St | 0.53mi | 3/1.0 | 1,154 (+13%) | 10mo | $159,000 | $138 | 46 |
| 1007 Jefferson St | 0.52mi | 3/2.0 | 1,168 (+14%) | 6mo | $254,900 | $218 | 44 |
| 1003 Clayton St | 0.67mi | 2/1.0 (-1) | 907 (-12%) | 13mo | $149,000 | $164 | 34 |
Match score weights: distance 35% · size 25% · config 20% · recency 20%. Top-matched comps best support the ARV.
Projected returns pro-forma
-3.0% appreciation · 5.96% rent growth · sell at horizon
- IRR
- 11.3%
- Equity multiple
- 1.46×
- Total profit
- $17,550
- Equity at exit
- $20,129
- IRR
- 22.5%
- Equity multiple
- 3.19×
- Total profit
- $82,906
- Equity at exit
- $11,672
Cash invested: $37,800 (down + closing). Projections, not guarantees.
Landlord ↔ Tenant lean methodology
- Overall (STATE)
- 81 Strongly Landlord-Friendly
- State Missouri
- 81 Strongly Landlord-Friendly · R+10
- County
- — inherits STATE
- City
- — inherits STATE
ZIP-level market 65202
- Rents YoY
- 6.0%
- Active inventory
- 351
- Price-to-rent
- 6.3×
Monthly cashflow live
- Estimated rent
- $1,790 high interval (Pro) →
- Mortgage (P&I)
- −$708
- Tax from tax record
- −$117 /mo · $1,406/yr
- Insurance
- −$56
- HOA
- −$0
- Vacancy / Maint / Mgmt
- −$376
- Net cashflow
- $533
Break-even live
UW: 25.0% down · 7.5% · 30yr · 1.5% tax · 5.0% vac · 8.0% maint · 8.0% mgmt
Financing live
Cash to close
- Down payment
- $33,750
- Closing costs
- $4,050
- Reserves months
- —
- Total cash needed
- —
Loan-product check · same deal, 3 products live
Conventional
25% down · 7.5% · 30yr
- Down + closing
- —
- Monthly P&I
- —
- Monthly cashflow
- —
- DSCR
- —
- Eligible?
- —
Personal DTI + credit; lowest rate.
DSCR
20% down · 8.5% · 30yr
- Down + closing
- —
- Monthly P&I
- —
- Monthly cashflow
- —
- DSCR
- —
- Eligible?
- —
No personal income docs; deal must DSCR.
Hard money
10% down · 12.0% · 12mo
- Down + closing
- —
- Monthly P&I
- —
- Monthly cashflow
- —
- DSCR
- —
- Eligible?
- —
Short-term bridge; refi at stabilization.
Rent comps 40 comps
| Address | Beds | Baths | Sqft | Rent | $/sqft | DOM | Units | Dist |
|---|---|---|---|---|---|---|---|---|
| 1502 Parkade Blvd Unit 2 Columbia, MO | 2.0 | 1.0 | 700 | $950 | $1.36 | 43d | 1 | 0.21mi |
| 301 W Forest Ave Columbia, MO | 3.0 | 2.0 | 1162 | $1,395 | $1.20 | 13d | 1 | 0.45mi |
| 613 Bear Valley Ct Columbia, MO | 3.0 | 1.0 | 1206 | $1,600 | $1.33 | 21d | 1 | 0.62mi |
| 2011 Bridgewater Dr Columbia, MO | 3.0 | 2.0 | 1436 | $1,825 | $1.27 | 21d | 1 | 0.65mi |
| 1600 Parkside Dr Columbia, MO | 2.0 | 1.0 | 885 | $950 | $1.07 | 43d | 1 | 0.68mi |
| 1009 Hardin St Columbia, MO | 2.0 | 2.0 | 1300 | $1,500 | $1.15 | 21d | 1 | 0.73mi |
| 1003 Hardin St Columbia, MO | 2.0 | 1.0 | 950 | $1,100 | $1.16 | 43d | 1 | 0.75mi |
| 607 Ridgeway Ave Columbia, MO | 2.0 | 1.0 | 728 | $1,300 | $1.79 | 43d | 1 | 0.78mi |
| 20 Blue Ridge Rd Unit 202 Columbia, MO | 2.0 | 2.0 | 1100 | $1,500 | $1.36 | 21d | 1 | 0.89mi |
| 309 Alexander Ave Columbia, MO | 2.0 | 1.0 | 728 | $1,200 | $1.65 | 13d | 1 | 0.97mi |
| 812 Again St Columbia, MO | 2.0 | 1.0 | 780 | $1,300 | $1.67 | 44d | 1 | 0.99mi |
| 302 Alexander Ave Columbia, MO | 3.0 | 2.0 | 1296 | $1,350 | $1.04 | 21d | 1 | 1.00mi |
| 319 West Blvd N Columbia, MO | 4.0 | 2.0 | 1456 | $2,800 | $1.92 | 43d | 1 | 1.15mi |
| 215 West Blvd N Columbia, MO | 4.0 | 2.0 | 1456 | $2,800 | $1.92 | 43d | 1 | 1.17mi |
| 215 West Blvd N Columbia, MO | 4.0 | 2.0 | 1456 | $2,800 | $1.92 | 13d | 1 | 1.17mi |
| 103 N Garth Ave Columbia, MO | 3.0 | 2.0 | 1196 | $2,950 | $2.47 | 21d | 1 | 1.18mi |
| 205 West Blvd N Columbia, MO | 4.0 | 2.0 | 1456 | $1,550 | $1.06 | 43d | 1 | 1.19mi |
| 403 N 9th St Columbia, MO | 3.0 | 2.0 | 1397 | $1,800 | $1.29 | 13d | 1 | 1.19mi |
| 1007 W Ash St Columbia, MO | 4.0 | 2.0 | 1456 | $1,550 | $1.06 | 43d | 1 | 1.21mi |
| 212 Wheaton Ct Columbia, MO | 3.0 | 2.0 | 1456 | $2,800 | $1.92 | 21d | 1 | 1.21mi |
| 1011 W Ash St Columbia, MO | 4.0 | 2.0 | 1456 | $1,550 | $1.06 | 43d | 1 | 1.21mi |
| 1311 W Worley St Columbia, MO | 3.0 | 1.0 | 944 | $1,500 | $1.59 | 21d | 1 | 1.22mi |
| 210 Wheaton Ct Columbia, MO | 3.0 | 2.0 | 1456 | $1,550 | $1.06 | 43d | 1 | 1.22mi |
| 215 Wheaton Ct Columbia, MO | 3.0 | 2.0 | 1456 | $1,550 | $1.06 | 43d | 1 | 1.22mi |
| 211 Wheaton Ct Columbia, MO | 3.0 | 2.0 | 1456 | $1,550 | $1.06 | 43d | 1 | 1.23mi |
| 204 Wheaton Ct Columbia, MO | 3.0 | 2.0 | 1456 | $2,800 | $1.92 | 43d | 1 | 1.23mi |
| 205 Wheaton Ct Columbia, MO | 3.0 | 2.0 | 1456 | $2,800 | $1.92 | 43d | 1 | 1.24mi |
| 205 Wheaton Ct Columbia, MO | 3.0 | 2.0 | 1456 | $2,800 | $1.92 | 13d | 1 | 1.24mi |
| 202 Wheaton Ct Columbia, MO | 3.0 | 2.0 | 1456 | $2,800 | $1.92 | 43d | 1 | 1.24mi |
| 207 Wheaton Ct Columbia, MO | 3.0 | 2.0 | 1456 | $2,800 | $1.92 | 21d | 1 | 1.24mi |
| 203 Wheaton Ct Columbia, MO | 3.0 | 2.0 | 1456 | $2,800 | $1.92 | 43d | 1 | 1.25mi |
| 1009 Otto Ct Columbia, MO | 2.0 | 1.0 | 1210 | $1,230 | $1.02 | 21d | 1 | 1.25mi |
| 201 Wheaton Ct Columbia, MO | 3.0 | 2.0 | 1456 | $2,800 | $1.92 | 13d | 1 | 1.25mi |
| 201 Wheaton Ct Columbia, MO | 3.0 | 2.0 | 1456 | $2,800 | $1.92 | 43d | 1 | 1.25mi |
| 105 Clinton Dr Columbia, MO | 2.0 | 1.0 | 830 | $1,300 | $1.57 | 21d | 1 | 1.33mi |
| 113 Crestmere Ave Unit 101 Columbia, MO | 2.0 | 1.0 | 1300 | $3,000 | $2.31 | 43d | 1 | 1.34mi |
| 113 Crestmere Ave Unit 201 Columbia, MO | 2.0 | 1.0 | 1022 | $1,750 | $1.71 | 43d | 1 | 1.34mi |
| 1409 Paris Rd Unit 101 Columbia, MO | 4.0 | 2.0 | 1468 | $3,200 | $2.18 | 43d | 1 | 1.38mi |
| 1103 W Broadway Unit 1121B;1/2HW Columbia, MO | 2.0 | 2.0 | 1200 | $1,395 | $1.16 | 43d | 1 | 1.41mi |
| 5 S Greenwood Ave Columbia, MO | 2.0 | 1.0 | 1104 | $1,600 | $1.45 | 21d | 1 | 1.42mi |
Listing history 8 events
-
2026-06-17statusdays on market $135,000 Pending 9 DOM
-
2026-06-16days on market $135,000 Active 8 DOM
-
2026-06-15days on market $135,000 Active 7 DOM
-
2026-06-14days on market $135,000 Active 5 DOM
-
2026-06-13days on market $135,000 Active 4 DOM
-
2026-06-10days on market $135,000 Active 2 DOM
-
2026-06-09remarks 147-char remark
-
2026-06-09$135,000 Active 1 DOM
ⓘ Source: listings_history table (triggers on properties + properties_extension) + one-shot
backfill from property_details.listing_events for pre-trigger history.
Tax reassessment forecast MO · Resets to sale price
- Current annual tax
- $1,406 · $117/mo
- Projected year-2 tax
- $1,406 · $117/mo
- Expected delta
- $0/yr ($0/mo · 0.0%)
ⓘ Screening estimate from a state-policy table — verify with the county assessor before closing.
Climate risk First Street
- Flood 1/10 Low FEMA zone X (unshaded) · 0% chance over 30 yrs
- Wildfire 1/10 Low
- Heat 4/10 Moderate 7 d/yr ≥108°F today · 19 d/yr by 30 yrs out
- Wind 2/10 Low
- Air quality 1/10 Low 0 unhealthy d/yr today · 0 by 30 yrs out
Nearby sold comps map
Loading sold comps map…
Walkable amenities ~0.75 mi
Loading nearby amenities…
Taxation est. · year 1
- Rental income
- $21,483
- − Mortgage interest
- −$7,562
- − Property taxes
- −$1,406
- − Insurance
- −$675
- − Repairs & maintenance
- −$1,719
- − Management
- −$1,719
- − Depreciation
- −$3,927
- Taxable income
- $4,475
- Est. tax owed @ 24.0%
- −$1,074
- After-tax cash flow
- $5,321/yr
For passive investors: Depreciation is non-cash, so a rental often shows a tax loss while cash-flowing — sheltering income. Rental losses are passive: they offset passive income freely, and up to $25,000/yr can offset ordinary (W-2) income if you actively participate and your MAGI is under $100k (phasing out to $0 by $150k); unused losses carry forward. On sale, claimed depreciation is recaptured at up to 25%, and gains may owe capital-gains tax (a 1031 exchange can defer both). Figures are a year-1 estimate at your 24.0% rate — not tax advice; consult a CPA.
Schools (NCES district)
- District
- Columbia 93
- NCES district ID
- 2901000
- Math proficiency
- 30% ▼ -12.00%
- Reading proficiency
- 43% ▼ -4.00%
- Median HH income
- $46,547
- Composite
- 31.21/100
- National rank
- #6036
- State rank
- #194 of 324 in MO
Livability — Columbia
- Score
- 83/100
- State rank
- #9
- US rank
- #862
Category grades
Schools grade is shown separately in the Schools card above.
Census & demographics
- Census place
- Columbia, MO
- County
- Boone County · 158,877 people
- City population
- 158,877
- Metro
- Columbia, MO
- Population (ZIP)
- 47,327
- Household income
- $72,289
- Rent vs Own
- Severe rent burden
- 1326.0
Population outlook (Boone County) Hauer SSP2
- Today (2025)
- 202,891 people
- By 2030
- 217,799 · +7.3%
- By 2040
- 246,789 · +21.6%
- By 2050
- 276,116 · +36.1%
- By 2075
- 348,426 · +71.7%
- By 2100
- 400,856 · +97.6%
Race, ethnicity, and origin ACS 2023
- Neighborhood character
- Predominantly White (68%)
- Race & ethnicity
- White 68% Black 16% Two or more races 8% Hispanic / Latino 6% Asian 3%
- Hispanic origin (detail)
- Mexican 4%
- Common ancestry
- Lithuanian 2% Italian 2% Slovak 2%
- Foreign-born
- 6% · Canada, South Korea
- Languages at home
- 91% English-only · Spanish 3% Other Asian/Pacific 1% French/Haitian/Cajun 1%
Political lean MEDSL · Boone
- 2024 margin
- Lean D (+9.8) · D 53.9% · R 44.1% · Other 2.1%
- 2008→2024 swing
- -2.2pp toward R · 2008: 12.0pp · 2024: 9.8pp
- All cycles
- 2024: D+9.8 2020: D+12.5 2016: D+5.9 2012: D+3.1 2008: D+12.0
Not yet ingested
- Civics
- —
Market trends
- HPI YoY
- ▼ -171.32%
- Current HPI
- 205.5154
- Rent YoY
- ▲ 5.96%
- Metro
- Columbia, MO
- State GDP YoY
- ▲ 1.84%
- F500 in state
- 20
Industry mix (Fortune 500 HQ in MO)
| Industry | F500 HQs | Revenue |
|---|---|---|
| Healthcare | 1 | $163B |
|
||
| Insurance | 1 | $21B |
|
||
| Industrial Technology | 1 | $17B |
|
||
| Retail | 1 | $16B |
|
||
| Industrial Distribution | 1 | $10B |
|
||
| Utilities | 1 | $9B |
|
||
Price history
+80.2% since first listed5 events — show timeline
- 2026-06-08 Listed $135,000 CBORMLS
- 2005-01-28 Sold (MLS) — CBORMLS
- 2004-10-26 Listed $92,500 CBORMLS
- 1998-04-20 Sold (MLS) — CBORMLS
- 1997-11-05 Listed $74,900 CBORMLS
Property tax history
+3.1%/yrLatest (2025): $1,406 · +11.1% YoY. Source: county tax records.
Cash-flow waterfall
monthlySold comps — $/sqft
last 12 mo · ≤1 miLoading sold comps…