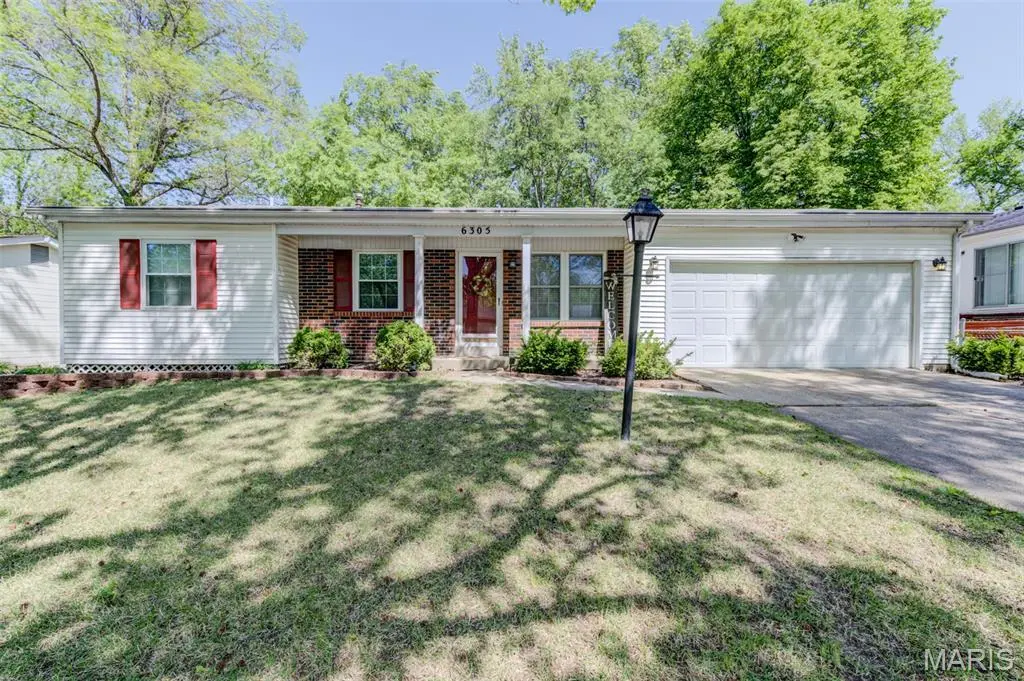
6305 Silver Fox Dr · Old Jamestown, MO
Flood risk 1/10 · Minimal
- FEMA flood zone
- X (unshaded)
- Chance of flooding over 30 yrs
- 0.0%
- Est. flood insurance / yr
- $473 – $860
Fire risk 1/10 · Minimal
- Est. fire insurance / yr
- $1,054 – $1,958
Heat risk 5/10 · Moderate
- Hot days now (above 106°F)
- 7 days/yr
- Hot days in 30 yrs
- 21 days/yr
Wind risk 2/10 · Minimal
- Chance of severe wind over 30 yrs
- 1.0%
Air-quality risk 4/10 · Minor
- Unhealthy air days now
- 4 days/yr
- Unhealthy air days in 30 yrs
- 5 days/yr
Risk factors via First Street. Map © Google.
Why this score? — see what drove the C grade
The composite is a weighted blend of 9 inputs, each scored 0–100. Each bar is that input's sub-score; the figure is the points it added to the 100-point composite (weight × sub-score).
- Cash flow +23.7/30.0
- ARV discount +8.1/15.0
- DSCR +7.6/10.0
- 1% rule +5.7/10.0
- Livability +3.3/5.0
- Rent growth +2.5/5.0
- Condition / age +2.5/5.0
- Schools +1.7/10.0
- Appreciation +0.0/10.0
$200,000
🖨 Deal sheet 📄 Offer letter ✓ Due diligence
Listing remarks
Wonderful opportunity to own this charming 3-bedroom, 2.5-bath ranch with a 2-car garage, set on a welcoming level fenced lot with mature trees. The low-maintenance exterior features vinyl siding, a brick front, enclosed soffits, wrapped fascia, gutter covers, thermal windows, an updated garage door with coach lights, decorative stone accents and attractive landscaping. Relax on the cozy covered front porch before stepping into the formal living room. The inviting dining room opens to the kitchen, showcasing gleaming wood floors and a sliding door leading to the patio and backyard. The eat-in kitchen offers abundant wood cabinetry, stainless steel appliances, a built-in storage peninsula an
Key facts
- Wrapped fascia
- Brick front
- Enclosed soffits
Tags
Property features AI
Finance
- Other: Home warranty included; Seller may consider concessions
- HOA & community: Fox Manor HOA; Annual association fee of $135 (includes other amenities)
Exterior
- Parking: Attached garage facing front; 2-car garage (approx. 18x24)
- Security: Smoke detector(s)
- Utilities: Public water; Public sewer; Electric service by Ameren; Cable available; Electricity connected; Natural gas connected; Sewer connected; Water available
- Home design: Single family residence; One level; Updated / remodeled; Private ownership; House structure
- Construction: Brick veneer and vinyl siding; Architectural shingle roof; Concrete perimeter foundation
- Exterior features: Patio; Exterior lighting; Chain link fencing; Sliding door(s); Storm door(s); Level, rectangular lot; Concrete road frontage
Interior
- Kitchen: Dishwasher; Disposal; Microwave; Gas range; Refrigerator; Eat-in kitchen layout
- Bedrooms: 3 bedrooms on the main level
- Flooring: Carpet; Vinyl; Wood
- Bathrooms: 2 full baths; 1 half bath; Basement bathroom
- Heating & cooling: Forced air heating (natural gas); Central air conditioning; Attic fan; Ceiling fans; Electric cooling
- Interior features: Ceiling fans; Eat-in kitchen; Double pane windows; Tilt-in windows; Smoke detector(s)
- Laundry & utility: Laundry in basement
Neighborhood map
What this means for you Summary
Snapshot
- This is a 3-bed/1.5-bath single-family listed at $200k.
Deal economics
- At list price, monthly cash flow is $382 ($5k/yr) — positive.
- The deal already cash-flows at list — no discount required.
- Meets the 1% rule at list price ($2k rent vs $200k).
- Cap rate 8.6% vs local median 5.3% in Old Jamestown — top-decile yield for the area; either an underpriced asset or a hidden risk that comps aren't pricing in. Stress-test before assuming the spread holds.
Location & tenants
- Location reads 66/100 on livability (#247 in MO) — a middle-class / working-renter tenant base. Strengths: employment A+, housing A+, cost of living A; Watch: amenities F, commute F, health & safety F.
- Hazelwood (suburban): math 11% / reading 26% proficiency, ranked #306 of 324 in MO (top 94%) — low school quality limits family demand, transient renter base, plan for 1-2y turnover.
- Zoned schools: Jamestown Elem. (math 2% / reading 37%, grade F, #935 of 1,115 statewide, top 84%, 333 students, 66% FRL); Hazelwood Central High (math 12% / reading 33%, grade F, #455 of 521 statewide, top 88%, 1,628 students, 52% FRL).
- Market conditions: 70 active listings in the ZIP; 3 comparable units currently listed for rent nearby; rentals lingering (median 44d on market — plan ~5-8 weeks vacancy on turnover, expect pricing pressure); 67% of comp listings sitting > 30 days — soft ceiling on asking rent; solid renter incomes; 920 units permitted in St. Louis County in 2024 (250 in 5+ unit buildings).
Forward outlook
- Local home prices are declining (-3.0%/yr); year-one equity from $1k of loan paydown is wiped out by about $6k of value loss. Plan a longer hold.
Negotiation context
- Only 6 days on market — expect competitive offers; lowballing is unlikely to land.
- Current owner paid $115k; list at $200k implies a 74% gain — meaningful room to come down on a strong offer.
Risks & watch-outs
- Climate carrying-cost: extreme-heat days projected 7→21/yr by 2055 (HVAC capex compounding) — expect insurance premiums to compound above CPI over the hold.
Questions for the listing agent
- Built in 1971 — when were the roof, HVAC, electrical panel, plumbing, and water heater last replaced?
- What does the HOA fee cover, when was the last increase, and are there any pending special assessments or reserve-fund shortfalls?
- Is there a deadline driving the sale (1031 exchange, divorce, estate, relocation)? That informs how much negotiation room exists.
- What's the average days-on-market for RENTAL listings here right now (not sales)? A rising rental-DOM trend means longer vacancies and softer asking-rent achievability than the comps imply.
- What's the recent tenant-quality profile in this submarket — average credit score on applications, eviction rate, late-payment / NSF rate, and stable-employment percentage? A property-management company in the area should have these aggregated.
- How much new for-sale + rental construction is in the pipeline within 1–3 miles? Heavy new supply typically softens prices + rents 12–24 months out; constrained supply supports both.
Investment metrics
- 1% rule
- 1.07% ✓
- Cap rate
- 8.59%
- Cash-on-cash
- 8.19%
- DSCR
- 1.36
- GRM
- 7.8
CMA / ARV
- ARV (median comp)
- $202,870
- List price
- $200,000
- Delta
- -1.41%
- Verdict
- FAIR
- Comps
- 20 within 1.0 mi
Show comp detail 7 sales within ~0.75 mi
| Address | Dist | Beds/Ba | Sqft | Sold | Price | $/sf | Match |
|---|---|---|---|---|---|---|---|
| 6081 Silver Fox Dr | 0.25mi | 3/1.0 | 1,044 (-1%) | 5mo | $187,900 | $180 | 80 |
| 6829 Finchdale Ct | 0.52mi | 3/1.5 | 1,053 (-1%) | 9mo | $195,000 | $185 | 67 |
| 6613 Foothills Ct | 0.37mi | 4/1.5 (+1) | 1,135 (+7%) | 7mo | $180,000 | $159 | 60 |
| 6646 Foothills Ct | 0.43mi | 3/2.0 | 1,152 (+9%) | 6mo | $159,000 | $138 | 58 |
| 6862 Foxbend Ct | 0.56mi | 3/2.5 | 1,135 (+7%) | 6mo | $165,000 | $145 | 53 |
| 12705 Stubwood Dr | 0.65mi | 3/2.0 | 1,179 (+11%) | 7mo | $265,000 | $225 | 43 |
| 12866 Fox Hollow Ct | 0.69mi | 3/2.0 | 974 (-8%) | 17mo | $192,900 | $198 | 39 |
Match score weights: distance 35% · size 25% · config 20% · recency 20%. Top-matched comps best support the ARV.
Projected returns pro-forma
-3.0% appreciation · 3.0% rent growth · sell at horizon
- IRR
- -3.9%
- Equity multiple
- 0.86×
- Total profit
- $-8,083
- Equity at exit
- $29,821
- IRR
- 5.8%
- Equity multiple
- 1.43×
- Total profit
- $24,251
- Equity at exit
- $17,292
Cash invested: $56,000 (down + closing). Projections, not guarantees.
Landlord ↔ Tenant lean methodology
- Overall (STATE)
- 81 Strongly Landlord-Friendly
- State Missouri
- 81 Strongly Landlord-Friendly · R+10
- County
- — inherits STATE
- City
- — inherits STATE
ZIP-level market 63034
- Active inventory
- 70
- Price-to-rent
- 7.8×
Monthly cashflow live
- Estimated rent
- $2,142 medium interval (Pro) →
- Mortgage (P&I)
- −$1,049
- Tax from tax record
- −$167 /mo · $2,005/yr
- Insurance
- −$83
- HOA
- −$11
- Vacancy / Maint / Mgmt
- −$450
- Net cashflow
- $382
Break-even live
UW: 25.0% down · 7.5% · 30yr · 1.5% tax · 5.0% vac · 8.0% maint · 8.0% mgmt
Financing live
Cash to close
- Down payment
- $50,000
- Closing costs
- $6,000
- Reserves months
- —
- Total cash needed
- —
Loan-product check · same deal, 3 products live
Conventional
25% down · 7.5% · 30yr
- Down + closing
- —
- Monthly P&I
- —
- Monthly cashflow
- —
- DSCR
- —
- Eligible?
- —
Personal DTI + credit; lowest rate.
DSCR
20% down · 8.5% · 30yr
- Down + closing
- —
- Monthly P&I
- —
- Monthly cashflow
- —
- DSCR
- —
- Eligible?
- —
No personal income docs; deal must DSCR.
Hard money
10% down · 12.0% · 12mo
- Down + closing
- —
- Monthly P&I
- —
- Monthly cashflow
- —
- DSCR
- —
- Eligible?
- —
Short-term bridge; refi at stabilization.
Rent comps 3 comps
| Address | Beds | Baths | Sqft | Rent | $/sqft | DOM | Units | Dist |
|---|---|---|---|---|---|---|---|---|
| 6431 Brown Fox Dr Florissant, MO | 3.0 | 2.0 | 1105 | $1,905 | $1.72 | 21d | 1 | 0.18mi |
| 12810 Verwood Dr Florissant, MO | 3.0 | 2.0 | 1408 | $2,026 | $1.44 | 43d | 1 | 0.48mi |
| 12887 Fox Haven Dr Florissant, MO | 3.0 | 2.0 | 1135 | $1,750 | $1.54 | 43d | 1 | 0.69mi |
HOA detail
- Monthly dues
- $11 · $132/yr
- Likely covers
- landscaping
Listing history 5 events
-
2026-05-06status Pending 1218-char remark
-
2026-04-29$200,000 Active 1218-char remark
-
2004-04-22soldstatus $114,900
-
2002-04-23soldstatus $105,000
-
2000-08-21soldstatus
ⓘ Source: listings_history table (triggers on properties + properties_extension) + one-shot
backfill from property_details.listing_events for pre-trigger history.
Tax reassessment forecast MO · Resets to sale price
- Current annual tax
- $2,005 · $167/mo
- Projected year-2 tax
- $2,005 · $167/mo
- Expected delta
- $0/yr ($0/mo · 0.0%)
ⓘ Screening estimate from a state-policy table — verify with the county assessor before closing.
Climate risk First Street
- Flood 1/10 Low FEMA zone X (unshaded) · 0% chance over 30 yrs
- Wildfire 1/10 Low
- Heat 5/10 Major 7 d/yr ≥106°F today · 21 d/yr by 30 yrs out
- Wind 2/10 Low 100% chance of damaging wind over 30 yrs
- Air quality 4/10 Moderate 4 unhealthy d/yr today · 5 by 30 yrs out
Nearby sold comps map
Loading sold comps map…
Walkable amenities ~0.75 mi
Loading nearby amenities…
Taxation est. · year 1
- Rental income
- $25,706
- − Mortgage interest
- −$11,203
- − Property taxes
- −$2,005
- − Insurance
- −$1,000
- − Repairs & maintenance
- −$2,056
- − Management
- −$2,056
- − HOA
- −$132
- − Depreciation
- −$5,818
- Taxable income
- $1,435
- Est. tax owed @ 24.0%
- −$344
- After-tax cash flow
- $4,241/yr
For passive investors: Depreciation is non-cash, so a rental often shows a tax loss while cash-flowing — sheltering income. Rental losses are passive: they offset passive income freely, and up to $25,000/yr can offset ordinary (W-2) income if you actively participate and your MAGI is under $100k (phasing out to $0 by $150k); unused losses carry forward. On sale, claimed depreciation is recaptured at up to 25%, and gains may owe capital-gains tax (a 1031 exchange can defer both). Figures are a year-1 estimate at your 24.0% rate — not tax advice; consult a CPA.
Schools (NCES district)
- District
- Hazelwood
- NCES district ID
- 2913830
- Math proficiency
- 11% ▼ -13.00%
- Reading proficiency
- 26% ▼ -6.00%
- Median HH income
- $51,621
- Composite
- 16.77/100
- National rank
- #9156
- State rank
- #306 of 324 in MO
Livability — Old Jamestown
- Score
- 66/100
- State rank
- #247
- US rank
- #12156
Category grades
Schools grade is shown separately in the Schools card above.
Census & demographics
- Census place
- Old Jamestown, MO
- County
- Saint Louis County · 888,823 people
- City population
- 19,557
- Metro
- St. Louis, MO-IL
- Population (ZIP)
- 18,908
- Household income
- $103,905
- Rent vs Own
- Severe rent burden
- 88.0
Population outlook (St. Louis County) Hauer SSP2
- Today (2025)
- 1,025,227 people
- By 2030
- 1,028,023 · +0.3%
- By 2040
- 1,020,940 · -0.4%
- By 2050
- 1,007,280 · -1.8%
- By 2075
- 987,277 · -3.7%
- By 2100
- 921,984 · -10.1%
Race, ethnicity, and origin ACS 2023
- Neighborhood character
- Predominantly Black (65%)
- Race & ethnicity
- Black 65% White 21% Two or more races 11% Hispanic / Latino 4% Asian 1%
- Common ancestry
- Swedish 1% Italian 1% Romanian 1%
- Foreign-born
- 5% · Canada, Vietnam
- Languages at home
- 95% English-only · Spanish 1% Vietnamese 1% Other Indo-European 1%
Political lean MEDSL · St. Louis
- 2024 margin
- Strong D (+23.4) · D 60.8% · R 37.4% · Other 1.7%
- 2008→2024 swing
- +3.5pp toward D · 2008: 19.9pp · 2024: 23.4pp
- All cycles
- 2024: D+23.4 2020: D+24.0 2016: D+16.2 2012: D+13.7 2008: D+19.9
Not yet ingested
- Civics
- —
Market trends
- HPI YoY
- ▼ -156.28%
- Current HPI
- 180.6267
- Rent YoY
- —
- Metro
- St. Louis, MO-IL
- State GDP YoY
- ▲ 1.84%
- F500 in state
- 20
Industry mix (Fortune 500 HQ in MO)
| Industry | F500 HQs | Revenue |
|---|---|---|
| Healthcare | 1 | $163B |
|
||
| Insurance | 1 | $21B |
|
||
| Industrial Technology | 1 | $17B |
|
||
| Retail | 1 | $16B |
|
||
| Industrial Distribution | 1 | $10B |
|
||
| Utilities | 1 | $9B |
|
||
Price history
+90.5% since first listed5 events — show timeline
- 2026-05-06 Pending — MARIS as Distributed by MLS Grid
- 2026-04-29 Listed $200,000 MARIS as Distributed by MLS Grid
- 2004-04-22 Sold (Public Records) $114,900 Public Records
- 2002-04-23 Sold (Public Records) $105,000 Public Records
- 2000-08-21 Sold (Public Records) — Public Records
Property tax history
+2.9%/yrLatest (2022): $2,005 · +5.6% YoY. Source: county tax records.
Cash-flow waterfall
monthlySold comps — $/sqft
last 12 mo · ≤1 miLoading sold comps…