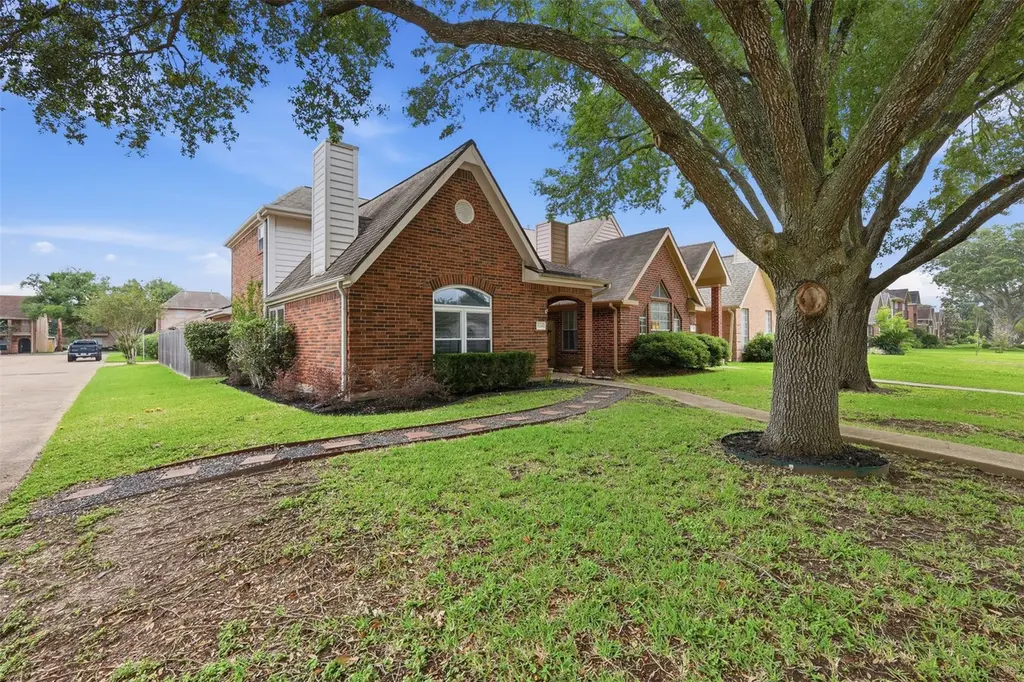
3226 Palm Desert Ln · Missouri City, TX
Flood risk 6/10 · Moderate
- FEMA flood zone
- X (unshaded)
- Chance of flooding over 30 yrs
- 0.76%
- Est. flood insurance / yr
- $507 – $1,088
Fire risk 1/10 · Minimal
- Est. fire insurance / yr
- $1,222 – $2,270
Heat risk 9/10 · Severe
- Hot days now (above 110°F)
- 7 days/yr
- Hot days in 30 yrs
- 24 days/yr
Wind risk 9/10 · Severe
- Chance of severe wind over 30 yrs
- 99.0%
Air-quality risk 2/10 · Minimal
- Unhealthy air days now
- 2 days/yr
- Unhealthy air days in 30 yrs
- 2 days/yr
Risk factors via First Street. Map © Google.
Why this score? — see what drove the D grade
The composite is a weighted blend of 9 inputs, each scored 0–100. Each bar is that input's sub-score; the figure is the points it added to the 100-point composite (weight × sub-score).
- Cash flow +10.2/30.0
- ARV discount +8.9/15.0
- Schools +4.5/10.0
- Appreciation +4.2/10.0
- 1% rule +3.8/10.0
- Livability +3.4/5.0
- DSCR +2.9/10.0
- Rent growth +2.5/5.0
- Condition / age +2.5/5.0
$256,500
🖨 Deal sheet (PDF) 📄 Offer letter ✓ Due diligence
Listing remarks
Welcome to 3226 Palm Desert Lane in Missouri City’s established Pebble Beach community. This well-maintained home features an open-concept layout with high ceilings, abundant natural light, and a spacious living area perfect for everyday living and entertaining. A convenient half bathroom is located on the first floor for guests. The kitchen offers quartz countertops, stainless steel appliances, ample cabinetry, and a breakfast bar that flows seamlessly into the dining area. The primary bedroom is conveniently located on the first floor, while upstairs includes additional bedrooms, a full bathroom, and a versatile loft or sitting area. Enjoy the private backyard with patio space, gree
Key facts
- Quartz countertops
- Private backyard
- Breakfast bar
Tags
Property features AI
Finance
- Other: Municipal Utility District disclosure available; Seller disclosure available
- HOA & community: Association: Marshall Management Group, Inc.; Annual association fee of $300
Exterior
- Parking: Detached garage; 2 garage spaces
- Utilities: Public water; Public sewer
- Home design: Residential property; Faces south; Built in 1993; Single‑story entry configuration
- Construction: Brick construction; Composition roof; Slab foundation
- Exterior features: Private yard; Fenced backyard; Corner lot
Interior
- Kitchen: Dishwasher; Gas oven; Gas range; Microwave
- Bedrooms: Primary bedroom on the first floor (15 x 14); Bedroom on the second floor (14 x 10); Bedroom on the second floor (11 x 10)
- Flooring: Carpet; Tile
- Bathrooms: 2 full bathrooms; 1 half bathroom; Additional second-floor bathroom (7 x 10)
- Heating & cooling: Central heating (gas); Central electric air conditioning
- Interior features: Quartz counters; 2 fireplaces; 6 total rooms
Neighborhood map
What this means for you Summary
Snapshot
- This is a 3-bed/3.0-bath single-family listed at $256k.
Deal economics
- At list price, monthly cash flow is $-148 ($-2k/yr) — negative.
- To cash-flow at today's rent, offer at most $230k (10.2% below list).
- To meet the 1% rule (rent ≥ 1% of price), the offer needs to be $226k (11.8% below list).
- Recommended offer: $226k (11.8% below list) — sets the bar for 1% rule.
- Cap rate 5.6% vs local median 3.6% in Missouri City — top-decile yield for the area; either an underpriced asset or a hidden risk that comps aren't pricing in. Stress-test before assuming the spread holds.
Location & tenants
- Location reads 67/100 on livability (#526 in TX) — a middle-class / working-renter tenant base. Strengths: housing A+, crime A, employment A; Watch: amenities F, commute F, health & safety F.
- Fort Bend ISD (suburban): math 44% / reading 53% proficiency, ranked #140 of 826 in TX (top 17%) — families likely to look elsewhere, expect single-tenant / working-renter base with shorter leases.
- Zoned schools: Quail Valley El (math 27% / reading 42%, grade F, #1,995 of 4,322 statewide, top 50%, 564 students, 64% FRL); Quail Valley Middle (math 55% / reading 57%, grade B-, #234 of 1,662 statewide, top 14%, 1,043 students, 45% FRL); Fort Bend Co Alter (26 students, 0% FRL) — zoned schools at 36% FRL track the district average.
- Market conditions: Rents soft (-0.1%/yr); 1229 active listings in the ZIP; 11 comparable units currently listed for rent nearby; rentals at typical pace (median 23d on market — plan ~3-4 weeks tenant-placement turnaround); high-income renter base; 12,093 units permitted in Fort Bend County in 2024 (815 in 5+ unit buildings).
Forward outlook
- Local home prices are declining (-1.7%/yr); year-one equity from $2k of loan paydown is wiped out by about $4k of value loss. Plan a longer hold.
- Fort Bend County population projected at +75% by 2050 — long-run rental-demand tailwind backs the buy-and-hold thesis.
Negotiation context
- Only 13 days on market — expect competitive offers; lowballing is unlikely to land.
Risks & watch-outs
- Climate carrying-cost: major flood risk; severe wind risk, 99% chance of damaging wind over 30y; extreme-heat days projected 7→24/yr by 2055 (HVAC capex compounding) — expect insurance premiums to compound above CPI over the hold.
Questions for the listing agent
- What do current leases actually rent for vs. the listed asking? Can we see a recent rent roll and the last 12 months of T-12 income?
- What does the HOA fee cover, when was the last increase, and are there any pending special assessments or reserve-fund shortfalls?
- Is there a deadline driving the sale (1031 exchange, divorce, estate, relocation)? That informs how much negotiation room exists.
- Schools are B-rated — typically a magnet for longer-tenancy family renters. What's the average tenant stay here, and is there a school-zone premium baked into asking?
- The area grade is low — what's the realistic commute time and amenity access for the typical tenant pool here? Any planned neighborhood developments (good or bad) we should know about?
- What's the average days-on-market for RENTAL listings here right now (not sales)? A rising rental-DOM trend means longer vacancies and softer asking-rent achievability than the comps imply.
- What's the recent tenant-quality profile in this submarket — average credit score on applications, eviction rate, late-payment / NSF rate, and stable-employment percentage? A property-management company in the area should have these aggregated.
- How much new for-sale + rental construction is in the pipeline within 1–3 miles? Heavy new supply typically softens prices + rents 12–24 months out; constrained supply supports both.
Investment metrics
- 1% rule
- 0.88% ✗
- Cap rate
- 5.60%
- Cash-on-cash
- -2.47%
- DSCR
- 0.89
- GRM
- 9.4
CMA / ARV
- ARV (median comp)
- $264,877
- List price
- $256,500
- Delta
- -3.16%
- Verdict
- FAIR
- Comps
- 20 within 1.0 mi
Show comp detail 12 sales within ~0.75 mi
| Address | Dist | Beds/Ba | Sqft | Sold | Price | $/sf | Match |
|---|---|---|---|---|---|---|---|
| 3226 Palm Desert Ln | 0.00mi | 3/2.5 | 1,809 (0%) | 0mo | $256,500 | $142 | 98 |
| 3311 La Costa Rd | 0.10mi | 3/2.0 | 1,817 (+0%) | 3mo | $295,000 | $162 | 88 |
| 3322 Ashmont Ln | 0.18mi | 3/2.0 | 1,784 (-1%) | 2mo | $215,000 | $121 | 84 |
| 3229 Continental Dr | 0.03mi | 3/2.5 | 1,942 (+7%) | 4mo | $245,000 | $126 | 81 |
| 3327 Springhill Dr | 0.25mi | 3/2.0 | 1,841 (+2%) | 1mo | $265,000 | $144 | 80 |
| 3215 Springhill Dr | 0.23mi | 3/2.0 | 1,784 (-1%) | 4mo | $259,000 | $145 | 80 |
| 3315 Golden Tee Ct | 0.60mi | 3/2.0 | 1,786 (-1%) | 2mo | $175,000 | $98 | 64 |
| 2207 Cottonwood Ct | 0.57mi | 3/2.0 | 1,700 (-6%) | 4mo | $225,000 | $132 | 56 |
| 2211 Cottonwood Ct | 0.56mi | 3/2.0 | 1,674 (-8%) | 7mo | $233,400 | $139 | 52 |
| 3306 High Pine Dr | 0.62mi | 3/2.5 | 2,042 (+13%) | 7mo | $249,000 | $122 | 41 |
| 2850 Creekway Cir | 0.57mi | 3/2.0 | 2,072 (+14%) | 5mo | $269,000 | $130 | 41 |
| 2610 Creekway Cir | 0.74mi | 3/2.0 | 1,576 (-13%) | 4mo | $219,900 | $140 | 36 |
Match score weights: distance 35% · size 25% · config 20% · recency 20%. Top-matched comps best support the ARV.
Projected returns pro-forma
-1.67% appreciation · 0.0% rent growth · sell at horizon
- IRR
- -15.2%
- Equity multiple
- 0.40×
- Total profit
- $-42,845
- Equity at exit
- $53,795
- IRR
- -12.1%
- Equity multiple
- 0.15×
- Total profit
- $-61,238
- Equity at exit
- $49,828
Cash invested: $71,820 (down + closing). Projections, not guarantees.
Landlord ↔ Tenant lean methodology
- Overall (STATE)
- 87 Strongly Landlord-Friendly
- State Texas
- 87 Strongly Landlord-Friendly · R+5
- County
- — inherits STATE
- City
- — inherits STATE
ZIP-level market 77459
- Home prices YoY
- -0.8%
- Rents YoY
- -0.1%
- Active inventory
- 1229
- Price-to-rent
- 9.4×
Monthly cashflow live
- Estimated rent
- $2,264 high interval (Pro) →
- Mortgage (P&I)
- −$1,345
- Tax from tax record
- −$459 /mo · $5,506/yr
- Insurance
- −$107
- HOA
- −$25
- Vacancy / Maint / Mgmt
- −$475
- Net cashflow
- $-148
Break-even live
Sensitivity live
| Price | -10% $-2 | -5% $-75 | +0% $-148 | +5% $-220 | +10% $-293 |
|---|---|---|---|---|---|
| Rent | -10% $-326 | -5% $-237 | +0% $-148 | +5% $-58 | +10% $31 |
| Rate | -1.0pp $-18 | -0.5pp $-82 | base $-148 | +0.5pp $-214 | +1.0pp $-282 |
UW: 25.0% down · 7.5% · 30yr · 1.5% tax · 5.0% vac · 8.0% maint · 8.0% mgmt
Financing live
Cash to close
- Down payment
- $64,125
- Closing costs
- $7,695
- Reserves months
- —
- Total cash needed
- —
Loan-product check · same deal, 3 products live
Conventional
25% down · 7.5% · 30yr
- Down + closing
- —
- Monthly P&I
- —
- Monthly cashflow
- —
- DSCR
- —
- Eligible?
- —
Personal DTI + credit; lowest rate.
DSCR
20% down · 8.5% · 30yr
- Down + closing
- —
- Monthly P&I
- —
- Monthly cashflow
- —
- DSCR
- —
- Eligible?
- —
No personal income docs; deal must DSCR.
Hard money
10% down · 12.0% · 12mo
- Down + closing
- —
- Monthly P&I
- —
- Monthly cashflow
- —
- DSCR
- —
- Eligible?
- —
Short-term bridge; refi at stabilization.
Rent comps 11 comps
| Address | Beds | Baths | Sqft | Rent | $/sqft | DOM | Units | Dist |
|---|---|---|---|---|---|---|---|---|
| 3327 Shady Glen Ln Missouri City, TX | 4.0 | 2.5 | 2232 | $2,250 | $1.01 | 14d | 1 | 0.27mi |
| 22 Chapparal Ct Missouri City, TX | 3.0 | 2.0 | 1504 | $2,000 | $1.33 | 45d | 1 | 0.36mi |
| 2120 Bermuda Dunes Dr Missouri City, TX | 3.0 | 2.5 | 2100 | $2,200 | $1.05 | 26d | 1 | 0.37mi |
| 2608 Grand Plantation Ct Missouri City, TX | 3.0 | 2.0 | 2150 | $2,450 | $1.14 | 14d | 1 | 0.74mi |
| 3611 Duncaster Dr Missouri City, TX | 3.0 | 2.5 | 1926 | $2,100 | $1.09 | 21d | 1 | 0.83mi |
| 2307 Hilton Head Dr Missouri City, TX | 4.0 | 2.0 | 2606 | $2,239 | $0.86 | 18d | 1 | 1.03mi |
| 1547 Revolution Way Missouri City, TX | 3.0 | 3.0 | 1680 | $2,300 | $1.37 | 14d | 1 | 1.27mi |
| 3912 Cedar Valley Dr Missouri City, TX | 3.0 | 2.0 | 2151 | $2,200 | $1.02 | 22d | 1 | 1.31mi |
| 1620 Good Day Dr Missouri City, TX | 3.0 | 3.0 | 1364 | $1,790 | $1.31 | 45d | 1 | 1.32mi |
| 1420 Revolution Way Missouri City, TX | 3.0 | 2.5 | 1649 | $2,250 | $1.36 | 45d | 1 | 1.39mi |
| 1919 Doliver Cir Missouri City, TX | 3.0 | 2.0 | 1515 | $2,000 | $1.32 | 45d | 1 | 1.41mi |
HOA detail
- Monthly dues
- $25 · $300/yr
Listing history 5 events
-
2026-05-15status Pending 874-char remark
-
2026-05-08status Pending 874-char remark
-
2026-05-01$256,500 Active 874-char remark
-
2019-11-13soldstatus
-
1995-12-20soldstatus
ⓘ Source: listings_history table (triggers on properties + properties_extension) + one-shot
backfill from property_details.listing_events for pre-trigger history.
Tax reassessment forecast TX · Resets to sale price
- Current annual tax
- $5,506 · $459/mo
- Projected year-2 tax
- $5,506 · $459/mo
- Expected delta
- $0/yr ($0/mo · 0.0%)
ⓘ Screening estimate from a state-policy table — verify with the county assessor before closing.
Climate risk First Street
- Flood 6/10 Major FEMA zone X (unshaded) · 76% chance over 30 yrs
- Wildfire 1/10 Low
- Heat 9/10 Extreme 7 d/yr ≥110°F today · 24 d/yr by 30 yrs out
- Wind 9/10 Extreme 99% chance of damaging wind over 30 yrs
- Air quality 2/10 Low 2 unhealthy d/yr today · 2 by 30 yrs out
Nearby sold comps map
Loading sold comps map…
Walkable amenities ~0.75 mi
Loading nearby amenities…
Taxation est. · year 1
- Rental income
- $27,163
- − Mortgage interest
- −$14,368
- − Property taxes
- −$5,506
- − Insurance
- −$1,282
- − Repairs & maintenance
- −$2,173
- − Management
- −$2,173
- − HOA
- −$300
- − Depreciation
- −$7,462
- Taxable loss
- −$6,101
- Est. tax savings @ 24.0%
- +$1,464
- After-tax cash flow
- $-307/yr
For passive investors: Depreciation is non-cash, so a rental often shows a tax loss while cash-flowing — sheltering income. Rental losses are passive: they offset passive income freely, and up to $25,000/yr can offset ordinary (W-2) income if you actively participate and your MAGI is under $100k (phasing out to $0 by $150k); unused losses carry forward. On sale, claimed depreciation is recaptured at up to 25%, and gains may owe capital-gains tax (a 1031 exchange can defer both). Figures are a year-1 estimate at your 24.0% rate — not tax advice; consult a CPA.
Schools (NCES district)
- District
- Fort Bend ISD
- NCES district ID
- 4819650
- Math proficiency
- 44% ▼ -15.00%
- Reading proficiency
- 53% ▼ -4.00%
- Median HH income
- $82,360
- Composite
- 44.61/100
- National rank
- #2779
- State rank
- #140 of 826 in TX
Livability — Missouri City
- Score
- 67/100
- State rank
- #526
- US rank
- #10308
Category grades
Schools grade is shown separately in the Schools card above.
Census & demographics
- Census place
- Missouri City, TX
- County
- Fort Bend County · 836,777 people
- Metro
- Houston-The Woodlands-Sugar Land, TX
- Population (ZIP)
- 84,221
- Household income
- $129,151
- Rent vs Own
- Severe rent burden
- 1004.0
Population outlook (Fort Bend County) Hauer SSP2
- Today (2025)
- 1,004,526 people
- By 2030
- 1,153,104 · +14.8%
- By 2040
- 1,453,718 · +44.7%
- By 2050
- 1,753,781 · +74.6%
- By 2075
- 2,455,772 · +144.5%
- By 2100
- 2,930,528 · +191.7%
Race, ethnicity, and origin ACS 2023
- Neighborhood character
- Highly diverse neighborhood (Simpson 0.75)
- Race & ethnicity
- White 34% Black 26% Asian 22% Hispanic / Latino 13% Two or more races 10%
- Hispanic origin (detail)
- Mexican 7%
- Common ancestry
- Lithuanian 2% Slovak 1% Italian 1%
- Foreign-born
- 21% · Canada, China, Vietnam
- Languages at home
- 73% English-only · Other Asian/Pacific 8% Spanish 7% Other Indo-European 5%
Political lean MEDSL · Fort Bend
- 2024 margin
- Toss-up / Even · D 49.5% · R 47.9% · Other 2.6%
- 2008→2024 swing
- +4.0pp toward D · 2008: -2.4pp · 2024: 1.6pp
- All cycles
- 2024: D+1.6 2020: D+10.6 2016: D+6.6 2012: R+6.8 2008: R+2.4
Not yet ingested
- Civics
- —
Market trends
- HPI YoY
- ▼ -1.67%
- Current HPI
- 212.3573
- Rent YoY
- ▼ -0.15%
- Metro
- Houston-The Woodlands-Sugar Land, TX
- State GDP YoY
- ▲ 3.95%
- F500 in state
- 110
Industry mix (Fortune 500 HQ in TX)
| Industry | F500 HQs | Revenue |
|---|---|---|
| Energy | 16 | $1,198B |
|
||
| Technology | 5 | $198B |
|
||
| Engineering / Construction | 4 | $72B |
|
||
| Energy Services | 3 | $60B |
|
||
| Utilities | 3 | $41B |
|
||
| Healthcare | 2 | $330B |
|
||
Price history
6 events — show timeline
- 2026-06-10 Sold (MLS) — HARMLS
- 2026-05-15 Pending — HARMLS
- 2026-05-08 Pending — HARMLS
- 2026-05-01 Listed $256,500 HARMLS
- 2019-11-13 Sold (Public Records) — Public Records
- 1995-12-20 Sold (Public Records) — Public Records
Property tax history
+4.4%/yrLatest (2025): $5,506 · +13.8% YoY. Source: county tax records.
Cash-flow waterfall
monthlySold comps — $/sqft
last 12 mo · ≤1 miLoading sold comps…