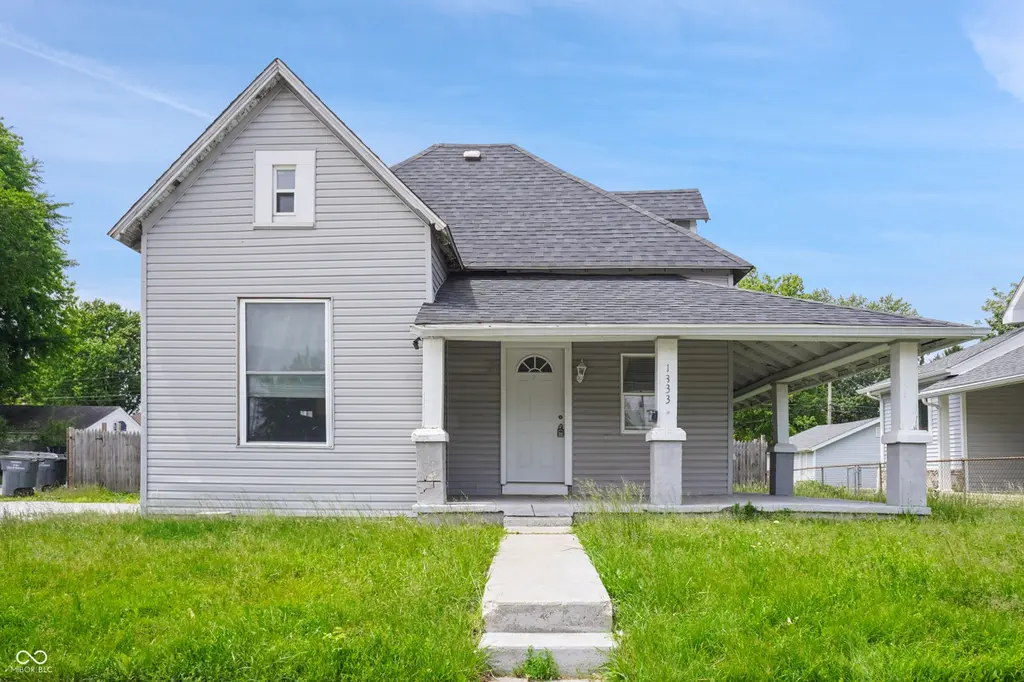
1333 S Main St · Kokomo, IN
Flood risk 3/10 · Minor
- FEMA flood zone
- X (unshaded)
- Chance of flooding over 30 yrs
- 0.1%
- Est. flood insurance / yr
- $507 – $1,088
Fire risk 1/10 · Minimal
- Est. fire insurance / yr
- $717 – $1,331
Heat risk 3/10 · Minor
- Hot days now (above 102°F)
- 7 days/yr
- Hot days in 30 yrs
- 17 days/yr
Wind risk 2/10 · Minimal
- Chance of severe wind over 30 yrs
- —
Air-quality risk 3/10 · Minor
- Unhealthy air days now
- 2 days/yr
- Unhealthy air days in 30 yrs
- 3 days/yr
Risk factors via First Street. Map © Google.
Why this score? — see what drove the B+ grade
The composite is a weighted blend of 9 inputs, each scored 0–100. Each bar is that input's sub-score; the figure is the points it added to the 100-point composite (weight × sub-score).
- Cash flow +30.0/30.0
- ARV discount +15.0/15.0
- 1% rule +10.0/10.0
- DSCR +10.0/10.0
- Livability +3.4/5.0
- Rent growth +3.0/5.0
- Condition / age +2.5/5.0
- Schools +2.1/10.0
- Appreciation +0.0/10.0
$89,900
🖨 Deal sheet (PDF) 📄 Offer letter ✓ Due diligence
Listing remarks MLS
3 bedroom home on corner lot with nice size yard. This fixer upper could be a beautiful home with some tcl. Motivated seller says bring your offer!
Key facts
- 7,405 sq ft lot
- Built 1895
- Listed 18 days
Property features AI
Exterior
- Utilities: Public water; Municipal sewer; Solid waste service available
- Home design: Single-family residence; Two levels
- Construction: Vinyl siding; Crawl-space foundation
- Exterior features: Lot under 1/4 acre (0.17 acre)
Interior
- Kitchen: Kitchen (12 x 11); Refrigerator
- Bedrooms: Three bedrooms total — two on the main level and one upper-level bedroom (11 x 11)
- Bathrooms: One full bath and one half bath
- Heating & cooling: Forced-air heating; Central air conditioning
- Interior features: Living room (13 x 20); Additional main-level room (13 x 13)
Neighborhood map
What this means for you Summary
Snapshot
- This is a 4-bed/1.0-bath single-family listed at $90k.
Deal economics
- At list price, monthly cash flow is $604 ($7k/yr) — positive.
- The deal already cash-flows at list — no discount required.
- Meets the 1% rule at list price ($1k rent vs $90k).
- Recommended offer: $89k (1.5% below list) — sets the bar for market timing.
- Cap rate 14.4% vs local median 5.2% in Kokomo — top-decile yield for the area; either an underpriced asset or a hidden risk that comps aren't pricing in. Stress-test before assuming the spread holds.
Location & tenants
- Location reads 68/100 on livability (#227 in IN) — a middle-class / working-renter tenant base. Strengths: cost of living A+, housing A+, health & safety A; Watch: crime D, schools F, amenities F.
- Kokomo School Corporation (urban): math 22% / reading 30% proficiency, ranked #264 of 301 in IN (top 88%) — low school quality limits family demand, transient renter base, plan for 1-2y turnover; 62% free/reduced lunch — lower-income household profile, screen leases tightly.
- Market conditions: Rents rising (+1.8%/yr); 232 active listings in the ZIP; 194 units permitted in Howard County in 2024 (0 in 5+ unit buildings).
Forward outlook
- Local home prices are declining (-3.0%/yr); year-one equity from $622 of loan paydown is wiped out by about $3k of value loss. Plan a longer hold.
- Howard County population projected at -11% by 2050 — secular population decline; favor cash flow + early exit over multi-decade hold.
- At projected returns (-3.0% appreciation + 1.8% rent growth), your $25k cash investment doubles in ~5 years — after that, you're playing with house money.
Negotiation context
- It's been on market 19 days — a 2% lower offer ($89k) is reasonable based on typical stale-listing flexibility.
- 2 sale attempts since 9y ago; this cycle's ask has dropped $5k (5%) from the opening price — seller is motivated, your offer sets the floor, not the list.
- Current owner paid $15k; list at $90k implies a 499% gain — meaningful room to come down on a strong offer.
Risks & watch-outs
- Watch-outs: built in 1895 — expect roof / HVAC / electrical / plumbing capex.
Questions for the listing agent
- Built in 1895 — when were the roof, HVAC, electrical panel, plumbing, and water heater last replaced?
- Is there a deadline driving the sale (1031 exchange, divorce, estate, relocation)? That informs how much negotiation room exists.
- Schools are F-rated, which usually means shorter tenancies and higher turnover. Who's the typical renter profile here, and what's been the actual vacancy rate?
- Crime grade is D in this area — have there been break-ins, vandalism, or insurance claims at this property in the last 3 years? What carrier currently insures it and at what premium?
- What's the average days-on-market for RENTAL listings here right now (not sales)? A rising rental-DOM trend means longer vacancies and softer asking-rent achievability than the comps imply.
- What's the recent tenant-quality profile in this submarket — average credit score on applications, eviction rate, late-payment / NSF rate, and stable-employment percentage? A property-management company in the area should have these aggregated.
- How much new for-sale + rental construction is in the pipeline within 1–3 miles? Heavy new supply typically softens prices + rents 12–24 months out; constrained supply supports both.
Investment metrics
- 1% rule
- 1.66% ✓
- Cap rate
- 14.36%
- Cash-on-cash
- 28.79%
- DSCR
- 2.28
- GRM
- 5.0
CMA / ARV
- ARV (on-the-fly)
- $163,728
- Comps found
- 12
Show comp detail 12 sales within ~0.75 mi
| Address | Dist | Beds/Ba | Sqft | Sold | Price | $/sf | Match |
|---|---|---|---|---|---|---|---|
| 1335 S Buckeye St | 0.07mi | 3/3.0 (-1) | 1,454 (-4%) | 1mo | $173,000 | $119 | 76 |
| 1608 S Armstrong St | 0.29mi | 3/1.0 (-1) | 1,568 (+3%) | 5mo | $110,000 | $70 | 72 |
| 1520 S Courtland Ave | 0.36mi | 3/1.0 (-1) | 1,438 (-5%) | 2mo | $155,000 | $108 | 68 |
| 1110 S Courtland St | 0.40mi | 3/1.5 (-1) | 1,458 (-4%) | 1mo | $170,000 | $117 | 67 |
| 1424 S Courtland Ave | 0.33mi | 4/1.0 | 1,656 (+9%) | 4mo | $105,000 | $63 | 66 |
| 1800 S Main St | 0.36mi | 3/1.0 (-1) | 1,330 (-12%) | 2mo | $163,500 | $123 | 56 |
| 1931 S Bell St | 0.58mi | 3/2.0 (-1) | 1,414 (-7%) | 0mo | $235,000 | $166 | 52 |
| 1101 S Locke St | 0.54mi | 3/1.5 (-1) | 1,356 (-11%) | 3mo | $122,500 | $90 | 47 |
| 634 S Union St | 0.65mi | 3/1.5 (-1) | 1,350 (-11%) | 2mo | $75,000 | $56 | 43 |
| 739 S Jay St | 0.68mi | 3/1.5 (-1) | 1,708 (+13%) | 0mo | $67,000 | $39 | 40 |
| 803 S Webster St | 0.61mi | 3/2.0 (-1) | 1,296 (-14%) | 1mo | $57,000 | $44 | 37 |
| 724 S Apperson Way | 0.62mi | 3/2.0 (-1) | 1,300 (-14%) | 4mo | $179,900 | $138 | 35 |
Match score weights: distance 35% · size 25% · config 20% · recency 20%. Top-matched comps best support the ARV.
Projected returns pro-forma
-3.0% appreciation · 1.8% rent growth · sell at horizon
- IRR
- 21.8%
- Equity multiple
- 1.88×
- Total profit
- $22,114
- Equity at exit
- $13,404
- IRR
- 29.1%
- Equity multiple
- 3.45×
- Total profit
- $61,630
- Equity at exit
- $7,773
Cash invested: $25,172 (down + closing). Projections, not guarantees.
Landlord ↔ Tenant lean methodology
- Overall (STATE)
- 90 Strongly Landlord-Friendly
- State Indiana
- 90 Strongly Landlord-Friendly · R+11
- County
- — inherits STATE
- City
- — inherits STATE
ZIP-level market 46902
- Home prices YoY
- -20.7%
- Rents YoY
- 1.8%
- Active inventory
- 232
- Price-to-rent
- 5.0×
Monthly cashflow live
- Estimated rent
- $1,494 medium interval (Pro) →
- Mortgage (P&I)
- −$471
- Tax from tax record
- −$67 /mo · $808/yr
- Insurance
- −$37
- HOA
- −$0
- Vacancy / Maint / Mgmt
- −$314
- Net cashflow
- $604
Break-even live
Sensitivity live
| Price | -10% $655 | -5% $629 | +0% $604 | +5% $579 | +10% $553 |
|---|---|---|---|---|---|
| Rent | -10% $486 | -5% $545 | +0% $604 | +5% $663 | +10% $722 |
| Rate | -1.0pp $649 | -0.5pp $627 | base $604 | +0.5pp $581 | +1.0pp $557 |
UW: 25.0% down · 7.5% · 30yr · 1.5% tax · 5.0% vac · 8.0% maint · 8.0% mgmt
Financing live
Cash to close
- Down payment
- $22,475
- Closing costs
- $2,697
- Reserves months
- —
- Total cash needed
- —
Loan-product check · same deal, 3 products live
Conventional
25% down · 7.5% · 30yr
- Down + closing
- —
- Monthly P&I
- —
- Monthly cashflow
- —
- DSCR
- —
- Eligible?
- —
Personal DTI + credit; lowest rate.
DSCR
20% down · 8.5% · 30yr
- Down + closing
- —
- Monthly P&I
- —
- Monthly cashflow
- —
- DSCR
- —
- Eligible?
- —
No personal income docs; deal must DSCR.
Hard money
10% down · 12.0% · 12mo
- Down + closing
- —
- Monthly P&I
- —
- Monthly cashflow
- —
- DSCR
- —
- Eligible?
- —
Short-term bridge; refi at stabilization.
Listing history 18 events
-
2026-06-19days on market $89,900 Active 19 DOM
-
2026-06-18price $89,900 Active 18 DOM
-
2026-06-18days on market $94,900 Active 18 DOM
-
2026-06-17days on market $94,900 Active 17 DOM
-
2026-06-16days on market $94,900 Active 16 DOM
-
2026-06-15days on market $94,900 Active 15 DOM
-
2026-06-14days on market $94,900 Active 13 DOM
-
2026-06-13statusdays on market $94,900 Active 12 DOM
-
2026-06-08status $94,900 Pending 11 DOM
-
2026-06-07days on market $94,900 Active 11 DOM
-
2026-06-02days on market $94,900 Active 6 DOM
-
2026-06-01days on market $94,900 Active 5 DOM
-
2026-05-31days on market $94,900 Active 4 DOM
-
2026-05-30days on market $94,900 Active 3 DOM
-
2026-05-27$94,900 Active
-
2018-08-24soldstatus $15,000
-
2017-11-10soldstatus $12,750 147-char remark
Show marketing remark (147 chars)
3 bedroom home on corner lot with nice size yard. This fixer upper could be a beautiful home with some tcl. Motivated seller says bring your offer!
-
2017-07-12$29,900 147-char remark
Show marketing remark (147 chars)
3 bedroom home on corner lot with nice size yard. This fixer upper could be a beautiful home with some tcl. Motivated seller says bring your offer!
ⓘ Source: listings_history table (triggers on properties + properties_extension) + one-shot
backfill from property_details.listing_events for pre-trigger history.
Tax reassessment forecast IN · Partial reset (capped growth)
- Current annual tax
- $808 · $67/mo
- Projected year-2 tax
- $808 · $67/mo
- Expected delta
- $0/yr ($0/mo · -0.0%)
ⓘ Screening estimate from a state-policy table — verify with the county assessor before closing.
Climate risk First Street
- Flood 3/10 Moderate FEMA zone X (unshaded) · 10% chance over 30 yrs
- Wildfire 1/10 Low
- Heat 3/10 Moderate 7 d/yr ≥102°F today · 17 d/yr by 30 yrs out
- Wind 2/10 Low
- Air quality 3/10 Moderate 2 unhealthy d/yr today · 3 by 30 yrs out
Nearby sold comps map
Loading sold comps map…
Walkable amenities ~0.75 mi
Loading nearby amenities…
Taxation est. · year 1
- Rental income
- $17,928
- − Mortgage interest
- −$5,036
- − Property taxes
- −$808
- − Insurance
- −$450
- − Repairs & maintenance
- −$1,434
- − Management
- −$1,434
- − Depreciation
- −$2,615
- Taxable income
- $6,151
- Est. tax owed @ 24.0%
- −$1,476
- After-tax cash flow
- $5,772/yr
For passive investors: Depreciation is non-cash, so a rental often shows a tax loss while cash-flowing — sheltering income. Rental losses are passive: they offset passive income freely, and up to $25,000/yr can offset ordinary (W-2) income if you actively participate and your MAGI is under $100k (phasing out to $0 by $150k); unused losses carry forward. On sale, claimed depreciation is recaptured at up to 25%, and gains may owe capital-gains tax (a 1031 exchange can defer both). Figures are a year-1 estimate at your 24.0% rate — not tax advice; consult a CPA.
Schools (NCES district)
- District
- Kokomo School Corporation
- NCES district ID
- 1805370
- Math proficiency
- 22% ▼ -8.00%
- Reading proficiency
- 30% ▼ -5.00%
- Median HH income
- $35,804
- Composite
- 21.5/100
- National rank
- #8325
- State rank
- #264 of 301 in IN
Livability — Kokomo
- Score
- 68/100
- State rank
- #227
- US rank
- #9912
Category grades
Schools grade is shown separately in the Schools card above.
Census & demographics
- Census place
- Kokomo, IN
- County
- Howard County · 75,099 people
- City population
- 75,099
- Metro
- Kokomo, IN
- Population (ZIP)
- 37,017
- Household income
- $62,126
- Rent vs Own
- Severe rent burden
- 1262.0
Population outlook (Howard County) Hauer SSP2
- Today (2025)
- 81,522 people
- By 2030
- 80,104 · -1.7%
- By 2040
- 76,708 · -5.9%
- By 2050
- 72,880 · -10.6%
- By 2075
- 64,016 · -21.5%
- By 2100
- 51,705 · -36.6%
Race, ethnicity, and origin ACS 2023
- Neighborhood character
- Predominantly White (81%)
- Race & ethnicity
- White 81% Black 9% Two or more races 5% Hispanic / Latino 4% Asian 3%
- Common ancestry
- Italian 2% Lithuanian 1% Slovak 1%
- Foreign-born
- 3% · Canada, Vietnam, China
- Languages at home
- 96% English-only · Vietnamese 1% Other Asian/Pacific 1% Spanish 1%
Political lean MEDSL · Howard
- 2024 margin
- Solid R (+35.3) · D 31.4% · R 66.7% · Other 1.8%
- 2008→2024 swing
- -29.1pp toward R · 2008: -6.2pp · 2024: -35.3pp
- All cycles
- 2024: R+35.3 2020: R+32.4 2016: R+33.9 2012: R+14.3 2008: R+6.2
Not yet ingested
- Civics
- —
Market trends
- HPI YoY
- ▼ -61.76%
- Current HPI
- 236.8237
- Rent YoY
- ▲ 1.80%
- Metro
- Kokomo, IN
- State GDP YoY
- ▲ 2.90%
- F500 in state
- 18
Industry mix (Fortune 500 HQ in IN)
| Industry | F500 HQs | Revenue |
|---|---|---|
| Industrial Machinery | 2 | $37B |
|
||
| Healthcare | 1 | $177B |
|
||
| Pharmaceuticals | 1 | $45B |
|
||
| Metals / Steel | 1 | $18B |
|
||
| Agriculture | 1 | $17B |
|
||
| Packaging | 1 | $12B |
|
||
Price history
+217.4% since first listed4 events — show timeline
- 2026-05-27 Listed $94,900 MIBOR as Distributed by MLS Grid
- 2018-08-24 Sold (Public Records) $15,000 Public Records
- 2017-11-10 Sold (MLS) $12,750 IRMLS
- 2017-07-12 Listed $29,900 IRMLS
Property tax history
+13.6%/yrLatest (2024): $808 · +122.6% YoY. Source: county tax records.
Cash-flow waterfall
monthlySold comps — $/sqft
last 12 mo · ≤1 miLoading sold comps…