 🔨 Auction
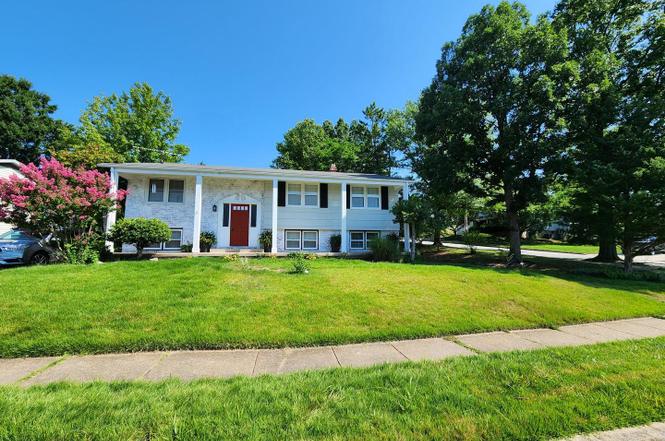
6720 Garvey Rd · Rosedale, MD
Flood risk 1/10 · Minimal
- FEMA flood zone
- X (unshaded)
- Chance of flooding over 30 yrs
- 0.0%
- Est. flood insurance / yr
- $473 – $860
Fire risk 1/10 · Minimal
- Est. fire insurance / yr
- $755 – $1,403
Heat risk 7/10 · Major
- Hot days now (above 103°F)
- 7 days/yr
- Hot days in 30 yrs
- 15 days/yr
Wind risk 6/10 · Moderate
- Chance of severe wind over 30 yrs
- 27.0%
Air-quality risk 5/10 · Moderate
- Unhealthy air days now
- 6 days/yr
- Unhealthy air days in 30 yrs
- 8 days/yr
Risk factors via First Street. Map © Google.
Why this score? — see what drove the F grade
The composite is a weighted blend of 9 inputs, each scored 0–100. Each bar is that input's sub-score; the figure is the points it added to the 100-point composite (weight × sub-score).
- ARV discount +7.5/15.0
- Cash flow +6.8/30.0
- Livability +4.0/5.0
- Rent growth +3.7/5.0
- Condition / age +2.5/5.0
- Schools +2.3/10.0
- 1% rule +1.8/10.0
- DSCR +1.0/10.0
- Appreciation +0.0/10.0
$10,000
🖨 Deal sheet 📄 Offer letter ✓ Due diligence
Listing remarks
ONSITE SUBSTITUTE TRUSTEES' SALE. AUCTION O BE HELD AT THE PROPERTY LOCATED AT 6720 Garvey Rd. Rosedale, MD 21237. BIDDERS MUST HAVE THE ADVERTISED DEPOSIT ON-SITE IN THE FORM OF CERTIFIED FUNDS. THERE IS NO ONLINE BIDDING FOR THIS AUCTION. NO ACCESS PRIOR TO THE AUCTION. Piel Law Firm, LLC 502 Washington Avenue, Suite 730 Towson, Maryland 21204. Under and by virtue of the power of sale contained in that certain Purchase Money Deed of Trust and Assignment of Leases and Rents executed by All Inclusive Holdings LLC and dated June 14, 2024, and recorded among the Land Records of Baltimore County, Maryland, at Liber 49365, folio 188 (the “Deed of Trust”), the holder of the indebtedn
Key facts
- 9,752 sq ft lot
- 2 parking spots
- Pool
Neighborhood map
What this means for you Summary
Snapshot
- This is a 3-bed/2.5-bath single-family listed at $10k.
Deal economics
- At list price, monthly cash flow is $-600 ($-7k/yr) — negative.
- The deal already cash-flows at list — no discount required.
- Meets the 1% rule at list price ($3k rent vs $10k).
Location & tenants
- Location reads 81/100 on livability (#37 in MD, #1,338 nationally) — a professional / high-income tenant draw. Strengths: commute A+, housing A+, health & safety A+; Watch: crime F.
- Baltimore County Public Schools (suburban): math 15% / reading 34% proficiency, ranked #11 of 24 in MD (top 46%) — low school quality limits family demand, transient renter base, plan for 1-2y turnover.
- Market conditions: Rents rising fast (+5.0%/yr); 101 active listings in the ZIP; 10 comparable units currently listed for rent nearby; rentals at typical pace (median 24d on market — plan ~3-4 weeks tenant-placement turnaround); 40% of comp listings sitting > 30 days — soft ceiling on asking rent; solid renter incomes; 1,511 units permitted in Baltimore County in 2024 (643 in 5+ unit buildings).
- This rent runs 34% of the median local income ($92k/yr) — at the standard rent-burdened threshold; future hikes will face affordability resistance.
Forward outlook
- Local home prices are declining (-3.0%/yr); year-one equity from $3k of loan paydown is wiped out by about $11k of value loss. Plan a longer hold.
- Baltimore County population projected at +12% by 2050 — modest demand growth; plan on rents tracking national, not racing it.
Negotiation context
- Only 7 days on market — expect competitive offers; lowballing is unlikely to land.
Risks & watch-outs
- Watch-outs: property tax is 57.1% of price.
- Climate carrying-cost: major wind risk, 27% chance of damaging wind over 30y; extreme-heat days projected 7→15/yr by 2055 (HVAC capex compounding) — expect insurance premiums to compound above CPI over the hold.
Questions for the listing agent
- What do current leases actually rent for vs. the listed asking? Can we see a recent rent roll and the last 12 months of T-12 income?
- Built in 1967 — when were the roof, HVAC, electrical panel, plumbing, and water heater last replaced?
- Property tax is high relative to price — has the assessment been appealed recently, and will the sale trigger a re-assessment?
- Is there a deadline driving the sale (1031 exchange, divorce, estate, relocation)? That informs how much negotiation room exists.
- Crime grade is F in this area — have there been break-ins, vandalism, or insurance claims at this property in the last 3 years? What carrier currently insures it and at what premium?
- The area grade is low — what's the realistic commute time and amenity access for the typical tenant pool here? Any planned neighborhood developments (good or bad) we should know about?
- What's the average days-on-market for RENTAL listings here right now (not sales)? A rising rental-DOM trend means longer vacancies and softer asking-rent achievability than the comps imply.
- What's the recent tenant-quality profile in this submarket — average credit score on applications, eviction rate, late-payment / NSF rate, and stable-employment percentage? A property-management company in the area should have these aggregated.
- How much new for-sale + rental construction is in the pipeline within 1–3 miles? Heavy new supply typically softens prices + rents 12–24 months out; constrained supply supports both.
Investment metrics
- 1% rule
- 0.68% ✗
- Cap rate
- 4.40%
- Cash-on-cash
- -6.76%
- DSCR
- 0.70
- GRM
- 12.3
CMA / ARV
- ARV (on-the-fly)
- $380,376
- Comps found
- 12
Show comp detail 12 sales within ~0.75 mi
| Address | Dist | Beds/Ba | Sqft | Sold | Price | $/sf | Match |
|---|---|---|---|---|---|---|---|
| 6819 Fordcrest Rd | 0.11mi | 3/2.0 | 1,598 (-9%) | 14mo | $359,900 | $225 | 66 |
| 6420 Kenwood Ave | 0.45mi | 3/2.0 | 1,644 (-7%) | 2mo | $310,000 | $189 | 65 |
| 6412 Martinique Rd | 0.24mi | 4/3.0 (+1) | 1,720 (-2%) | 18mo | $380,000 | $221 | 63 |
| 1821 Weyburn Rd | 0.60mi | 4/1.5 (+1) | 1,816 (+3%) | 2mo | $330,000 | $182 | 57 |
| 9015 Tarpleys Cir | 0.53mi | 4/2.0 (+1) | 1,889 (+7%) | 2mo | $435,000 | $230 | 55 |
| 1814 Weyburn Rd | 0.64mi | 3/1.5 | 1,884 (+7%) | 4mo | $265,000 | $141 | 52 |
| 15 Chriswell Ct | 0.55mi | 4/3.0 (+1) | 1,801 (+2%) | 15mo | $441,500 | $245 | 51 |
| 8426 Coco Rd | 0.58mi | 4/3.0 (+1) | 1,869 (+6%) | 10mo | $359,900 | $193 | 47 |
| 1835 Weyburn Rd | 0.54mi | 4/3.0 (+1) | 1,816 (+3%) | 20mo | $346,100 | $191 | 46 |
| 8440 Coco Rd | 0.48mi | 4/2.0 (+1) | 1,898 (+8%) | 17mo | $292,000 | $154 | 44 |
| 6522 Corkley Rd | 0.57mi | 4/3.0 (+1) | 1,526 (-13%) | 14mo | $330,000 | $216 | 33 |
| 8402 Allison Ln | 0.62mi | 4/2.0 (+1) | 1,508 (-14%) | 14mo | $360,000 | $239 | 28 |
Match score weights: distance 35% · size 25% · config 20% · recency 20%. Top-matched comps best support the ARV.
Projected returns pro-forma
-3.0% appreciation · 4.97% rent growth · sell at horizon
- IRR
- -25.8%
- Equity multiple
- 0.11×
- Total profit
- $-94,603
- Equity at exit
- $56,715
- IRR
- -17.2%
- Equity multiple
- -0.03×
- Total profit
- $-109,229
- Equity at exit
- $32,888
Cash invested: $106,505 (down + closing). Projections, not guarantees.
Landlord ↔ Tenant lean methodology
- Overall (STATE)
- 27 Tenant-Leaning
- State Maryland
- 27 Tenant-Leaning · D+14
- County
- — inherits STATE
- City
- — inherits STATE
ZIP-level market 21237
- Rents YoY
- 5.0%
- Active inventory
- 101
- Price-to-rent
- 0.3×
Monthly cashflow live
- Estimated rent
- $2,568 high interval (Pro) →
- Mortgage (P&I)
- −$1,995
- Tax est. 1.5%
- −$475 /mo · $5,706/yr
- Insurance
- −$158
- HOA
- −$0
- Vacancy / Maint / Mgmt
- −$539
- Net cashflow
- $-600
Break-even live
UW: 25.0% down · 7.5% · 30yr · 1.5% tax · 5.0% vac · 8.0% maint · 8.0% mgmt
Financing live
Cash to close
- Down payment
- $95,094
- Closing costs
- $11,411
- Reserves months
- —
- Total cash needed
- —
Loan-product check · same deal, 3 products live
Conventional
25% down · 7.5% · 30yr
- Down + closing
- —
- Monthly P&I
- —
- Monthly cashflow
- —
- DSCR
- —
- Eligible?
- —
Personal DTI + credit; lowest rate.
DSCR
20% down · 8.5% · 30yr
- Down + closing
- —
- Monthly P&I
- —
- Monthly cashflow
- —
- DSCR
- —
- Eligible?
- —
No personal income docs; deal must DSCR.
Hard money
10% down · 12.0% · 12mo
- Down + closing
- —
- Monthly P&I
- —
- Monthly cashflow
- —
- DSCR
- —
- Eligible?
- —
Short-term bridge; refi at stabilization.
Rent comps 10 comps
| Address | Beds | Baths | Sqft | Rent | $/sqft | DOM | Units | Dist |
|---|---|---|---|---|---|---|---|---|
| 30 Morning Ct Rosedale, MD | 3.0 | 3.5 | 1980 | $3,350 | $1.69 | 17d | 1 | 0.18mi |
| 32 Tameron Pl Rosedale, MD | 3.0 | 2.5 | 1720 | $2,300 | $1.34 | 2d | 1 | 0.22mi |
| 13 Bohn Ct Rosedale, MD | 3.0 | 1.5 | 1566 | $1,800 | $1.15 | 43d | 1 | 0.83mi |
| 8852 Pennsbury Pl Rosedale, MD | 3.0 | 1.5 | 1400 | $1,850 | $1.32 | 24d | 1 | 0.84mi |
| 8501 Franklin Square Dr Baltimore, MD | 1.0–3.0 | 1.0–2.0 | 950 | $2,780 | $2.93 | 1d | 19 | 0.89mi |
| 8212 Dorset Ave Rosedale, MD | 4.0 | 1.5 | 1479 | $2,250 | $1.52 | 43d | 1 | 1.03mi |
| 8133 Bartholomew Ct Baltimore, MD | 3.0 | 2.5 | 1600 | $2,700 | $1.69 | 24d | 1 | 1.36mi |
| 5110 Kenwood Ave Baltimore, MD | 3.0 | 1.5 | 1406 | $2,500 | $1.78 | 43d | 1 | 1.41mi |
| 8006 Woodhaven Ct Rosedale, MD | 4.0 | 3.0 | 1680 | $3,200 | $1.90 | 24d | 1 | 1.42mi |
| 1732 Chesaco Ave Rosedale, MD | 3.0 | 1.0 | 1260 | $2,295 | $1.82 | 43d | 1 | 1.46mi |
Listing history 3 events
-
2025-08-13status Pending
-
2025-08-06$10,000 Active
-
1972-07-21soldstatus $42,000
ⓘ Source: listings_history table (triggers on properties + properties_extension) + one-shot
backfill from property_details.listing_events for pre-trigger history.
Climate risk First Street
- Flood 1/10 Low FEMA zone X (unshaded) · 0% chance over 30 yrs
- Wildfire 1/10 Low
- Heat 7/10 Severe 7 d/yr ≥103°F today · 15 d/yr by 30 yrs out
- Wind 6/10 Major 27% chance of damaging wind over 30 yrs
- Air quality 5/10 Major 6 unhealthy d/yr today · 8 by 30 yrs out
Nearby sold comps map
Loading sold comps map…
Walkable amenities ~0.75 mi
Loading nearby amenities…
Taxation est. · year 1
- Rental income
- $30,820
- − Mortgage interest
- −$21,307
- − Property taxes
- −$5,706
- − Insurance
- −$1,902
- − Repairs & maintenance
- −$2,466
- − Management
- −$2,466
- − Depreciation
- −$11,065
- Taxable loss
- −$14,091
- Est. tax savings @ 24.0%
- +$3,382
- After-tax cash flow
- $-3,815/yr
For passive investors: Depreciation is non-cash, so a rental often shows a tax loss while cash-flowing — sheltering income. Rental losses are passive: they offset passive income freely, and up to $25,000/yr can offset ordinary (W-2) income if you actively participate and your MAGI is under $100k (phasing out to $0 by $150k); unused losses carry forward. On sale, claimed depreciation is recaptured at up to 25%, and gains may owe capital-gains tax (a 1031 exchange can defer both). Figures are a year-1 estimate at your 24.0% rate — not tax advice; consult a CPA.
Schools (NCES district)
- District
- Baltimore County Public Schools
- NCES district ID
- 2400120
- Math proficiency
- 15% ▼ -16.00%
- Reading proficiency
- 34% ▼ -5.00%
- Median HH income
- $66,746
- Composite
- 23.17/100
- National rank
- #7948
- State rank
- #11 of 24 in MD
Livability — Rosedale
- Score
- 81/100
- State rank
- #37
- US rank
- #1338
Category grades
Schools grade is shown separately in the Schools card above.
Census & demographics
- Census place
- Rosedale, MD
- County
- Baltimore County · 769,527 people
- City population
- 30,851
- Metro
- Baltimore-Columbia-Towson, MD
- Population (ZIP)
- 31,425
- Household income
- $91,693
- Rent vs Own
- Severe rent burden
- 887.0
Population outlook (Baltimore County) Hauer SSP2
- Today (2025)
- 885,518 people
- By 2030
- 909,272 · +2.7%
- By 2040
- 951,547 · +7.5%
- By 2050
- 990,955 · +11.9%
- By 2075
- 1,086,411 · +22.7%
- By 2100
- 1,135,078 · +28.2%
Race, ethnicity, and origin ACS 2023
- Neighborhood character
- Diverse neighborhood (Simpson 0.66)
- Race & ethnicity
- White 42% Black 38% Hispanic / Latino 9% Asian 7% Two or more races 5%
- Hispanic origin (detail)
- Mexican 1% Puerto Rican 2% Cuban 1%
- Common ancestry
- Romanian 5% Lithuanian 1% Slovak 1%
- Foreign-born
- 17% · Canada, India, South Korea
- Languages at home
- 78% English-only · Spanish 7% Other Indo-European 4% Tagalog/Filipino 2%
Political lean MEDSL · Baltimore
- 2024 margin
- Strong D (+24.5) · D 61.0% · R 36.5% · Other 2.5%
- 2008→2024 swing
- +9.9pp toward D · 2008: 14.6pp · 2024: 24.5pp
- All cycles
- 2024: D+24.5 2020: D+27.0 2016: D+17.4 2012: D+16.4 2008: D+14.6
Not yet ingested
- Civics
- —
Market trends
- HPI YoY
- ▼ -151.40%
- Current HPI
- 242.8057
- Rent YoY
- ▲ 4.97%
- Metro
- Baltimore-Columbia-Towson, MD
- State GDP YoY
- ▲ 2.97%
- F500 in state
- 12
Industry mix (Fortune 500 HQ in MD)
| Industry | F500 HQs | Revenue |
|---|---|---|
| Aerospace / Defense | 1 | $71B |
|
||
| Utilities | 1 | $25B |
|
||
| Hotels | 1 | $24B |
|
||
| Consumer Goods | 1 | $7B |
|
||
| Real Estate | 1 | $6B |
|
||
| Chemicals | 1 | $2B |
|
||
Price history
-76.2% since first listed3 events — show timeline
- 2025-08-13 Pending — BRIGHT MLS
- 2025-08-06 Listed $10,000 BRIGHT MLS
- 1972-07-21 Sold (Public Records) $42,000 Public Records
Property tax history
+3.1%/yrLatest (2025): $3,940 · +12.2% YoY. Source: county tax records.
Cash-flow waterfall
monthlySold comps — $/sqft
last 12 mo · ≤1 miLoading sold comps…