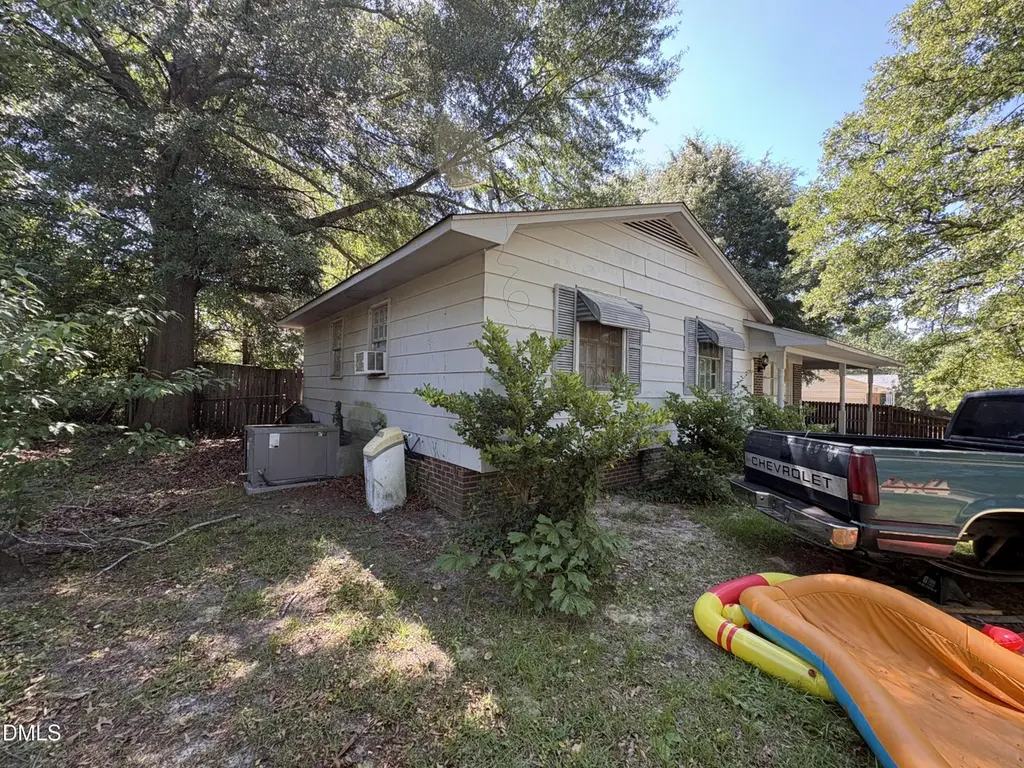
925 Wicker Ct · Fayetteville, NC
Flood risk 1/10 · Minimal
- FEMA flood zone
- X (unshaded)
- Chance of flooding over 30 yrs
- 0.0%
- Est. flood insurance / yr
- $507 – $1,088
Fire risk 4/10 · Minor
- Est. fire insurance / yr
- $906 – $1,684
Heat risk 7/10 · Major
- Hot days now (above 106°F)
- 7 days/yr
- Hot days in 30 yrs
- 16 days/yr
Wind risk 7/10 · Major
- Chance of severe wind over 30 yrs
- 75.0%
Air-quality risk 1/10 · Minimal
- Unhealthy air days now
- 0 days/yr
- Unhealthy air days in 30 yrs
- 0 days/yr
Risk factors via First Street. Map © Google.
Why this score? — see what drove the B- grade
The composite is a weighted blend of 9 inputs, each scored 0–100. Each bar is that input's sub-score; the figure is the points it added to the 100-point composite (weight × sub-score).
- Cash flow +24.3/30.0
- ARV discount +15.0/15.0
- DSCR +7.8/10.0
- 1% rule +6.5/10.0
- Livability +3.8/5.0
- Rent growth +3.3/5.0
- Schools +3.1/10.0
- Condition / age +2.5/5.0
- Appreciation +0.0/10.0
$120,000
🖨 Deal sheet 📄 Offer letter ✓ Due diligence
Listing remarks
Welcome to 925 Wicker Ct, a charming house located in Fayetteville, NC. This residence presents a wonderful opportunity to own a property in a convenient location. Surrounded by mature trees and a welcoming neighborhood ambiance, this home boasts a classic exterior design with a well-maintained front yard. Inside, you'll find spacious living areas that provide a comfortable setting for daily living. The layout of the home is designed to accommodate various lifestyles, with plenty of potential to personalize the space. The property also includes a backyard, has outdoor space for relaxation or social gatherings. The location provides easy access to local amenities and community resources, mak
Key facts
- Backyard
- Outdoor space
- 0.27 acre lot
Tags
Property features AI
Finance
- HOA & community: No homeowners association
Exterior
- Parking: Carport (1 space); Open parking with 3 spaces; Total parking for 3 vehicles
- Utilities: Public water; Public sewer
- Home design: One-story house
- Construction: Brick and wood siding exterior; Brick/mortar foundation; Composition/shingle roof; Built as a house (living area listed as 1,162)
- Exterior features: Other exterior features; Lot approximately 0.27 acres (about 85 x 75)
Interior
- Bedrooms: 3 bedrooms (all on the main level)
- Flooring: Hardwood floors
- Bathrooms: 1 full bathroom
- Heating & cooling: No heating; Central air conditioning
- Interior features: Other interior features
Neighborhood map
What this means for you Summary
Snapshot
- This is a 3-bed/2.0-bath single-family listed at $120k.
Deal economics
- At list price, monthly cash flow is $241 ($3k/yr) — positive.
- The deal already cash-flows at list — no discount required.
- Meets the 1% rule at list price ($1k rent vs $120k).
- Cap rate 8.7% vs local median 4.9% in Fayetteville — top-decile yield for the area; either an underpriced asset or a hidden risk that comps aren't pricing in. Stress-test before assuming the spread holds.
Location & tenants
- Location reads 75/100 on livability (#45 in NC, #4,031 nationally) — a middle-class / working-renter tenant base. Strengths: commute A+, cost of living A+, housing A+; Watch: schools C-, crime F, employment D-.
- Cumberland County Schools (urban): math 32% / reading 41% proficiency, ranked #126 of 178 in NC (top 71%) — families likely to look elsewhere, expect single-tenant / working-renter base with shorter leases.
- Market conditions: Rents rising (+3.2%/yr); 302 active listings in the ZIP; 38 comparable units currently listed for rent nearby; rentals at typical pace (median 24d on market — plan ~3-4 weeks tenant-placement turnaround); 1,125 units permitted in Cumberland County in 2024 (104 in 5+ unit buildings).
Forward outlook
- Local home prices are declining (-3.0%/yr); year-one equity from $830 of loan paydown is wiped out by about $4k of value loss. Plan a longer hold.
Negotiation context
- Only 9 days on market — expect competitive offers; lowballing is unlikely to land.
- Current owner paid $48k; list at $120k implies a 147% gain — meaningful room to come down on a strong offer.
Risks & watch-outs
- Climate carrying-cost: major wind risk, 75% chance of damaging wind over 30y; extreme-heat days projected 7→16/yr by 2055 (HVAC capex compounding) — expect insurance premiums to compound above CPI over the hold.
Questions for the listing agent
- Built in 1973 — when were the roof, HVAC, electrical panel, plumbing, and water heater last replaced?
- Is there a deadline driving the sale (1031 exchange, divorce, estate, relocation)? That informs how much negotiation room exists.
- Crime grade is F in this area — have there been break-ins, vandalism, or insurance claims at this property in the last 3 years? What carrier currently insures it and at what premium?
- What's the average days-on-market for RENTAL listings here right now (not sales)? A rising rental-DOM trend means longer vacancies and softer asking-rent achievability than the comps imply.
- What's the recent tenant-quality profile in this submarket — average credit score on applications, eviction rate, late-payment / NSF rate, and stable-employment percentage? A property-management company in the area should have these aggregated.
- How much new for-sale + rental construction is in the pipeline within 1–3 miles? Heavy new supply typically softens prices + rents 12–24 months out; constrained supply supports both.
Investment metrics
- 1% rule
- 1.15% ✓
- Cap rate
- 8.70%
- Cash-on-cash
- 8.60%
- DSCR
- 1.38
- GRM
- 7.2
CMA / ARV
- ARV (on-the-fly)
- $180,110
- Comps found
- 12
Show comp detail 12 sales within ~0.75 mi
| Address | Dist | Beds/Ba | Sqft | Sold | Price | $/sf | Match |
|---|---|---|---|---|---|---|---|
| 1104 Odom Dr | 0.14mi | 3/1.0 | 1,143 (-2%) | 2mo | $170,000 | $149 | 85 |
| 4909 Walnut Dr | 0.32mi | 3/1.0 | 1,136 (-2%) | 1mo | $180,000 | $158 | 76 |
| 1005 Juniper Dr | 0.38mi | 3/1.0 | 1,107 (-5%) | 1mo | $169,000 | $153 | 70 |
| 819 Sandalwood Dr | 0.51mi | 3/1.0 | 1,156 (-0%) | 2mo | $176,000 | $152 | 69 |
| 1334 Devonshire Dr | 0.36mi | 3/1.5 | 1,067 (-8%) | 0mo | $112,000 | $105 | 68 |
| 821 Sandalwood Dr | 0.52mi | 3/1.0 | 1,204 (+4%) | 1mo | $140,000 | $116 | 65 |
| 1011 Juniper Dr | 0.38mi | 3/2.0 | 1,011 (-13%) | 2mo | $184,999 | $183 | 59 |
| 1209 Martindale Dr | 0.69mi | 3/1.0 | 1,132 (-3%) | 1mo | $175,000 | $155 | 59 |
| 1707 Camelot Dr | 0.73mi | 3/2.0 | 1,116 (-4%) | 2mo | $204,000 | $183 | 58 |
| 5219 Redwood Dr | 0.73mi | 3/1.0 | 1,124 (-3%) | 1mo | $187,000 | $166 | 55 |
| 3901 Hartwell Rd | 0.72mi | 3/2.0 | 1,066 (-8%) | 2mo | $160,000 | $150 | 51 |
| 1726 Martindale Dr | 0.57mi | 3/2.5 | 1,311 (+13%) | 2mo | $223,000 | $170 | 49 |
Match score weights: distance 35% · size 25% · config 20% · recency 20%. Top-matched comps best support the ARV.
Projected returns pro-forma
-3.0% appreciation · 3.17% rent growth · sell at horizon
- IRR
- -3.0%
- Equity multiple
- 0.89×
- Total profit
- $-3,834
- Equity at exit
- $17,892
- IRR
- 6.9%
- Equity multiple
- 1.52×
- Total profit
- $17,523
- Equity at exit
- $10,375
Cash invested: $33,600 (down + closing). Projections, not guarantees.
Landlord ↔ Tenant lean methodology
- Overall (STATE)
- 85 Strongly Landlord-Friendly
- State North Carolina
- 85 Strongly Landlord-Friendly · R+3
- County
- — inherits STATE
- City
- — inherits STATE
ZIP-level market 28304
- Home prices YoY
- -21.7%
- Rents YoY
- 3.2%
- Active inventory
- 302
- Price-to-rent
- 7.2×
Monthly cashflow live
- Estimated rent
- $1,380 high interval (Pro) →
- Mortgage (P&I)
- −$629
- Tax from tax record
- −$170 /mo · $2,041/yr
- Insurance
- −$50
- HOA
- −$0
- Vacancy / Maint / Mgmt
- −$290
- Net cashflow
- $241
Break-even live
UW: 25.0% down · 7.5% · 30yr · 1.5% tax · 5.0% vac · 8.0% maint · 8.0% mgmt
Financing live
Cash to close
- Down payment
- $30,000
- Closing costs
- $3,600
- Reserves months
- —
- Total cash needed
- —
Loan-product check · same deal, 3 products live
Conventional
25% down · 7.5% · 30yr
- Down + closing
- —
- Monthly P&I
- —
- Monthly cashflow
- —
- DSCR
- —
- Eligible?
- —
Personal DTI + credit; lowest rate.
DSCR
20% down · 8.5% · 30yr
- Down + closing
- —
- Monthly P&I
- —
- Monthly cashflow
- —
- DSCR
- —
- Eligible?
- —
No personal income docs; deal must DSCR.
Hard money
10% down · 12.0% · 12mo
- Down + closing
- —
- Monthly P&I
- —
- Monthly cashflow
- —
- DSCR
- —
- Eligible?
- —
Short-term bridge; refi at stabilization.
Rent comps 38 comps
| Address | Beds | Baths | Sqft | Rent | $/sqft | DOM | Units | Dist |
|---|---|---|---|---|---|---|---|---|
| 4909 Walnut Dr Fayetteville, NC | 3.0 | 2.0 | 1188 | $1,500 | $1.26 | 23d | 1 | 0.31mi |
| 4935 Walnut Dr Fayetteville, NC | 3.0 | 1.5 | 1024 | $1,200 | $1.17 | 13d | 1 | 0.38mi |
| 4101 Coventry Rd Fayetteville, NC | 3.0 | 1.0 | 1132 | $1,150 | $1.02 | 13d | 1 | 0.49mi |
| 821 Sandalwood Dr Fayetteville, NC | 3.0 | 1.0 | 1204 | $1,200 | $1.00 | 13d | 1 | 0.54mi |
| 4810 Alamance Rd Fayetteville, NC | 1.0–2.0 | 1.0–2.0 | 827 | $1,200 | $1.45 | 23d | 1 | 0.55mi |
| 910 Miller Ave Unit 910 Fayetteville, NC | 2.0 | 2.0 | 1000 | $1,250 | $1.25 | 23d | 1 | 0.57mi |
| 909 Sandalwood Dr Fayetteville, NC | 3.0 | 1.0 | 1346 | $1,595 | $1.18 | 23d | 1 | 0.58mi |
| 5200 Cypress Rd Fayetteville, NC | 3.0 | 1.0 | 1210 | $1,250 | $1.03 | 23d | 1 | 0.64mi |
| 1313 Ireland Dr Unit B Fayetteville, NC | 2.0 | 1.5 | 900 | $1,000 | $1.11 | 23d | 1 | 0.67mi |
| 1309 Ireland Dr Fayetteville, NC | 2.0 | 1.5 | 900 | $1,000 | $1.11 | 13d | 1 | 0.68mi |
| 5632 Birch Rd Fayetteville, NC | 3.0 | 1.0 | 1228 | $1,250 | $1.02 | 23d | 1 | 0.87mi |
| 400 Roxie Ave Fayetteville, NC | 2.0 | 2.0 | 1162 | $1,700 | $1.46 | 13d | 1 | 0.93mi |
| 3526 Furman Dr Fayetteville, NC | 3.0 | 1.5 | 1050 | $1,500 | $1.43 | 23d | 1 | 0.94mi |
| 1805 Wayne Ln Fayetteville, NC | 3.0 | 1.0 | 975 | $2,400 | $2.46 | 23d | 1 | 0.98mi |
| 1401 Carnsmore Dr Fayetteville, NC | 3.0 | 2.5 | 1450 | $1,575 | $1.09 | 23d | 1 | 1.10mi |
| 4630 Canterbury Rd Fayetteville, NC | 3.0 | 2.0 | 1250 | $1,350 | $1.08 | 23d | 1 | 1.10mi |
| 5842 Aftonshire Dr Fayetteville, NC | 2.0 | 1.5 | 1010 | $1,000 | $0.99 | 23d | 1 | 1.13mi |
| 5864 Aftonshire Dr Fayetteville, NC | 2.0 | 2.0 | 1100 | $1,100 | $1.00 | 23d | 1 | 1.17mi |
| 1413 Tangora Ln Fayetteville, NC | 2.0 | 1.5 | 945 | $979 | $1.04 | 13d | 1 | 1.18mi |
| 5876 Aftonshire Dr Fayetteville, NC | 2.0 | 1.5 | 1024 | $1,015 | $0.99 | 23d | 1 | 1.19mi |
| 1406 Tangora Ln Fayetteville, NC | 2.0 | 2.5 | 1192 | $1,015 | $0.85 | 23d | 1 | 1.22mi |
| 4809 Belford Rd Fayetteville, NC | 3.0 | 1.5 | 1459 | $1,300 | $0.89 | 23d | 1 | 1.23mi |
| 5744 Aftonshire Dr Fayetteville, NC | 2.0 | 1.5 | 945 | $999 | $1.06 | 23d | 1 | 1.24mi |
| 5713 Aftonshire Dr Fayetteville, NC | 2.0 | 2.5 | 1025 | $995 | $0.97 | 13d | 1 | 1.24mi |
| 1216 Weeping Willow Way Unit 229 Fayetteville, NC | 3.0 | 2.0 | 960 | $969 | $1.01 | 13d | 1 | 1.25mi |
| 3411 Lainey Ln Fayetteville, NC | 2.0 | 2.0 | 1142 | $1,300 | $1.14 | 23d | 1 | 1.33mi |
| 613 Ashbrook Ct Fayetteville, NC | 3.0 | 1.5 | 1103 | $1,299 | $1.18 | 23d | 1 | 1.35mi |
| 600 Ashbrook Ct Fayetteville, NC | 2.0–3.0 | 1.5 | 1050 | $1,299 | $1.24 | 21d | 6 | 1.36mi |
| 609 Ashbrook Ct Fayetteville, NC | 2.0 | 1.5 | 997 | $1,049 | $1.05 | 23d | 1 | 1.38mi |
| 5032 Shimmer Dr Fayetteville, NC | 4.0 | 2.0 | 1473 | $1,700 | $1.15 | 13d | 1 | 1.38mi |
| 5032 Shimmer Dr Fayetteville, NC | 4.0 | 2.0 | 1473 | $1,750 | $1.19 | 23d | 1 | 1.38mi |
| 855 King Arthur Dr Fayetteville, NC | 1.0–2.0 | 1.0–2.0 | 810 | $1,182 | $1.46 | 13d | 9 | 1.39mi |
| 5721 Randleman St Fayetteville, NC | 3.0 | 2.0 | 1050 | $1,575 | $1.50 | 23d | 1 | 1.43mi |
| 3325 Boone Trl Fayetteville, NC | 4.0 | 2.0 | 1494 | $1,960 | $1.31 | 13d | 1 | 1.46mi |
| 5744 Randleman St Fayetteville, NC | 3.0 | 2.0 | 1171 | $1,395 | $1.19 | 23d | 1 | 1.48mi |
| 5151 Queensdale Dr Fayetteville, NC | 3.0 | 2.0 | 1107 | $1,295 | $1.17 | 23d | 1 | 1.48mi |
| 5151 Queensdale Dr Fayetteville, NC | 3.0 | 2.0 | 1107 | $1,295 | $1.17 | 13d | 1 | 1.48mi |
| 1008 Ancestry Dr Fayetteville, NC | 2.0 | 2.5 | 1200 | $1,045 | $0.87 | 23d | 1 | 1.48mi |
Listing history 8 events
-
2026-06-18days on market $120,000 Active 9 DOM
-
2026-06-17days on market $120,000 Active 8 DOM
-
2026-06-16days on market $120,000 Active 7 DOM
-
2026-06-15days on market $120,000 Active 6 DOM
-
2026-06-14days on market $120,000 Active 4 DOM
-
2026-06-13days on market $120,000 Active 3 DOM
-
2026-06-10remarks 699-char remark
-
2026-06-10$120,000 Active 1 DOM
ⓘ Source: listings_history table (triggers on properties + properties_extension) + one-shot
backfill from property_details.listing_events for pre-trigger history.
Tax reassessment forecast NC · Resets to sale price
- Current annual tax
- $2,041 · $170/mo
- Projected year-2 tax
- $2,041 · $170/mo
- Expected delta
- $0/yr ($0/mo · 0.0%)
ⓘ Screening estimate from a state-policy table — verify with the county assessor before closing.
Climate risk First Street
- Flood 1/10 Low FEMA zone X (unshaded) · 0% chance over 30 yrs
- Wildfire 4/10 Moderate
- Heat 7/10 Severe 7 d/yr ≥106°F today · 16 d/yr by 30 yrs out
- Wind 7/10 Severe 75% chance of damaging wind over 30 yrs
- Air quality 1/10 Low 0 unhealthy d/yr today · 0 by 30 yrs out
Nearby sold comps map
Loading sold comps map…
Walkable amenities ~0.75 mi
Loading nearby amenities…
Taxation est. · year 1
- Rental income
- $16,560
- − Mortgage interest
- −$6,722
- − Property taxes
- −$2,041
- − Insurance
- −$600
- − Repairs & maintenance
- −$1,325
- − Management
- −$1,325
- − Depreciation
- −$3,491
- Taxable income
- $1,057
- Est. tax owed @ 24.0%
- −$254
- After-tax cash flow
- $2,637/yr
For passive investors: Depreciation is non-cash, so a rental often shows a tax loss while cash-flowing — sheltering income. Rental losses are passive: they offset passive income freely, and up to $25,000/yr can offset ordinary (W-2) income if you actively participate and your MAGI is under $100k (phasing out to $0 by $150k); unused losses carry forward. On sale, claimed depreciation is recaptured at up to 25%, and gains may owe capital-gains tax (a 1031 exchange can defer both). Figures are a year-1 estimate at your 24.0% rate — not tax advice; consult a CPA.
Schools (NCES district)
- District
- Cumberland County Schools
- NCES district ID
- 3700011
- Math proficiency
- 32% ▼ -2.00%
- Reading proficiency
- 41% ▼ -1.00%
- Median HH income
- $44,168
- Composite
- 31.0/100
- National rank
- #6096
- State rank
- #126 of 178 in NC
Livability — Fayetteville
- Score
- 75/100
- State rank
- #45
- US rank
- #4031
Category grades
Schools grade is shown separately in the Schools card above.
Census & demographics
- Census place
- Fayetteville, NC
- County
- Cumberland County · 265,314 people
- City population
- 226,118
- Metro
- Fayetteville, NC
- Population (ZIP)
- 37,140
- Household income
- $58,563
- Rent vs Own
- Severe rent burden
- 1667.0
Population outlook (Cumberland County) Hauer SSP2
- Today (2025)
- 330,855 people
- By 2030
- 333,523 · +0.8%
- By 2040
- 335,583 · +1.4%
- By 2050
- 335,325 · +1.4%
- By 2075
- 342,853 · +3.6%
- By 2100
- 340,698 · +3.0%
Race, ethnicity, and origin ACS 2023
- Neighborhood character
- Highly diverse neighborhood (Simpson 0.70)
- Race & ethnicity
- Black 39% White 36% Hispanic / Latino 14% Two or more races 12% Asian 3% Native American 1%
- Hispanic origin (detail)
- Mexican 5% Puerto Rican 5%
- Common ancestry
- Slovak 2% Italian 1% Serbian 1%
- Foreign-born
- 8% · Canada, South Korea, Vietnam
- Languages at home
- 87% English-only · Spanish 9% Tagalog/Filipino 1% French/Haitian/Cajun 1%
Political lean MEDSL · Cumberland
- 2024 margin
- D (+13.4) · D 56.1% · R 42.7% · Other 1.2%
- 2008→2024 swing
- -4.3pp toward R · 2008: 17.7pp · 2024: 13.4pp
- All cycles
- 2024: D+13.4 2020: D+16.6 2016: D+16.0 2012: D+19.7 2008: D+17.7
Not yet ingested
- Civics
- —
Market trends
- HPI YoY
- ▼ -59.90%
- Current HPI
- 215.927
- Rent YoY
- ▲ 3.17%
- Metro
- Fayetteville, NC
- State GDP YoY
- ▲ 3.28%
- F500 in state
- 26
Industry mix (Fortune 500 HQ in NC)
| Industry | F500 HQs | Revenue |
|---|---|---|
| Financial Services | 2 | $213B |
|
||
| Retail | 2 | $95B |
|
||
| Industrial Conglomerate | 1 | $38B |
|
||
| Metals / Steel | 1 | $35B |
|
||
| Utilities | 1 | $30B |
|
||
| Industrial Machinery | 1 | $19B |
|
||
Price history
+77.8% since first listed3 events — show timeline
- 2026-06-09 Listed $120,000 TMLS
- 2020-08-31 Sold (Public Records) $48,500 Public Records
- 1997-01-31 Sold (Public Records) $67,500 Public Records
Property tax history
+5.5%/yrLatest (2025): $2,041 · +33.0% YoY. Source: county tax records.
Cash-flow waterfall
monthlySold comps — $/sqft
last 12 mo · ≤1 miLoading sold comps…