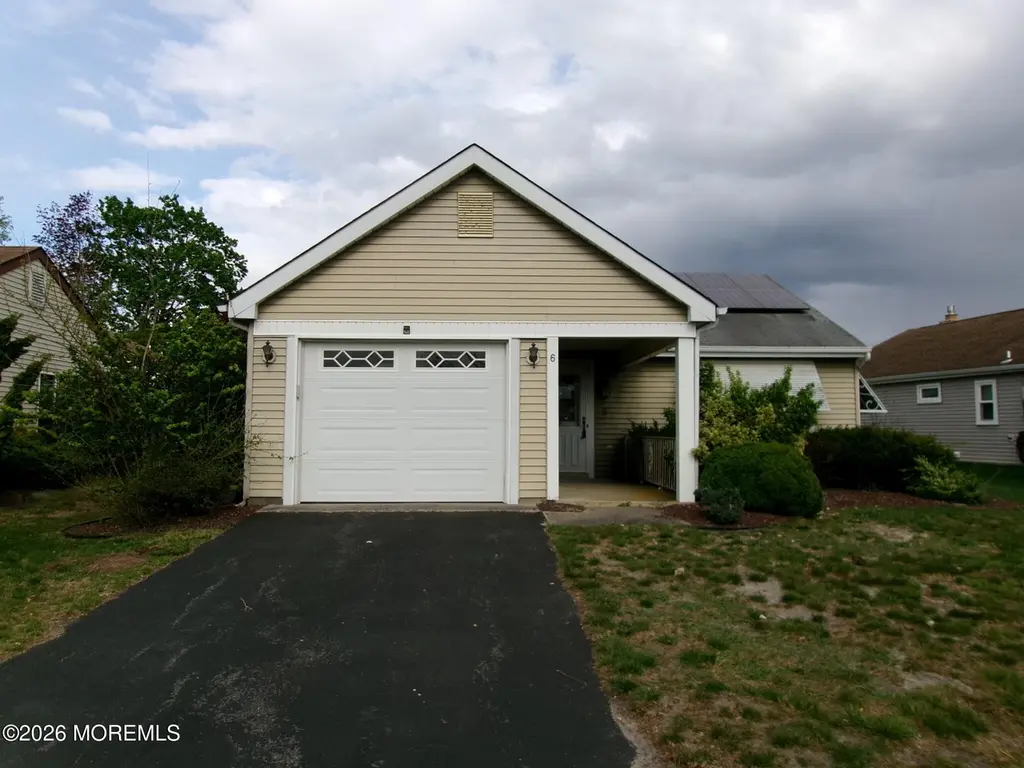
6 Harrow Pl · Leisure Knoll, NJ
Flood risk 1/10 · Minimal
- FEMA flood zone
- X (unshaded)
- Chance of flooding over 30 yrs
- 0.0%
- Est. flood insurance / yr
- $507 – $1,088
Fire risk 3/10 · Minor
- Est. fire insurance / yr
- $526 – $976
Heat risk 7/10 · Major
- Hot days now (above 102°F)
- 7 days/yr
- Hot days in 30 yrs
- 15 days/yr
Wind risk 6/10 · Moderate
- Chance of severe wind over 30 yrs
- 62.0%
Air-quality risk 3/10 · Minor
- Unhealthy air days now
- 3 days/yr
- Unhealthy air days in 30 yrs
- 4 days/yr
Risk factors via First Street. Map © Google.
Why this score? — see what drove the D grade
The composite is a weighted blend of 9 inputs, each scored 0–100. Each bar is that input's sub-score; the figure is the points it added to the 100-point composite (weight × sub-score).
- ARV discount +15.0/15.0
- Cash flow +9.1/30.0
- 1% rule +3.6/10.0
- Livability +3.3/5.0
- Schools +2.9/10.0
- DSCR +2.5/10.0
- Rent growth +2.5/5.0
- Condition / age +2.5/5.0
- Appreciation +0.0/10.0
$299,000
🖨 Deal sheet 📄 Offer letter ✓ Due diligence
Listing remarks
Adult community Rare 3-bed, 3-bath home in Leisure Knoll! This spacious property offers a great opportunity for buyers looking to add their own updates and finishing touches, bringing the home back to its former glory with a little TLC. Enjoy a clubhouse, heated saltwater pool, fitness center, bocce, tennis, and shuffleboard courts, library, social clubs, travel club, arts activities, plus lake dock and gazebo access for fishing. FHA Case # 351- 468243 Open to Nonprofits and Government Agencies Only first. FHA Financing UI (Uninsured) 203K Eligible FHA $100 Down Eligible Sold AS IS. Buyer pays all transfer fees and is responsible for all inspections and/or any township requirements, smoke
Key facts
- Tennis
- Fitness center
- Shuffleboard courts
Tags
Property features AI
Finance
- Other: Located in the Leisure Knoll subdivision
- HOA & community: HOA with clubhouse and common area; HOA fee $239 monthly; HOA covers trash, common area, pool, and snow removal
Exterior
- Parking: Attached garage with 1 garage space
- Utilities: Public sewer
- Home design: Ranch model; Fee simple ownership
- Exterior features: Shingle roof
Interior
- Kitchen: Electric cooking; Stove; Dishwasher; Refrigerator
- Bedrooms: 3 bedrooms (all on the first floor)
- Bathrooms: 3 full bathrooms
- Heating & cooling: Electric heating; Central air conditioning
- Interior features: Ceiling fans; Garbage disposal; No fireplaces
- Laundry & utility: Washer included
Neighborhood map
What this means for you Summary
Snapshot
- This is a 3-bed/3.0-bath single-family listed at $299k.
Deal economics
- At list price, monthly cash flow is $-229 ($-3k/yr) — negative.
- To cash-flow at today's rent, offer at most $259k (13.5% below list).
- To meet the 1% rule (rent ≥ 1% of price), the offer needs to be $258k (13.7% below list).
- Recommended offer: $258k (13.7% below list) — sets the bar for 1% rule.
- Cap rate 5.4% vs local median 4.0% in Leisure Knoll — top-decile yield for the area; either an underpriced asset or a hidden risk that comps aren't pricing in. Stress-test before assuming the spread holds.
Location & tenants
- Location reads 66/100 on livability (#346 in NJ) — a middle-class / working-renter tenant base. Strengths: crime A+, housing A+, health & safety A+; Watch: amenities F, commute F, cost of living F.
- Manchester Township School District (suburban): math 25% / reading 44% proficiency, ranked #320 of 472 in NJ (top 68%) — families likely to look elsewhere, expect single-tenant / working-renter base with shorter leases.
- Market conditions: 648 active listings in the ZIP; 3 comparable units currently listed for rent nearby; rentals leasing fast (median 2d on market — plan ~1-2 weeks tenant-placement turnaround); 4,434 units permitted in Ocean County in 2024 (868 in 5+ unit buildings).
Forward outlook
- Local home prices are declining (-3.0%/yr); year-one equity from $2k of loan paydown is wiped out by about $9k of value loss. Plan a longer hold.
- Ocean County population projected to shrink 8% by 2050 — rents likely to lag national; underwrite the cash flow, not the appreciation.
Negotiation context
- It's been on market 24 days — a 2% lower offer ($295k) is reasonable based on typical stale-listing flexibility.
- Current owner paid $125k; list at $299k implies a 139% gain — meaningful room to come down on a strong offer.
Risks & watch-outs
- Climate carrying-cost: major wind risk, 62% chance of damaging wind over 30y; extreme-heat days projected 7→15/yr by 2055 (HVAC capex compounding) — expect insurance premiums to compound above CPI over the hold.
Questions for the listing agent
- What do current leases actually rent for vs. the listed asking? Can we see a recent rent roll and the last 12 months of T-12 income?
- What does the HOA fee cover, when was the last increase, and are there any pending special assessments or reserve-fund shortfalls?
- Is there a deadline driving the sale (1031 exchange, divorce, estate, relocation)? That informs how much negotiation room exists.
- The area grade is low — what's the realistic commute time and amenity access for the typical tenant pool here? Any planned neighborhood developments (good or bad) we should know about?
- What's the average days-on-market for RENTAL listings here right now (not sales)? A rising rental-DOM trend means longer vacancies and softer asking-rent achievability than the comps imply.
- What's the recent tenant-quality profile in this submarket — average credit score on applications, eviction rate, late-payment / NSF rate, and stable-employment percentage? A property-management company in the area should have these aggregated.
- How much new for-sale + rental construction is in the pipeline within 1–3 miles? Heavy new supply typically softens prices + rents 12–24 months out; constrained supply supports both.
Investment metrics
- 1% rule
- 0.86% ✗
- Cap rate
- 5.37%
- Cash-on-cash
- -3.28%
- DSCR
- 0.85
- GRM
- 9.7
CMA / ARV
- ARV (median comp)
- $398,409
- List price
- $299,000
- Delta
- -24.95%
- Verdict
- UNDERPRICED
- Comps
- 20 within 1.0 mi
Show comp detail 12 sales within ~0.75 mi
| Address | Dist | Beds/Ba | Sqft | Sold | Price | $/sf | Match |
|---|---|---|---|---|---|---|---|
| 93 Mansfield Ave | 0.17mi | 2/2.0 (-1) | 1,551 (-3%) | 2mo | $440,000 | $284 | 77 |
| 9 Romford Ln | 0.25mi | 2/2.0 (-1) | 1,616 (+1%) | 1mo | $337,500 | $209 | 76 |
| 23 Twyford Ln | 0.26mi | 2/2.0 (-1) | 1,714 (+8%) | 2mo | $445,000 | $260 | 65 |
| 42 Twyford Ln | 0.26mi | 2/2.0 (-1) | 1,714 (+8%) | 2mo | $390,000 | $228 | 65 |
| 63 Sandhurst St | 0.20mi | 2/2.0 (-1) | 1,426 (-10%) | 1mo | $289,500 | $203 | 63 |
| 4 Harrogate Ln | 0.35mi | 2/2.0 (-1) | 1,714 (+8%) | 2mo | $310,000 | $181 | 61 |
| 15 Frilham Ln | 0.28mi | 2/2.0 (-1) | 1,427 (-10%) | 2mo | $230,000 | $161 | 59 |
| 63 Red Hill Rd | 0.38mi | 2/2.0 (-1) | 1,714 (+8%) | 2mo | $417,000 | $243 | 59 |
| 569B Mayfair Rd | 0.65mi | 2/2.0 (-1) | 1,602 (+0%) | 2mo | $285,000 | $178 | 58 |
| 27 Cromwell Ct | 0.33mi | 2/2.0 (-1) | 1,428 (-10%) | 0mo | $282,000 | $197 | 58 |
| 10 Saint Paul Pl | 0.39mi | 2/2.0 (-1) | 1,426 (-10%) | 1mo | $292,500 | $205 | 55 |
| 647C Dunstable Ct Unit C | 0.67mi | 2/2.0 (-1) | 1,468 (-8%) | 2mo | $300,000 | $204 | 45 |
Match score weights: distance 35% · size 25% · config 20% · recency 20%. Top-matched comps best support the ARV.
Projected returns pro-forma
-3.0% appreciation · 3.0% rent growth · sell at horizon
- IRR
- -21.7%
- Equity multiple
- 0.25×
- Total profit
- $-62,875
- Equity at exit
- $44,582
- IRR
- -15.3%
- Equity multiple
- 0.13×
- Total profit
- $-72,875
- Equity at exit
- $25,852
Cash invested: $83,720 (down + closing). Projections, not guarantees.
Landlord ↔ Tenant lean methodology
- Overall (STATE)
- 21 Tenant-Leaning
- State New Jersey
- 21 Tenant-Leaning · D+6
- County
- — inherits STATE
- City
- — inherits STATE
ZIP-level market 08759
- Active inventory
- 648
- Price-to-rent
- 9.7×
Monthly cashflow live
- Estimated rent
- $2,579 medium interval (Pro) →
- Mortgage (P&I)
- −$1,568
- Tax from tax record
- −$335 /mo · $4,017/yr
- Insurance
- −$125
- HOA
- −$239
- Vacancy / Maint / Mgmt
- −$542
- Net cashflow
- $-229
Break-even live
UW: 25.0% down · 7.5% · 30yr · 1.5% tax · 5.0% vac · 8.0% maint · 8.0% mgmt
Financing live
Cash to close
- Down payment
- $74,750
- Closing costs
- $8,970
- Reserves months
- —
- Total cash needed
- —
Loan-product check · same deal, 3 products live
Conventional
25% down · 7.5% · 30yr
- Down + closing
- —
- Monthly P&I
- —
- Monthly cashflow
- —
- DSCR
- —
- Eligible?
- —
Personal DTI + credit; lowest rate.
DSCR
20% down · 8.5% · 30yr
- Down + closing
- —
- Monthly P&I
- —
- Monthly cashflow
- —
- DSCR
- —
- Eligible?
- —
No personal income docs; deal must DSCR.
Hard money
10% down · 12.0% · 12mo
- Down + closing
- —
- Monthly P&I
- —
- Monthly cashflow
- —
- DSCR
- —
- Eligible?
- —
Short-term bridge; refi at stabilization.
Rent comps 3 comps
| Address | Beds | Baths | Sqft | Rent | $/sqft | DOM | Units | Dist |
|---|---|---|---|---|---|---|---|---|
| 19 Marlow Ave Manchester, NJ | 2.0 | 2.0 | 1551 | $2,400 | $1.55 | 1d | 1 | 0.14mi |
| 52 Rockingham Way #1 Manchester, NJ | 3.0 | 2.5 | 1848 | $3,275 | $1.77 | 43d | 1 | 0.99mi |
| 2501 Route 37 Manchester, NJ | 2.0 | 2.0–2.5 | 1252 | $3,468 | $2.77 | 1d | 6 | 1.17mi |
HOA detail
- Monthly dues
- $239 · $2,868/yr
- Likely covers
- waterpoolgym
Listing history 2 events
-
2026-05-03$299,000 Active 800-char remark
-
1987-03-30soldstatus $124,868
ⓘ Source: listings_history table (triggers on properties + properties_extension) + one-shot
backfill from property_details.listing_events for pre-trigger history.
Tax reassessment forecast NJ · Partial reset (capped growth)
- Current annual tax
- $4,017 · $335/mo
- Projected year-2 tax
- $5,731 · $478/mo
- Expected delta
- +$1,714/yr (+$143/mo · 42.7%)
ⓘ Screening estimate from a state-policy table — verify with the county assessor before closing.
Climate risk First Street
- Flood 1/10 Low FEMA zone X (unshaded) · 0% chance over 30 yrs
- Wildfire 3/10 Moderate
- Heat 7/10 Severe 7 d/yr ≥102°F today · 15 d/yr by 30 yrs out
- Wind 6/10 Major 62% chance of damaging wind over 30 yrs
- Air quality 3/10 Moderate 3 unhealthy d/yr today · 4 by 30 yrs out
Nearby sold comps map
Loading sold comps map…
Walkable amenities ~0.75 mi
Loading nearby amenities…
Taxation est. · year 1
- Rental income
- $30,947
- − Mortgage interest
- −$16,749
- − Property taxes
- −$4,017
- − Insurance
- −$1,495
- − Repairs & maintenance
- −$2,476
- − Management
- −$2,476
- − HOA
- −$2,868
- − Depreciation
- −$8,698
- Taxable loss
- −$7,832
- Est. tax savings @ 24.0%
- +$1,880
- After-tax cash flow
- $-869/yr
For passive investors: Depreciation is non-cash, so a rental often shows a tax loss while cash-flowing — sheltering income. Rental losses are passive: they offset passive income freely, and up to $25,000/yr can offset ordinary (W-2) income if you actively participate and your MAGI is under $100k (phasing out to $0 by $150k); unused losses carry forward. On sale, claimed depreciation is recaptured at up to 25%, and gains may owe capital-gains tax (a 1031 exchange can defer both). Figures are a year-1 estimate at your 24.0% rate — not tax advice; consult a CPA.
Schools (NCES district)
- District
- Manchester Township School District
- NCES district ID
- 3409450
- Math proficiency
- 25% ▼ -17.00%
- Reading proficiency
- 44% ▼ -5.00%
- Median HH income
- $38,905
- Composite
- 28.8/100
- National rank
- #6662
- State rank
- #320 of 472 in NJ
Livability — Leisure Knoll
- Score
- 66/100
- State rank
- #346
- US rank
- #11285
Category grades
Schools grade is shown separately in the Schools card above.
Census & demographics
- Census place
- Leisure Knoll, NJ
- Population (ZIP)
- 34,290
Population outlook (Ocean County) Hauer SSP2
- Today (2025)
- 586,991 people
- By 2030
- 581,403 · -1.0%
- By 2040
- 564,913 · -3.8%
- By 2050
- 538,149 · -8.3%
- By 2075
- 468,845 · -20.1%
- By 2100
- 350,297 · -40.3%
Race, ethnicity, and origin ACS 2023
- Neighborhood character
- Predominantly White (87%)
- Race & ethnicity
- White 87% Hispanic / Latino 5% Black 4% Two or more races 4% Asian 2%
- Hispanic origin (detail)
- Puerto Rican 2%
- Common ancestry
- Romanian 8% Scotch-Irish 2% Lithuanian 2%
- Foreign-born
- 11% · Canada, China
- Languages at home
- 88% English-only · Spanish 3% Russian/Polish/Slavic 2% Other Indo-European 2%
Political lean MEDSL · Ocean
- 2024 margin
- Solid R (+36.0) · D 31.4% · R 67.4% · Other 1.2%
- 2008→2024 swing
- -17.6pp toward R · 2008: -18.4pp · 2024: -36.0pp
- All cycles
- 2024: R+36.0 2020: R+28.7 2016: R+34.0 2012: R+17.7 2008: R+18.4
Not yet ingested
- Civics
- —
Market trends
- HPI YoY
- ▼ -347.85%
- Current HPI
- 274.4679
- Rent YoY
- —
- Metro
- —
- State GDP YoY
- ▲ 2.05%
- F500 in state
- 34
Industry mix (Fortune 500 HQ in NJ)
| Industry | F500 HQs | Revenue |
|---|---|---|
| Consumer Goods | 3 | $31B |
|
||
| Pharmaceuticals | 2 | $153B |
|
||
| Technology | 2 | $21B |
|
||
| Insurance | 2 | $20B |
|
||
| Healthcare | 2 | $19B |
|
||
| Financial Services | 1 | $70B |
|
||
Price history
+139.5% since first listed3 events — show timeline
- 2026-05-29 Pending — MOMLS
- 2026-05-03 Listed $299,000 MOMLS
- 1987-03-30 Sold (Public Records) $124,868 Public Records
Property tax history
+3.9%/yrLatest (2025): $4,017 · -1.9% YoY. Source: county tax records.
Cash-flow waterfall
monthlySold comps — $/sqft
last 12 mo · ≤1 miLoading sold comps…