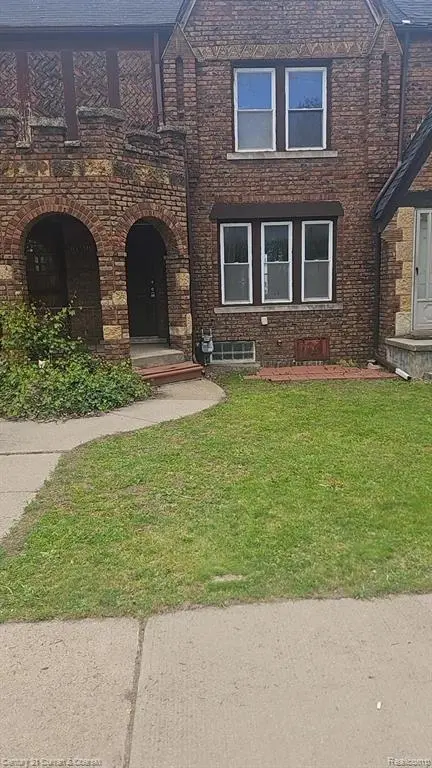
5845 Miller Rd · Dearborn, MI
Flood risk 1/10 · Minimal
- FEMA flood zone
- X (unshaded)
- Chance of flooding over 30 yrs
- 0.0%
- Est. flood insurance / yr
- $473 – $860
Fire risk 1/10 · Minimal
- Est. fire insurance / yr
- $784 – $1,456
Heat risk 3/10 · Minor
- Hot days now (above 96°F)
- 7 days/yr
- Hot days in 30 yrs
- 15 days/yr
Wind risk 2/10 · Minimal
- Chance of severe wind over 30 yrs
- —
Air-quality risk 3/10 · Minor
- Unhealthy air days now
- 2 days/yr
- Unhealthy air days in 30 yrs
- 4 days/yr
Risk factors via First Street. Map © Google.
Why this score? — see what drove the B grade
The composite is a weighted blend of 9 inputs, each scored 0–100. Each bar is that input's sub-score; the figure is the points it added to the 100-point composite (weight × sub-score).
- Cash flow +26.3/30.0
- ARV discount +15.0/15.0
- DSCR +8.9/10.0
- 1% rule +6.6/10.0
- Rent growth +5.0/5.0
- Livability +4.0/5.0
- Schools +2.8/10.0
- Condition / age +2.5/5.0
- Appreciation +0.0/10.0
$117,000
🖨 Deal sheet 📄 Offer letter ✓ Due diligence
Listing remarks MLS
Prime Investment Opportunity! Solid brick townhouse located in a high-demand East Dearborn pocket. At $125k, this well-maintained property offers incredible upside. Features include 2 spacious bedrooms, a versatile attic loft (perfect for a 3rd functional space), and a private backyard with a durable cement patio. High-efficiency layout with an unfinished basement and laundry area. Ideally situated near major shopping hubs and roadways, ensuring high rental demand and long-term appreciation. Add this East Dearborn gem to your portfolio before it's gone. Home sold in 'as is' condition. Send offers to listing agent by email.
Key facts
- Laundry area
- Private backyard
- Unfinished basement
Tags
Property features AI
Finance
- Other: Property listed as residential, single family
- Financial info: Financial details not provided
- HOA & community: HOA details not provided
Exterior
- Parking: No garage
- Security: Security details not provided
- Utilities: Public water; Public sewer
- Home design: Single-family residence; Two levels; Ground-level entry with steps; Brick exterior
- Construction: Brick construction; Block foundation; Built year not provided; Roof details not provided
- Exterior features: Covered porch; Paved road access; Lot dimensions approximately 18 x 90 (0.04 acres)
Interior
- Kitchen: Kitchen details not provided
- Bedrooms: Bedrooms info not provided
- Flooring: Flooring details not provided
- Bathrooms: 1 full bathroom
- Heating & cooling: Forced air heating (natural gas); Ceiling fan(s); No central cooling
- Interior features: 7 total rooms; Unfinished basement
- Laundry & utility: Laundry details not provided
Neighborhood map
What this means for you Summary
Snapshot
- This is a 2-bed/1.0-bath townhouse listed at $117k.
Deal economics
- At list price, monthly cash flow is $304 ($4k/yr) — positive.
- The deal already cash-flows at list — no discount required.
- Meets the 1% rule at list price ($1k rent vs $117k).
- Recommended offer: $115k (1.5% below list) — sets the bar for market timing.
- Cap rate 9.4% vs local median 4.3% in Dearborn — top-decile yield for the area; either an underpriced asset or a hidden risk that comps aren't pricing in. Stress-test before assuming the spread holds.
Location & tenants
- Location reads 80/100 on livability (#84 in MI, #1,904 nationally) — a professional / high-income tenant draw. Strengths: commute A+, cost of living A+, housing A+; Watch: amenities D, schools D-.
- Dearborn City School District (urban): math 26% / reading 39% proficiency, ranked #325 of 540 in MI (top 60%) — families likely to look elsewhere, expect single-tenant / working-renter base with shorter leases; 66% free/reduced lunch — lower-income household profile, screen leases tightly.
- Market conditions: Rents rising fast (+13.2%/yr); 102 active listings in the ZIP; 8 comparable units currently listed for rent nearby; rentals at typical pace (median 24d on market — plan ~3-4 weeks tenant-placement turnaround); lower-income renter base — watch delinquency; 2,639 units permitted in Wayne County in 2024 (1,216 in 5+ unit buildings).
- This rent runs 39% of the median local income ($42k/yr) — at the standard rent-burdened threshold; future hikes will face affordability resistance.
Forward outlook
- Local home prices are declining (-3.0%/yr); year-one equity from $809 of loan paydown is wiped out by about $4k of value loss. Plan a longer hold.
- Wayne County population projected at -17% by 2050 — secular population decline; favor cash flow + early exit over multi-decade hold.
- At projected returns (-3.0% appreciation + 8.0% rent growth), your $33k cash investment doubles in ~7 years — after that, you're playing with house money.
Negotiation context
- It's been on market 20 days — a 2% lower offer ($115k) is reasonable based on typical stale-listing flexibility.
- 11 sale attempts since 12y ago; this cycle's ask has dropped $8k (6%) from the opening price — seller is motivated, your offer sets the floor, not the list.
- Current owner paid $45k; list at $117k implies a 160% gain — meaningful room to come down on a strong offer.
Risks & watch-outs
- Watch-outs: built in 1931 — expect roof / HVAC / electrical / plumbing capex.
Questions for the listing agent
- Built in 1931 — when were the roof, HVAC, electrical panel, plumbing, and water heater last replaced?
- Is there a deadline driving the sale (1031 exchange, divorce, estate, relocation)? That informs how much negotiation room exists.
- Schools are D-rated, which usually means shorter tenancies and higher turnover. Who's the typical renter profile here, and what's been the actual vacancy rate?
- What's the average days-on-market for RENTAL listings here right now (not sales)? A rising rental-DOM trend means longer vacancies and softer asking-rent achievability than the comps imply.
- What's the recent tenant-quality profile in this submarket — average credit score on applications, eviction rate, late-payment / NSF rate, and stable-employment percentage? A property-management company in the area should have these aggregated.
- How much new for-sale + rental construction is in the pipeline within 1–3 miles? Heavy new supply typically softens prices + rents 12–24 months out; constrained supply supports both.
Investment metrics
- 1% rule
- 1.16% ✓
- Cap rate
- 9.41%
- Cash-on-cash
- 11.12%
- DSCR
- 1.49
- GRM
- 7.2
CMA / ARV
- ARV (median comp)
- $141,997
- List price
- $117,000
- Delta
- -17.60%
- Verdict
- UNDERPRICED
- Comps
- 20 within 1.0 mi
Projected returns pro-forma
-3.0% appreciation · 8.0% rent growth · sell at horizon
- IRR
- 5.6%
- Equity multiple
- 1.23×
- Total profit
- $7,531
- Equity at exit
- $17,445
- IRR
- 19.0%
- Equity multiple
- 2.95×
- Total profit
- $64,003
- Equity at exit
- $10,116
Cash invested: $32,760 (down + closing). Projections, not guarantees.
Landlord ↔ Tenant lean methodology
- Overall (STATE)
- 62 Landlord-Friendly
- State Michigan
- 62 Landlord-Friendly · EVEN
- County
- — inherits STATE
- City
- — inherits STATE
ZIP-level market 48126
- Rents YoY
- 13.2%
- Active inventory
- 102
- Price-to-rent
- 7.2×
Monthly cashflow live
- Estimated rent
- $1,354 high interval (Pro) →
- Mortgage (P&I)
- −$614
- Tax from tax record
- −$104 /mo · $1,242/yr
- Insurance
- −$49
- HOA
- −$0
- Vacancy / Maint / Mgmt
- −$284
- Net cashflow
- $304
Break-even live
UW: 25.0% down · 7.5% · 30yr · 1.5% tax · 5.0% vac · 8.0% maint · 8.0% mgmt
Financing live
Cash to close
- Down payment
- $29,250
- Closing costs
- $3,510
- Reserves months
- —
- Total cash needed
- —
Loan-product check · same deal, 3 products live
Conventional
25% down · 7.5% · 30yr
- Down + closing
- —
- Monthly P&I
- —
- Monthly cashflow
- —
- DSCR
- —
- Eligible?
- —
Personal DTI + credit; lowest rate.
DSCR
20% down · 8.5% · 30yr
- Down + closing
- —
- Monthly P&I
- —
- Monthly cashflow
- —
- DSCR
- —
- Eligible?
- —
No personal income docs; deal must DSCR.
Hard money
10% down · 12.0% · 12mo
- Down + closing
- —
- Monthly P&I
- —
- Monthly cashflow
- —
- DSCR
- —
- Eligible?
- —
Short-term bridge; refi at stabilization.
Rent comps 8 comps
| Address | Beds | Baths | Sqft | Rent | $/sqft | DOM | Units | Dist |
|---|---|---|---|---|---|---|---|---|
| 6225 Middlesex St Unit 5 Dearborn, MI | 2.0 | 1.0 | 700 | $950 | $1.36 | 4d | 1 | 0.78mi |
| 6225 Middlesex St Unit 5 Dearborn, MI | 2.0 | 1.0 | 700 | $950 | $1.36 | 12d | 1 | 0.78mi |
| 7100 Freda St Dearborn, MI | 1.0 | 1.0 | 900 | $895 | $0.99 | 43d | 3 | 0.89mi |
| 4326 Maple St Dearborn, MI | 2.0 | 1.5 | 873 | $1,695 | $1.94 | 24d | 1 | 1.01mi |
| 6406 Mead St Dearborn, MI | 2.0 | 1.0 | 904 | $1,100 | $1.22 | 24d | 1 | 1.24mi |
| 4810 Ternes St Dearborn, MI | 2.0 | 1.0 | 720 | $1,350 | $1.88 | 17d | 1 | 1.25mi |
| 4819 Woodworth St Dearborn, MI | 2.0 | 1.0 | 800 | $1,700 | $2.12 | 12d | 1 | 1.35mi |
| 14500 Prospect St Dearborn, MI | 1.0 | 1.0 | 745 | $1,145 | $1.54 | 43d | 1 | 1.35mi |
Listing history 29 events
-
2026-06-02status $117,000 Pending 20 DOM
-
2026-06-01days on market $117,000 Active 20 DOM
Show marketing remark (630 chars)
Prime Investment Opportunity! Solid brick townhouse located in a high-demand East Dearborn pocket. At $125k, this well-maintained property offers incredible upside. Features include 2 spacious bedrooms, a versatile attic loft (perfect for a 3rd functional space), and a private backyard with a durable cement patio. High-efficiency layout with an unfinished basement and laundry area. Ideally situated near major shopping hubs and roadways, ensuring high rental demand and long-term appreciation. Add this East Dearborn gem to your portfolio before it's gone. Home sold in 'as is' condition. Send offers to listing agent by email.
-
2026-05-31days on market $117,000 Active 19 DOM
-
2026-05-12$125,000 Active 597-char remark
Show marketing remark (630 chars)
Prime Investment Opportunity! Solid brick townhouse located in a high-demand East Dearborn pocket. At $125k, this well-maintained property offers incredible upside. Features include 2 spacious bedrooms, a versatile attic loft (perfect for a 3rd functional space), and a private backyard with a durable cement patio. High-efficiency layout with an unfinished basement and laundry area. Ideally situated near major shopping hubs and roadways, ensuring high rental demand and long-term appreciation. Add this East Dearborn gem to your portfolio before it's gone. Home sold in 'as is' condition. Send offers to listing agent by email.
-
2026-05-12$125,000 Active 591-char remark
Show marketing remark (630 chars)
Prime Investment Opportunity! Solid brick townhouse located in a high-demand East Dearborn pocket. At $125k, this well-maintained property offers incredible upside. Features include 2 spacious bedrooms, a versatile attic loft (perfect for a 3rd functional space), and a private backyard with a durable cement patio. High-efficiency layout with an unfinished basement and laundry area. Ideally situated near major shopping hubs and roadways, ensuring high rental demand and long-term appreciation. Add this East Dearborn gem to your portfolio before it's gone. Home sold in 'as is' condition. Send offers to listing agent by email.
-
2026-03-23historical
-
2026-03-23historical
-
2026-03-14$135,000 Active
-
2026-03-14$135,000 Active
-
2026-03-12historical
-
2026-03-01historical
-
2026-03-01historical
-
2025-09-20status Active
-
2025-09-19historical
-
2025-09-09$144,000 Active
-
2025-09-09$144,000 Active
-
2024-05-21historical
-
2024-05-21historical
-
2024-05-17$135,000 Active
-
2024-05-17$135,000 Active
-
2024-05-15historical
-
2024-05-15historical
-
2014-12-11soldstatus $45,000
-
2014-11-17soldstatus $45,000
-
2014-11-17soldstatus $45,000
-
2014-06-11historical
-
2014-04-17$45,000
-
2014-04-17$45,000
-
1992-03-13soldstatus $33,000
ⓘ Source: listings_history table (triggers on properties + properties_extension) + one-shot
backfill from property_details.listing_events for pre-trigger history.
Tax reassessment forecast MI · Partial reset (capped growth)
- Current annual tax
- $1,242 · $104/mo
- Projected year-2 tax
- $1,522 · $127/mo
- Expected delta
- +$280/yr (+$23/mo · 22.5%)
ⓘ Screening estimate from a state-policy table — verify with the county assessor before closing.
Climate risk First Street
- Flood 1/10 Low FEMA zone X (unshaded) · 0% chance over 30 yrs
- Wildfire 1/10 Low
- Heat 3/10 Moderate 7 d/yr ≥96°F today · 15 d/yr by 30 yrs out
- Wind 2/10 Low
- Air quality 3/10 Moderate 2 unhealthy d/yr today · 4 by 30 yrs out
Nearby sold comps map
Loading sold comps map…
Walkable amenities ~0.75 mi
Loading nearby amenities…
Taxation est. · year 1
- Rental income
- $16,246
- − Mortgage interest
- −$6,554
- − Property taxes
- −$1,242
- − Insurance
- −$585
- − Repairs & maintenance
- −$1,300
- − Management
- −$1,300
- − Depreciation
- −$3,404
- Taxable income
- $1,862
- Est. tax owed @ 24.0%
- −$447
- After-tax cash flow
- $3,197/yr
For passive investors: Depreciation is non-cash, so a rental often shows a tax loss while cash-flowing — sheltering income. Rental losses are passive: they offset passive income freely, and up to $25,000/yr can offset ordinary (W-2) income if you actively participate and your MAGI is under $100k (phasing out to $0 by $150k); unused losses carry forward. On sale, claimed depreciation is recaptured at up to 25%, and gains may owe capital-gains tax (a 1031 exchange can defer both). Figures are a year-1 estimate at your 24.0% rate — not tax advice; consult a CPA.
Schools (NCES district)
- District
- Dearborn City School District
- NCES district ID
- 2611600
- Math proficiency
- 26% ▼ -14.00%
- Reading proficiency
- 39% ▼ -8.00%
- Median HH income
- $46,884
- Composite
- 27.93/100
- National rank
- #6864
- State rank
- #325 of 540 in MI
Livability — Dearborn
- Score
- 80/100
- State rank
- #84
- US rank
- #1904
Category grades
Schools grade is shown separately in the Schools card above.
Census & demographics
- Census place
- Dearborn, MI
- County
- Wayne County · 1,562,939 people
- City population
- 86,476
- Metro
- Detroit-Warren-Dearborn, MI
- Population (ZIP)
- 51,997
- Household income
- $42,140
- Rent vs Own
- Severe rent burden
- 2742.0
Population outlook (Wayne County) Hauer SSP2
- Today (2025)
- 1,675,273 people
- By 2030
- 1,620,300 · -3.3%
- By 2040
- 1,502,341 · -10.3%
- By 2050
- 1,384,039 · -17.4%
- By 2075
- 1,124,592 · -32.9%
- By 2100
- 881,193 · -47.4%
Race, ethnicity, and origin ACS 2023
- Neighborhood character
- Predominantly White (90%)
- Race & ethnicity
- White 90% Two or more races 4% Black 3% Asian 2% Hispanic / Latino 1%
- Common ancestry
- Arab 8% Romanian 2% Armenian 1%
- Foreign-born
- 43% · Canada, South Korea
- Languages at home
- 26% English-only · Arabic 70% Other Indo-European 2% Spanish 1%
Political lean MEDSL · Wayne
- 2024 margin
- Strong D (+29.0) · D 62.7% · R 33.7% · Other 3.6%
- 2008→2024 swing
- -20.5pp toward R · 2008: 49.5pp · 2024: 29.0pp
- All cycles
- 2024: D+29.0 2020: D+38.1 2016: D+37.3 2012: D+46.9 2008: D+49.5
Not yet ingested
- Civics
- —
Market trends
- HPI YoY
- ▼ -266.09%
- Current HPI
- 241.0732
- Rent YoY
- ▲ 13.15%
- Metro
- Detroit-Warren-Dearborn, MI
- State GDP YoY
- ▲ 1.37%
- F500 in state
- 28
Industry mix (Fortune 500 HQ in MI)
| Industry | F500 HQs | Revenue |
|---|---|---|
| Automotive Parts | 3 | $48B |
|
||
| Automotive | 2 | $372B |
|
||
| Chemicals | 1 | $45B |
|
||
| Automotive Retail | 1 | $29B |
|
||
| Healthcare / Medical Devices | 1 | $23B |
|
||
| Automotive Technology | 1 | $20B |
|
||
Price history
+254.5% since first listed30 events — show timeline
- 2026-06-01 Pending — MiRealSource-MiMLS
- 2026-06-01 Pending — REALCOMP
- 2026-05-29 Price Changed $117,000 MiRealSource-MiMLS
- 2026-05-28 Price Changed $117,000 REALCOMP
- 2026-05-12 Listed $125,000 REALCOMP
- 2026-05-12 Listed $125,000 MiRealSource-MiMLS
- 2026-03-23 Listing Removed — MiRealSource-MiMLS
- 2026-03-23 Listing Removed — REALCOMP
- 2026-03-14 Listed $135,000 MiRealSource-MiMLS
- 2026-03-14 Listed $135,000 REALCOMP
- 2026-03-12 Coming Soon — MiRealSource-MiMLS
- 2026-03-01 Listing Removed — REALCOMP
- 2026-03-01 Listing Removed — MiRealSource-MiMLS
- 2025-09-20 Relisted — REALCOMP
- 2025-09-19 Listing Removed — REALCOMP
- 2025-09-09 Listed $144,000 MiRealSource-MiMLS
- 2025-09-09 Listed $144,000 REALCOMP
- 2024-05-21 Listing Removed — MiRealSource-MiMLS
- 2024-05-21 Listing Removed — REALCOMP
- 2024-05-17 Listed $135,000 MiRealSource-MiMLS
- 2024-05-17 Listed $135,000 REALCOMP
- 2024-05-15 Coming Soon — MiRealSource-MiMLS
- 2024-05-15 Coming Soon — REALCOMP
- 2014-12-11 Sold (Public Records) $45,000 Public Records
- 2014-11-17 Sold (MLS) $45,000 MiRealSource-MiMLS
- 2014-11-17 Sold (MLS) $45,000 REALCOMP
- 2014-06-11 Listing Removed — MiRealSource-MiMLS
- 2014-04-17 Listed $45,000 MiRealSource-MiMLS
- 2014-04-17 Listed $45,000 REALCOMP
- 1992-03-13 Sold (Public Records) $33,000 Public Records
Property tax history
-1.9%/yrLatest (2025): $1,242 · +2.3% YoY. Source: county tax records.
Cash-flow waterfall
monthlySold comps — $/sqft
last 12 mo · ≤1 miLoading sold comps…