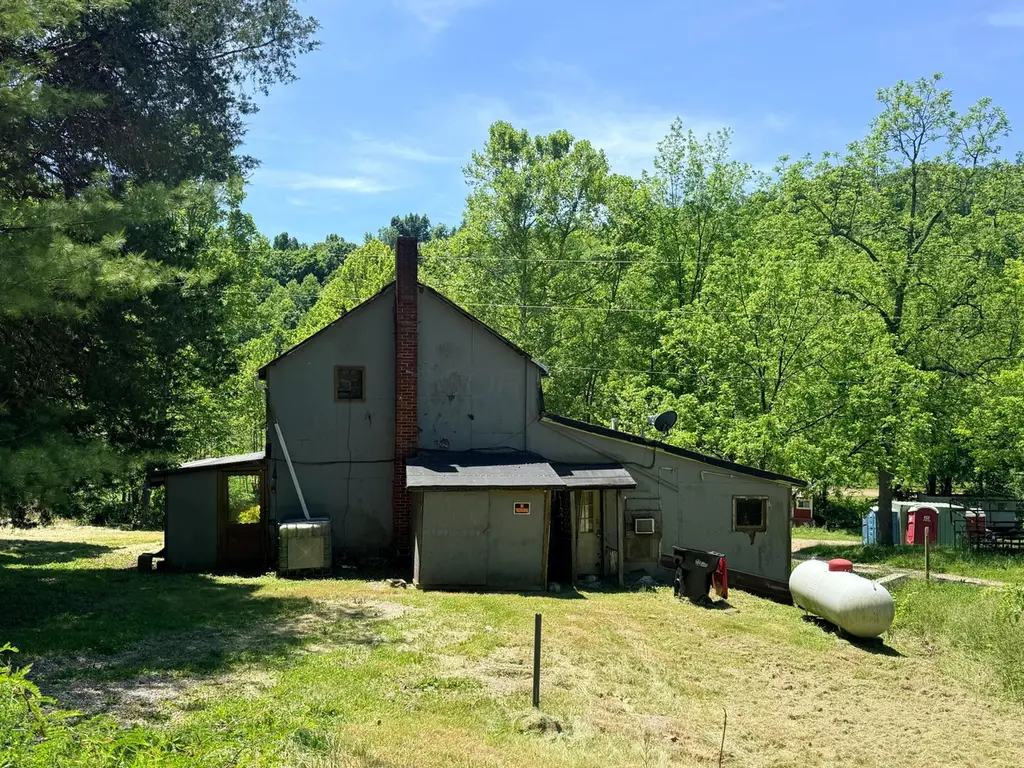
1280 Moody Hollow Rd · Philo, OH
Flood risk 9/10 · Severe
- FEMA flood zone
- X (unshaded)
- Chance of flooding over 30 yrs
- 0.99%
- Est. flood insurance / yr
- $507 – $1,088
Fire risk 3/10 · Minor
- Est. fire insurance / yr
- $713 – $1,323
Heat risk 3/10 · Minor
- Hot days now (above 98°F)
- 7 days/yr
- Hot days in 30 yrs
- 18 days/yr
Wind risk 2/10 · Minimal
- Chance of severe wind over 30 yrs
- 0.0%
Air-quality risk 2/10 · Minimal
- Unhealthy air days now
- 0 days/yr
- Unhealthy air days in 30 yrs
- 1 days/yr
Risk factors via First Street. Map © Google.
Why this score? — see what drove the B+ grade
The composite is a weighted blend of 9 inputs, each scored 0–100. Each bar is that input's sub-score; the figure is the points it added to the 100-point composite (weight × sub-score).
- Cash flow +30.0/30.0
- 1% rule +10.0/10.0
- DSCR +10.0/10.0
- Appreciation +8.7/10.0
- ARV discount +7.5/15.0
- Schools +4.4/10.0
- Livability +3.0/5.0
- Rent growth +2.5/5.0
- Condition / age +2.5/5.0
$39,000
🖨 Deal sheet 📄 Offer letter ✓ Due diligence
Listing remarks MLS
Opportunity awaits with this 3-bedroom, 1-bath home situated on 1.11 acres in the desirable Franklin Local School District. Nestled on a spacious country lot, this property offers plenty of potential for investors, flippers, or buyers looking for their next renovation project. The home is in need of significant repairs and is being sold as-is, making it an excellent opportunity to restore, rebuild, or reimagine. Enjoy the peaceful rural setting while creating value with your vision and hard work. Cash or conventional financing required.
Key facts
- 1.11 acre lot
- Built 1901
- Listed 12 days
Property features AI
Finance
- Financial info: Annual tax amount listed (2025)
Exterior
- Utilities: Private water; Private sewer
- Home design: Single family residence; Two-story
- Construction: Built in 1901
- Exterior features: Stone foundation; Lot of about 1.11 acres
Interior
- Bedrooms: 1 main level bedroom
- Bathrooms: 1 full bathroom
- Interior features: Has a basement; 920 total living area
Neighborhood map
What this means for you Summary
Snapshot
- This is a 3-bed/1.0-bath single-family listed at $39k.
Deal economics
- At list price, monthly cash flow is $445 ($5k/yr) — positive.
- The deal already cash-flows at list — no discount required.
- Meets the 1% rule at list price ($968 rent vs $39k).
Location & tenants
- Location reads 60/100 on livability (#986 in OH) — a middle-class / working-renter tenant base. Strengths: cost of living A+, housing A+; Watch: health & safety C-, crime D, amenities F.
- Franklin Local (rural): math 49% / reading 54% proficiency, ranked #428 of 656 in OH (top 65%) — acceptable for families but not a draw, mixed tenant base, ~2y average lease.
- Market conditions: 12 active listings in the ZIP; 140 units permitted in Muskingum County in 2024 (100 in 5+ unit buildings).
Forward outlook
- In year one you build about $3k of equity ($270 loan paydown + $3k appreciation (7.3% local appreciation)).
- Muskingum County population projected at -10% by 2050 — secular population decline; favor cash flow + early exit over multi-decade hold.
- At projected returns (7.3% appreciation + 3.0% rent growth), your $11k cash investment doubles in ~2 years — after that, you're playing with house money.
- By year 10, paydown + projected appreciation supports a ~$34k cash-out refi (75% LTV) — recoverable capital for the next deal without selling this one.
Negotiation context
- Only 13 days on market — expect competitive offers; lowballing is unlikely to land.
- 2 sale attempts with the ask held roughly flat each time — persistent listings suggest the price (not the market) is what's stuck; bring a comps-based counter.
Risks & watch-outs
- Watch-outs: flood insurance adds $66/mo; built in 1901 — expect roof / HVAC / electrical / plumbing capex.
- Climate carrying-cost: severe flood risk — expect insurance premiums to compound above CPI over the hold.
Questions for the listing agent
- Built in 1901 — when were the roof, HVAC, electrical panel, plumbing, and water heater last replaced?
- What's the actual annual flood-insurance premium (NFIP or private), and is the property in a SFHA with mandatory coverage?
- Is there a deadline driving the sale (1031 exchange, divorce, estate, relocation)? That informs how much negotiation room exists.
- Crime grade is D in this area — have there been break-ins, vandalism, or insurance claims at this property in the last 3 years? What carrier currently insures it and at what premium?
- What's the average days-on-market for RENTAL listings here right now (not sales)? A rising rental-DOM trend means longer vacancies and softer asking-rent achievability than the comps imply.
- What's the recent tenant-quality profile in this submarket — average credit score on applications, eviction rate, late-payment / NSF rate, and stable-employment percentage? A property-management company in the area should have these aggregated.
- How much new for-sale + rental construction is in the pipeline within 1–3 miles? Heavy new supply typically softens prices + rents 12–24 months out; constrained supply supports both.
Investment metrics
- 1% rule
- 2.48% ✓
- Cap rate
- 22.02%
- Cash-on-cash
- 56.18%
- DSCR
- 3.50
- GRM
- 3.4
CMA / ARV
No comps found within radius.
Projected returns pro-forma
7.32% appreciation · 3.0% rent growth · sell at horizon
- IRR
- 59.4%
- Equity multiple
- 4.92×
- Total profit
- $42,768
- Equity at exit
- $27,849
- IRR
- 55.2%
- Equity multiple
- 10.45×
- Total profit
- $103,144
- Equity at exit
- $53,663
Cash invested: $10,920 (down + closing). Projections, not guarantees.
Landlord ↔ Tenant lean methodology
- Overall (STATE)
- 73 Landlord-Friendly
- State Ohio
- 73 Landlord-Friendly · R+6
- County
- — inherits STATE
- City
- — inherits STATE
ZIP-level market 43720
- Home prices YoY
- 3.4%
- Active inventory
- 12
- Price-to-rent
- 3.4×
Monthly cashflow live
- Estimated rent
- $968 medium interval (Pro) →
- Mortgage (P&I)
- −$205
- Tax from tax record
- −$33 /mo · $391/yr
- Insurance
- −$16
- Flood insurance flood zone
- −$66 /mo · $798/yr
- HOA
- −$0
- Vacancy / Maint / Mgmt
- −$203
- Net cashflow
- $445
Break-even live
UW: 25.0% down · 7.5% · 30yr · 1.5% tax · 5.0% vac · 8.0% maint · 8.0% mgmt
Financing live
Cash to close
- Down payment
- $9,750
- Closing costs
- $1,170
- Reserves months
- —
- Total cash needed
- —
Loan-product check · same deal, 3 products live
Conventional
25% down · 7.5% · 30yr
- Down + closing
- —
- Monthly P&I
- —
- Monthly cashflow
- —
- DSCR
- —
- Eligible?
- —
Personal DTI + credit; lowest rate.
DSCR
20% down · 8.5% · 30yr
- Down + closing
- —
- Monthly P&I
- —
- Monthly cashflow
- —
- DSCR
- —
- Eligible?
- —
No personal income docs; deal must DSCR.
Hard money
10% down · 12.0% · 12mo
- Down + closing
- —
- Monthly P&I
- —
- Monthly cashflow
- —
- DSCR
- —
- Eligible?
- —
Short-term bridge; refi at stabilization.
Listing history 11 events
-
2026-06-19days on market $39,000 Active 13 DOM
-
2026-06-18days on market $39,000 Active 12 DOM
-
2026-06-17days on market $39,000 Active 11 DOM
-
2026-06-16days on market $39,000 Active 10 DOM
-
2026-06-15days on market $39,000 Active 9 DOM
-
2026-06-14days on market $39,000 Active 7 DOM
-
2026-06-12days on market $39,000 Active 6 DOM
-
2026-06-09days on market $39,000 Active 3 DOM
-
2026-06-08days on market $39,000 Active 2 DOM
-
2026-06-07remarks 542-char remark
-
2026-06-07$39,000 Active 1 DOM
ⓘ Source: listings_history table (triggers on properties + properties_extension) + one-shot
backfill from property_details.listing_events for pre-trigger history.
Tax reassessment forecast OH · Partial reset (capped growth)
- Current annual tax
- $391 · $33/mo
- Projected year-2 tax
- $500 · $42/mo
- Expected delta
- +$109/yr (+$9/mo · 27.8%)
ⓘ Screening estimate from a state-policy table — verify with the county assessor before closing.
Climate risk First Street
- Flood 9/10 Extreme FEMA zone X (unshaded) · 99% chance over 30 yrs
- Wildfire 3/10 Moderate
- Heat 3/10 Moderate 7 d/yr ≥98°F today · 18 d/yr by 30 yrs out
- Wind 2/10 Low 0% chance of damaging wind over 30 yrs
- Air quality 2/10 Low 0 unhealthy d/yr today · 1 by 30 yrs out
Nearby sold comps map
Loading sold comps map…
Walkable amenities ~0.75 mi
Loading nearby amenities…
Taxation est. · year 1
- Rental income
- $11,615
- − Mortgage interest
- −$2,185
- − Property taxes
- −$391
- − Insurance
- −$992
- − Repairs & maintenance
- −$929
- − Management
- −$929
- − Depreciation
- −$1,135
- Taxable income
- $5,054
- Est. tax owed @ 24.0%
- −$1,213
- After-tax cash flow
- $4,125/yr
For passive investors: Depreciation is non-cash, so a rental often shows a tax loss while cash-flowing — sheltering income. Rental losses are passive: they offset passive income freely, and up to $25,000/yr can offset ordinary (W-2) income if you actively participate and your MAGI is under $100k (phasing out to $0 by $150k); unused losses carry forward. On sale, claimed depreciation is recaptured at up to 25%, and gains may owe capital-gains tax (a 1031 exchange can defer both). Figures are a year-1 estimate at your 24.0% rate — not tax advice; consult a CPA.
Schools (NCES district)
- District
- Franklin Local
- NCES district ID
- 3904884
- Math proficiency
- 49% ▼ -14.00%
- Reading proficiency
- 54% ▼ -10.00%
- Median HH income
- $45,134
- Composite
- 43.55/100
- National rank
- #2982
- State rank
- #428 of 656 in OH
Livability — Philo
- Score
- 60/100
- State rank
- #986
- US rank
- #19323
Category grades
Schools grade is shown separately in the Schools card above.
Census & demographics
- County
- Muskingum · 86,793 people
- Population (ZIP)
- 1,105
- Household income
- $54,141
- Rent vs Own
- Severe rent burden
- 71.2
Population outlook (Muskingum County) Hauer SSP2
- Today (2025)
- 85,625 people
- By 2030
- 84,592 · -1.2%
- By 2040
- 81,288 · -5.1%
- By 2050
- 76,751 · -10.4%
- By 2075
- 64,143 · -25.1%
- By 2100
- 47,598 · -44.4%
Race, ethnicity, and origin ACS 2023
- Neighborhood character
- Predominantly White (98%)
- Race & ethnicity
- White 98% Two or more races 1%
- Common ancestry
- Slovak 3% Italian 2% Lithuanian 1%
- Foreign-born
- 0%
- Languages at home
- 97% English-only · Spanish 3%
Political lean MEDSL · Muskingum
- 2024 margin
- Solid R (+43.9) · D 27.6% · R 71.6%
- 2008→2024 swing
- -36.7pp toward R · 2008: -7.2pp · 2024: -43.9pp
- All cycles
- 2024: R+43.9 2020: R+39.3 2016: R+35.0 2012: R+7.0 2008: R+7.2
Not yet ingested
- Civics
- —
Market trends
- HPI YoY
- ▲ 7.32%
- Current HPI
- 223.4423
- Rent YoY
- —
- Metro
- —
- State GDP YoY
- ▲ 1.98%
- F500 in state
- 48
Industry mix (Fortune 500 HQ in OH)
| Industry | F500 HQs | Revenue |
|---|---|---|
| Insurance | 3 | $145B |
|
||
| Industrial Machinery | 3 | $49B |
|
||
| Financial Services | 3 | $24B |
|
||
| Consumer Goods | 2 | $93B |
|
||
| Aerospace / Defense | 2 | $47B |
|
||
| Utilities | 2 | $33B |
|
||
Price history
+0.0% since first listed2 events — show timeline
- 2026-06-05 Listed $39,000 CBRMLS
- 2026-06-05 Listed $39,000 MLSNOW
Property tax history
+46.2%/yrLatest (2025): $391 · +678.0% YoY. Source: county tax records.
Cash-flow waterfall
monthlySold comps — $/sqft
last 12 mo · ≤1 miLoading sold comps…