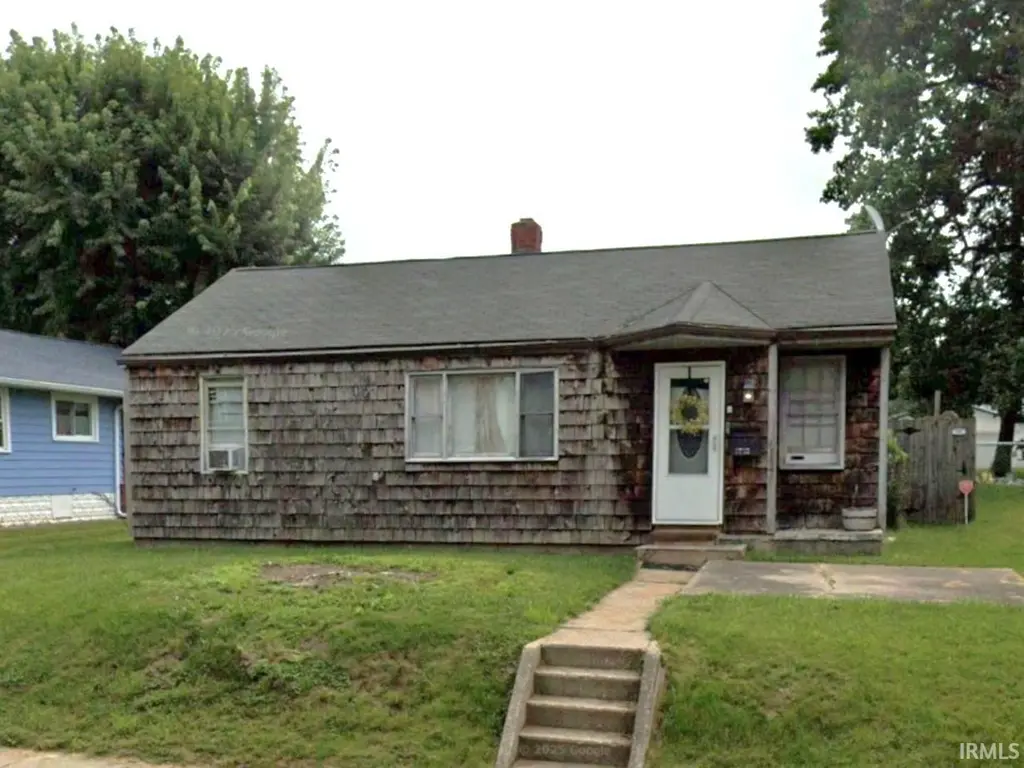
1718 S Courtland Ave · Kokomo, IN
Flood risk 1/10 · Minimal
- FEMA flood zone
- X (unshaded)
- Chance of flooding over 30 yrs
- 0.0%
- Est. flood insurance / yr
- $507 – $1,088
Fire risk 1/10 · Minimal
- Est. fire insurance / yr
- $717 – $1,331
Heat risk 3/10 · Minor
- Hot days now (above 102°F)
- 7 days/yr
- Hot days in 30 yrs
- 17 days/yr
Wind risk 2/10 · Minimal
- Chance of severe wind over 30 yrs
- —
Air-quality risk 3/10 · Minor
- Unhealthy air days now
- 2 days/yr
- Unhealthy air days in 30 yrs
- 3 days/yr
Risk factors via First Street. Map © Google.
Why this score? — see what drove the B grade
The composite is a weighted blend of 9 inputs, each scored 0–100. Each bar is that input's sub-score; the figure is the points it added to the 100-point composite (weight × sub-score).
- Cash flow +29.5/30.0
- ARV discount +13.4/15.0
- DSCR +10.0/10.0
- 1% rule +8.2/10.0
- Livability +3.4/5.0
- Rent growth +3.0/5.0
- Condition / age +2.5/5.0
- Schools +2.1/10.0
- Appreciation +0.0/10.0
$80,000
🖨 Deal sheet 📄 Offer letter ✓ Due diligence
Listing remarks MLS
MIBOR listing- sold by The Hardie Group.
Key facts
- 6,970 sq ft lot
- 2 garage spots
- Built 1947
Neighborhood map
What this means for you Summary
Snapshot
- This is a 2-bed/1.0-bath single-family listed at $80k.
Deal economics
- At list price, monthly cash flow is $286 ($3k/yr) — positive.
- The deal already cash-flows at list — no discount required.
- Meets the 1% rule at list price ($1k rent vs $80k).
- Cap rate 10.6% vs local median 5.2% in Kokomo — top-decile yield for the area; either an underpriced asset or a hidden risk that comps aren't pricing in. Stress-test before assuming the spread holds.
Location & tenants
- Location reads 68/100 on livability (#227 in IN) — a middle-class / working-renter tenant base. Strengths: cost of living A+, housing A+, health & safety A; Watch: crime D, amenities F, commute F.
- Kokomo School Corporation (urban): math 22% / reading 30% proficiency, ranked #264 of 301 in IN (top 88%) — low school quality limits family demand, transient renter base, plan for 1-2y turnover; 62% free/reduced lunch — lower-income household profile, screen leases tightly.
- Zoned schools: Elwood Haynes Elementary School (math 22% / reading 17%, grade F, #814 of 994 statewide, top 83%, 611 students, 88% FRL); Maple Crest Middle School (math 10% / reading 16%, grade F, #304 of 330 statewide, top 94%, 372 students, 77% FRL); Kokomo High School (math 19% / reading 48%, grade F, #289 of 369 statewide, top 78%, 1,519 students, 58% FRL).
- Market conditions: Rents rising (+1.8%/yr); 232 active listings in the ZIP; 2 comparable units currently listed for rent nearby; 194 units permitted in Howard County in 2024 (0 in 5+ unit buildings).
Forward outlook
- Local home prices are declining (-3.0%/yr); year-one equity from $553 of loan paydown is wiped out by about $2k of value loss. Plan a longer hold.
- Howard County population projected at -11% by 2050 — secular population decline; favor cash flow + early exit over multi-decade hold.
- At projected returns (-3.0% appreciation + 1.8% rent growth), your $22k cash investment doubles in ~9 years — after that, you're playing with house money.
Negotiation context
- Only 0 days on market — expect competitive offers; lowballing is unlikely to land.
- 3 sale attempts since 4y ago with the ask held roughly flat each time — persistent listings suggest the price (not the market) is what's stuck; bring a comps-based counter.
- Current owner paid $58k; 38% above their basis — modest negotiation headroom, anchor on the comps not their cost.
Risks & watch-outs
- Watch-outs: built in 1947 — expect roof / HVAC / electrical / plumbing capex.
Questions for the listing agent
- Built in 1947 — when were the roof, HVAC, electrical panel, plumbing, and water heater last replaced?
- Is there a deadline driving the sale (1031 exchange, divorce, estate, relocation)? That informs how much negotiation room exists.
- Schools are F-rated, which usually means shorter tenancies and higher turnover. Who's the typical renter profile here, and what's been the actual vacancy rate?
- Crime grade is D in this area — have there been break-ins, vandalism, or insurance claims at this property in the last 3 years? What carrier currently insures it and at what premium?
- What's the average days-on-market for RENTAL listings here right now (not sales)? A rising rental-DOM trend means longer vacancies and softer asking-rent achievability than the comps imply.
- What's the recent tenant-quality profile in this submarket — average credit score on applications, eviction rate, late-payment / NSF rate, and stable-employment percentage? A property-management company in the area should have these aggregated.
- How much new for-sale + rental construction is in the pipeline within 1–3 miles? Heavy new supply typically softens prices + rents 12–24 months out; constrained supply supports both.
Investment metrics
- 1% rule
- 1.32% ✓
- Cap rate
- 10.58%
- Cash-on-cash
- 15.30%
- DSCR
- 1.68
- GRM
- 6.3
CMA / ARV
- ARV (on-the-fly)
- $92,004
- Comps found
- 12
Show comp detail 12 sales within ~0.75 mi
| Address | Dist | Beds/Ba | Sqft | Sold | Price | $/sf | Match |
|---|---|---|---|---|---|---|---|
| 419 W Defenbaugh St | 0.18mi | 2/1.0 | 792 (+6%) | 1mo | $130,000 | $164 | 81 |
| 1443 S Webster St | 0.20mi | 2/1.0 | 728 (-3%) | 15mo | $77,000 | $106 | 74 |
| 625 W Virginia Ave | 0.41mi | 1/1.0 (-1) | 736 (-2%) | 8mo | $65,000 | $88 | 67 |
| 1414 S Buckeye St | 0.36mi | 2/1.0 | 784 (+5%) | 13mo | $52,000 | $66 | 64 |
| 1821 S Buckeye St | 0.29mi | 2/1.0 | 840 (+12%) | 4mo | $103,500 | $123 | 63 |
| 1324 S Armstrong St | 0.32mi | 2/1.0 | 800 (+7%) | 14mo | $115,000 | $144 | 62 |
| 319 E Poplar St | 0.58mi | 2/1.0 | 816 (+9%) | 2mo | $99,900 | $122 | 56 |
| 1027 S Mccann St | 0.62mi | 2/1.0 | 816 (+9%) | 1mo | $110,000 | $135 | 55 |
| 1421 S Armstrong St | 0.24mi | 2/1.0 | 848 (+13%) | 16mo | $125,000 | $147 | 54 |
| 1216 S Buckeye St | 0.49mi | 1/1.0 (-1) | 684 (-9%) | 7mo | $15,000 | $22 | 52 |
| 925 W Virginia Ave | 0.49mi | 2/1.0 | 816 (+9%) | 13mo | $132,500 | $162 | 52 |
| 416 W Foster St | 0.55mi | 2/1.0 | 818 (+9%) | 13mo | $100,000 | $122 | 48 |
Match score weights: distance 35% · size 25% · config 20% · recency 20%. Top-matched comps best support the ARV.
Projected returns pro-forma
-3.0% appreciation · 1.8% rent growth · sell at horizon
- IRR
- 4.7%
- Equity multiple
- 1.18×
- Total profit
- $3,980
- Equity at exit
- $11,928
- IRR
- 13.0%
- Equity multiple
- 1.98×
- Total profit
- $21,893
- Equity at exit
- $6,917
Cash invested: $22,400 (down + closing). Projections, not guarantees.
Landlord ↔ Tenant lean methodology
- Overall (STATE)
- 90 Strongly Landlord-Friendly
- State Indiana
- 90 Strongly Landlord-Friendly · R+11
- County
- — inherits STATE
- City
- — inherits STATE
ZIP-level market 46902
- Home prices YoY
- -20.7%
- Rents YoY
- 1.8%
- Active inventory
- 232
- Price-to-rent
- 6.3×
Monthly cashflow live
- Estimated rent
- $1,057 medium interval (Pro) →
- Mortgage (P&I)
- −$420
- Tax from tax record
- −$96 /mo · $1,158/yr
- Insurance
- −$33
- HOA
- −$0
- Vacancy / Maint / Mgmt
- −$222
- Net cashflow
- $286
Break-even live
UW: 25.0% down · 7.5% · 30yr · 1.5% tax · 5.0% vac · 8.0% maint · 8.0% mgmt
Financing live
Cash to close
- Down payment
- $20,000
- Closing costs
- $2,400
- Reserves months
- —
- Total cash needed
- —
Loan-product check · same deal, 3 products live
Conventional
25% down · 7.5% · 30yr
- Down + closing
- —
- Monthly P&I
- —
- Monthly cashflow
- —
- DSCR
- —
- Eligible?
- —
Personal DTI + credit; lowest rate.
DSCR
20% down · 8.5% · 30yr
- Down + closing
- —
- Monthly P&I
- —
- Monthly cashflow
- —
- DSCR
- —
- Eligible?
- —
No personal income docs; deal must DSCR.
Hard money
10% down · 12.0% · 12mo
- Down + closing
- —
- Monthly P&I
- —
- Monthly cashflow
- —
- DSCR
- —
- Eligible?
- —
Short-term bridge; refi at stabilization.
Rent comps 2 comps
| Address | Beds | Baths | Sqft | Rent | $/sqft | DOM | Units | Dist |
|---|---|---|---|---|---|---|---|---|
| 1901 S Park Rd Kokomo, IN | 2.0 | 1.0 | 750 | $1,025 | $1.37 | 7d | 3 | 0.60mi |
| 430 W Rainbow Cir Kokomo, IN | 3.0 | 1.0–2.5 | 966 | $1,157 | $1.20 | 1d | 6 | 1.34mi |
Listing history 9 events
-
2026-04-17$80,000
-
2026-04-17historical
-
2023-11-08soldstatus $57,900 40-char remark
Show marketing remark (40 chars)
MIBOR listing- sold by The Hardie Group.
-
2023-11-08$57,900 40-char remark
Show marketing remark (40 chars)
MIBOR listing- sold by The Hardie Group.
-
2023-01-11soldstatus $57,900 Closed 309-char remark
Show marketing remark (309 chars)
Neat mid century ranch with cedar shake exterior. Vaulted ceilings in the living room, large laundry room and updated bath with tile and tub-shower. Has a fenced in backyard and 24'x22' garage which is vinyl exterior and heated. Close to IU extension and shopping and park. Lot 50' by 139' with alley at rear.
-
2022-12-21status Pending 309-char remark
Show marketing remark (309 chars)
Neat mid century ranch with cedar shake exterior. Vaulted ceilings in the living room, large laundry room and updated bath with tile and tub-shower. Has a fenced in backyard and 24'x22' garage which is vinyl exterior and heated. Close to IU extension and shopping and park. Lot 50' by 139' with alley at rear.
-
2022-12-19price $57,900 309-char remark
Show marketing remark (309 chars)
Neat mid century ranch with cedar shake exterior. Vaulted ceilings in the living room, large laundry room and updated bath with tile and tub-shower. Has a fenced in backyard and 24'x22' garage which is vinyl exterior and heated. Close to IU extension and shopping and park. Lot 50' by 139' with alley at rear.
-
2022-11-11$58,000 Active 309-char remark
Show marketing remark (309 chars)
Neat mid century ranch with cedar shake exterior. Vaulted ceilings in the living room, large laundry room and updated bath with tile and tub-shower. Has a fenced in backyard and 24'x22' garage which is vinyl exterior and heated. Close to IU extension and shopping and park. Lot 50' by 139' with alley at rear.
-
2001-07-16soldstatus $68,000
ⓘ Source: listings_history table (triggers on properties + properties_extension) + one-shot
backfill from property_details.listing_events for pre-trigger history.
Tax reassessment forecast IN · Partial reset (capped growth)
- Current annual tax
- $1,158 · $96/mo
- Projected year-2 tax
- $1,158 · $96/mo
- Expected delta
- $0/yr ($0/mo · 0.0%)
ⓘ Screening estimate from a state-policy table — verify with the county assessor before closing.
Climate risk First Street
- Flood 1/10 Low FEMA zone X (unshaded) · 0% chance over 30 yrs
- Wildfire 1/10 Low
- Heat 3/10 Moderate 7 d/yr ≥102°F today · 17 d/yr by 30 yrs out
- Wind 2/10 Low
- Air quality 3/10 Moderate 2 unhealthy d/yr today · 3 by 30 yrs out
Nearby sold comps map
Loading sold comps map…
Walkable amenities ~0.75 mi
Loading nearby amenities…
Taxation est. · year 1
- Rental income
- $12,683
- − Mortgage interest
- −$4,481
- − Property taxes
- −$1,158
- − Insurance
- −$400
- − Repairs & maintenance
- −$1,015
- − Management
- −$1,015
- − Depreciation
- −$2,327
- Taxable income
- $2,287
- Est. tax owed @ 24.0%
- −$549
- After-tax cash flow
- $2,878/yr
For passive investors: Depreciation is non-cash, so a rental often shows a tax loss while cash-flowing — sheltering income. Rental losses are passive: they offset passive income freely, and up to $25,000/yr can offset ordinary (W-2) income if you actively participate and your MAGI is under $100k (phasing out to $0 by $150k); unused losses carry forward. On sale, claimed depreciation is recaptured at up to 25%, and gains may owe capital-gains tax (a 1031 exchange can defer both). Figures are a year-1 estimate at your 24.0% rate — not tax advice; consult a CPA.
Schools (NCES district)
- District
- Kokomo School Corporation
- NCES district ID
- 1805370
- Math proficiency
- 22% ▼ -8.00%
- Reading proficiency
- 30% ▼ -5.00%
- Median HH income
- $35,804
- Composite
- 21.5/100
- National rank
- #8325
- State rank
- #264 of 301 in IN
Livability — Kokomo
- Score
- 68/100
- State rank
- #227
- US rank
- #9912
Category grades
Schools grade is shown separately in the Schools card above.
Census & demographics
- Census place
- Kokomo, IN
- County
- Howard County · 75,099 people
- City population
- 75,099
- Metro
- Kokomo, IN
- Population (ZIP)
- 37,017
- Household income
- $62,126
- Rent vs Own
- Severe rent burden
- 1262.0
Population outlook (Howard County) Hauer SSP2
- Today (2025)
- 81,522 people
- By 2030
- 80,104 · -1.7%
- By 2040
- 76,708 · -5.9%
- By 2050
- 72,880 · -10.6%
- By 2075
- 64,016 · -21.5%
- By 2100
- 51,705 · -36.6%
Race, ethnicity, and origin ACS 2023
- Neighborhood character
- Predominantly White (81%)
- Race & ethnicity
- White 81% Black 9% Two or more races 5% Hispanic / Latino 4% Asian 3%
- Common ancestry
- Italian 2% Lithuanian 1% Slovak 1%
- Foreign-born
- 3% · Canada, Vietnam, China
- Languages at home
- 96% English-only · Vietnamese 1% Other Asian/Pacific 1% Spanish 1%
Political lean MEDSL · Howard
- 2024 margin
- Solid R (+35.3) · D 31.4% · R 66.7% · Other 1.8%
- 2008→2024 swing
- -29.1pp toward R · 2008: -6.2pp · 2024: -35.3pp
- All cycles
- 2024: R+35.3 2020: R+32.4 2016: R+33.9 2012: R+14.3 2008: R+6.2
Not yet ingested
- Civics
- —
Market trends
- HPI YoY
- ▼ -61.76%
- Current HPI
- 236.8237
- Rent YoY
- ▲ 1.80%
- Metro
- Kokomo, IN
- State GDP YoY
- ▲ 2.90%
- F500 in state
- 18
Industry mix (Fortune 500 HQ in IN)
| Industry | F500 HQs | Revenue |
|---|---|---|
| Industrial Machinery | 2 | $37B |
|
||
| Healthcare | 1 | $177B |
|
||
| Pharmaceuticals | 1 | $45B |
|
||
| Metals / Steel | 1 | $18B |
|
||
| Agriculture | 1 | $17B |
|
||
| Packaging | 1 | $12B |
|
||
Price history
+17.6% since first listed9 events — show timeline
- 2026-04-17 Delisted — IRMLS
- 2026-04-17 Listed $80,000 IRMLS
- 2023-11-08 Listed $57,900 IRMLS
- 2023-11-08 Sold (MLS) $57,900 IRMLS
- 2023-01-11 Sold (MLS) $57,900 MIBOR as Distributed by MLS Grid
- 2022-12-21 Pending — MIBOR as Distributed by MLS Grid
- 2022-12-19 Price Changed $57,900 MIBOR as Distributed by MLS Grid
- 2022-11-11 Listed $58,000 MIBOR as Distributed by MLS Grid
- 2001-07-16 Sold (Public Records) $68,000 Public Records
Property tax history
+14.6%/yrLatest (2024): $1,158 · +13.5% YoY. Source: county tax records.
Cash-flow waterfall
monthlySold comps — $/sqft
last 12 mo · ≤1 miLoading sold comps…