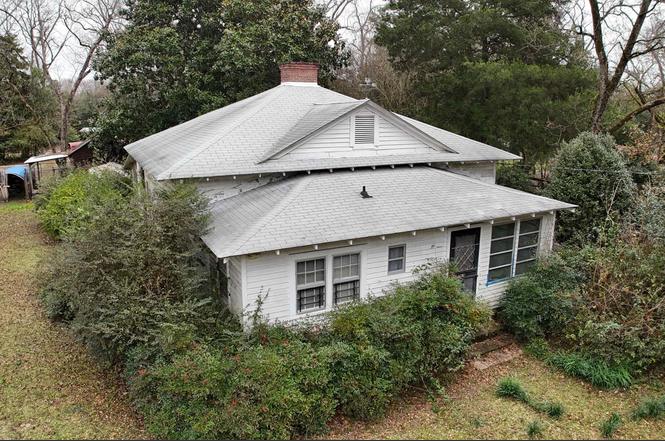
1917 Old Hopkins Rd · Hopkins, SC
Flood risk 1/10 · Minimal
- FEMA flood zone
- X
- Chance of flooding over 30 yrs
- 0.0%
- Est. flood insurance / yr
- $435 – $905
Fire risk 3/10 · Minor
- Est. fire insurance / yr
- $783 – $1,453
Heat risk 6/10 · Moderate
- Hot days now (above threshold)
- 7 days/yr
- Hot days in 30 yrs
- 16 days/yr
Wind risk No data
- Chance of severe wind over 30 yrs
- —
Air-quality risk No data
- Unhealthy air days now
- —
- Unhealthy air days in 30 yrs
- —
Risk factors via First Street. Map © Google.
Why this score? — see what drove the C grade
The composite is a weighted blend of 9 inputs, each scored 0–100. Each bar is that input's sub-score; the figure is the points it added to the 100-point composite (weight × sub-score).
- Cash flow +20.9/30.0
- ARV discount +15.0/15.0
- DSCR +6.7/10.0
- 1% rule +5.2/10.0
- Livability +3.0/5.0
- Schools +2.6/10.0
- Rent growth +2.5/5.0
- Condition / age +2.5/5.0
- Appreciation +0.0/10.0
$225,000
🖨 Deal sheet 📄 Offer letter ✓ Due diligence
Listing remarks
Vintage c. 1920 homestead with lots of ancient pecan trees, massive magnolia tree for year round shade, phenomenal camellias, azaleas and crape myrtles on 5.99 acres! Got, or want horses, but can't find anything affordable?? THIS IS YOUR PLACE! The home has had some updating by the current owners, but still needs a good bit of work. LOADS of potential here for someone who wants an older home on a serene setting! At this price, the home and property are being sold strictly AS IS. The property includes a substantial amount of fencing for riding rings, pasture, etc. There are multiple stables, barns, sheds, workshops and even a chicken coop! Most of the outbuildings have power! Lots of pos
Key facts
- Ancient pecan trees
- Phenomenal camellias
- Multiple stables
Tags
Property features AI
Finance
- Other: Property allows horses
- Financial info:
- HOA & community:
Exterior
- Parking:
- Security:
- Utilities: Well water; Septic system
- Home design: Single-story home
- Construction: Wood exterior; Crawlspace foundation
- Exterior features: Barn; Shed; Stable; Workshop; Horse and livestock fencing; Paved road access
Interior
- Kitchen: Formica countertops; Stained wood cabinets; Vinyl flooring
- Bedrooms: Primary bedroom on the main level with fireplace and private bath; Additional bedrooms located on the main level
- Flooring: Luxury vinyl plank in living and formal dining areas; Vinyl flooring in the kitchen
- Bathrooms: Two full bathrooms
- Heating & cooling: Multiple heating units; Multiple cooling units
- Interior features: Attic access; Two fireplaces; Free-standing range
- Laundry & utility: Laundry located on the porch (main level)
Neighborhood map
What this means for you Summary
Snapshot
- This is a 4-bed/2.0-bath single-family listed at $225k.
Deal economics
- At list price, monthly cash flow is $314 ($4k/yr) — positive.
- The deal already cash-flows at list — no discount required.
- Meets the 1% rule at list price ($2k rent vs $225k).
- Recommended offer: $198k (12.0% below list) — sets the bar for market timing.
Location & tenants
- Location reads 59/100 on livability (#238 in SC) — a working-class tenant base; expect higher turnover. Strengths: cost of living A+, crime B+, housing B; Watch: employment D+, amenities F, commute F.
- Richland 01 (urban): math 26% / reading 36% proficiency, ranked #54 of 80 in SC (top 68%) — families likely to look elsewhere, expect single-tenant / working-renter base with shorter leases; 64% free/reduced lunch — lower-income household profile, screen leases tightly.
- Zoned schools: Hopkins Elementary (math 27% / reading 22%, grade F, #452 of 597 statewide, top 78%, 250 students, 100% FRL); Lower Richland High (math 5% / reading 64%, grade F, #185 of 196 statewide, top 94%, 1,244 students, 100% FRL) — zoned schools average 100% FRL vs 64% district-wide (36 pts higher); higher-poverty schools than district average — tighter screening recommended.
- Market conditions: 328 active listings in the ZIP; 3,472 units permitted in Richland County in 2024 (1,096 in 5+ unit buildings).
- At $2,296/mo this rent would consume 46% of the median local household income ($60k/yr) (locally 236% of renters already pay >50% of income on rent) — very limited rent-growth headroom before tenants either downsize or default.
Forward outlook
- Local home prices are declining (-3.0%/yr); year-one equity from $2k of loan paydown is wiped out by about $7k of value loss. Plan a longer hold.
- Richland County population projected at +30% by 2050 — long-run rental-demand tailwind backs the buy-and-hold thesis.
Negotiation context
- It's been on market 195 days — a 12% lower offer ($198k) is reasonable based on typical stale-listing flexibility.
- 2 sale attempts since 5y ago; this cycle's ask has dropped $25k (10%) from the opening price — seller is motivated, your offer sets the floor, not the list.
Risks & watch-outs
- Watch-outs: built in 1920 — expect roof / HVAC / electrical / plumbing capex.
- Climate carrying-cost: extreme-heat days projected 7→16/yr by 2055 (HVAC capex compounding) — expect insurance premiums to compound above CPI over the hold.
Questions for the listing agent
- It's been on market 195 days. Have you received any prior offers? Is the seller open to a 12% concession, seller financing, or rate buy-down credit?
- Built in 1920 — when were the roof, HVAC, electrical panel, plumbing, and water heater last replaced?
- Why hasn't it sold? Are there any deal-killer items the seller is aware of (foundation, flood, title, zoning, code violations)?
- Is there a deadline driving the sale (1031 exchange, divorce, estate, relocation)? That informs how much negotiation room exists.
- Schools are F-rated, which usually means shorter tenancies and higher turnover. Who's the typical renter profile here, and what's been the actual vacancy rate?
- What's the average days-on-market for RENTAL listings here right now (not sales)? A rising rental-DOM trend means longer vacancies and softer asking-rent achievability than the comps imply.
- What's the recent tenant-quality profile in this submarket — average credit score on applications, eviction rate, late-payment / NSF rate, and stable-employment percentage? A property-management company in the area should have these aggregated.
- How much new for-sale + rental construction is in the pipeline within 1–3 miles? Heavy new supply typically softens prices + rents 12–24 months out; constrained supply supports both.
Investment metrics
- 1% rule
- 1.02% ✓
- Cap rate
- 7.97%
- Cash-on-cash
- 5.99%
- DSCR
- 1.27
- GRM
- 8.2
CMA / ARV
- ARV (on-the-fly)
- $308,136
- Comps found
- 3
Show comp detail 3 sales within ~0.75 mi
| Address | Dist | Beds/Ba | Sqft | Sold | Price | $/sf | Match |
|---|---|---|---|---|---|---|---|
| 307 Harvester | 0.32mi | 5/3.0 (+1) | 2,264 (+9%) | 9mo | $311,500 | $138 | 54 |
| 8249 2151 Sydney K Vibrant Loop | 0.69mi | 4/2.5 | 2,018 (-3%) | 10mo | $370,000 | $183 | 52 |
| 1004 SW Maple View Rd | 0.69mi | 4/2.0 | 1,773 (-15%) | 15mo | $262,990 | $148 | 31 |
Match score weights: distance 35% · size 25% · config 20% · recency 20%. Top-matched comps best support the ARV.
Projected returns pro-forma
-3.0% appreciation · 3.0% rent growth · sell at horizon
- IRR
- -7.1%
- Equity multiple
- 0.74×
- Total profit
- $-16,441
- Equity at exit
- $33,548
- IRR
- 2.5%
- Equity multiple
- 1.18×
- Total profit
- $11,462
- Equity at exit
- $19,454
Cash invested: $63,000 (down + closing). Projections, not guarantees.
Landlord ↔ Tenant lean methodology
- Overall (STATE)
- 90 Strongly Landlord-Friendly
- State South Carolina
- 90 Strongly Landlord-Friendly · R+6
- County
- — inherits STATE
- City
- — inherits STATE
ZIP-level market 29061
- Home prices YoY
- -22.8%
- Active inventory
- 328
- Price-to-rent
- 8.2×
Monthly cashflow live
- Estimated rent
- $2,296 medium interval (Pro) →
- Mortgage (P&I)
- −$1,180
- Tax from tax record
- −$226 /mo · $2,711/yr
- Insurance
- −$94
- HOA
- −$0
- Vacancy / Maint / Mgmt
- −$482
- Net cashflow
- $314
Break-even live
UW: 25.0% down · 7.5% · 30yr · 1.5% tax · 5.0% vac · 8.0% maint · 8.0% mgmt
Financing live
Cash to close
- Down payment
- $56,250
- Closing costs
- $6,750
- Reserves months
- —
- Total cash needed
- —
Loan-product check · same deal, 3 products live
Conventional
25% down · 7.5% · 30yr
- Down + closing
- —
- Monthly P&I
- —
- Monthly cashflow
- —
- DSCR
- —
- Eligible?
- —
Personal DTI + credit; lowest rate.
DSCR
20% down · 8.5% · 30yr
- Down + closing
- —
- Monthly P&I
- —
- Monthly cashflow
- —
- DSCR
- —
- Eligible?
- —
No personal income docs; deal must DSCR.
Hard money
10% down · 12.0% · 12mo
- Down + closing
- —
- Monthly P&I
- —
- Monthly cashflow
- —
- DSCR
- —
- Eligible?
- —
Short-term bridge; refi at stabilization.
Listing history 17 events
-
2026-06-17statusdays on market $225,000 Pending 195 DOM
-
2026-06-16days on market $225,000 Active - Contingent 194 DOM
-
2026-06-15days on market $225,000 Active - Contingent 193 DOM
-
2026-06-14days on market $225,000 Active - Contingent 191 DOM
-
2026-06-10days on market $225,000 Active - Contingent 188 DOM
-
2026-06-09days on market $225,000 Active - Contingent 187 DOM
-
2026-06-08days on market $225,000 Active - Contingent 186 DOM
-
2026-06-07days on market $225,000 Active - Contingent 185 DOM
-
2026-06-03statusdays on market $225,000 Active - Contingent 181 DOM
-
2026-06-03days on market $225,000 Active 180 DOM
-
2026-06-01days on market $225,000 Active 179 DOM
-
2026-05-31days on market $225,000 Active 178 DOM
-
2026-03-17price $225,000
-
2025-12-04$250,000 Active
-
2021-10-14soldstatus $200,000
-
2021-08-31historical
-
2021-06-25$205,000 Active
ⓘ Source: listings_history table (triggers on properties + properties_extension) + one-shot
backfill from property_details.listing_events for pre-trigger history.
Tax reassessment forecast SC · Resets to sale price
- Current annual tax
- $2,711 · $226/mo
- Projected year-2 tax
- $2,711 · $226/mo
- Expected delta
- $0/yr ($0/mo · 0.0%)
ⓘ Screening estimate from a state-policy table — verify with the county assessor before closing.
Climate risk First Street
- Flood 1/10 Low FEMA zone X · 0% chance over 30 yrs
- Wildfire 3/10 Moderate
- Heat 6/10 Major
Nearby sold comps map
Loading sold comps map…
Walkable amenities ~0.75 mi
Loading nearby amenities…
Taxation est. · year 1
- Rental income
- $27,553
- − Mortgage interest
- −$12,603
- − Property taxes
- −$2,711
- − Insurance
- −$1,125
- − Repairs & maintenance
- −$2,204
- − Management
- −$2,204
- − Depreciation
- −$6,545
- Taxable income
- $159
- Est. tax owed @ 24.0%
- −$38
- After-tax cash flow
- $3,733/yr
For passive investors: Depreciation is non-cash, so a rental often shows a tax loss while cash-flowing — sheltering income. Rental losses are passive: they offset passive income freely, and up to $25,000/yr can offset ordinary (W-2) income if you actively participate and your MAGI is under $100k (phasing out to $0 by $150k); unused losses carry forward. On sale, claimed depreciation is recaptured at up to 25%, and gains may owe capital-gains tax (a 1031 exchange can defer both). Figures are a year-1 estimate at your 24.0% rate — not tax advice; consult a CPA.
Schools (NCES district)
- District
- Richland 01
- NCES district ID
- 4503360
- Math proficiency
- 26% ▼ -7.00%
- Reading proficiency
- 36% ▼ -5.00%
- Median HH income
- $38,931
- Composite
- 25.94/100
- National rank
- #7335
- State rank
- #54 of 80 in SC
Livability — Hopkins
- Score
- 59/100
- State rank
- #238
- US rank
- #19825
Category grades
Schools grade is shown separately in the Schools card above.
Census & demographics
- Census place
- Hopkins, SC
- County
- Richland County · 389,530 people
- City population
- 12,538
- Metro
- Columbia, SC
- Population (ZIP)
- 12,538
- Household income
- $60,307
- Rent vs Own
- Severe rent burden
- 236.0
Population outlook (Richland County) Hauer SSP2
- Today (2025)
- 459,667 people
- By 2030
- 487,524 · +6.1%
- By 2040
- 542,035 · +17.9%
- By 2050
- 595,371 · +29.5%
- By 2075
- 732,998 · +59.5%
- By 2100
- 820,415 · +78.5%
Race, ethnicity, and origin ACS 2023
- Neighborhood character
- Predominantly Black (68%)
- Race & ethnicity
- Black 68% White 23% Two or more races 6% Hispanic / Latino 4%
- Common ancestry
- Italian 1% Lithuanian 1% Romanian 1%
- Foreign-born
- 3% · Canada
- Languages at home
- 96% English-only · Spanish 3%
Political lean MEDSL · Richland
- 2024 margin
- Solid D (+34.6) · D 66.4% · R 31.8% · Other 1.8%
- 2008→2024 swing
- +5.7pp toward D · 2008: 28.9pp · 2024: 34.6pp
- All cycles
- 2024: D+34.6 2020: D+38.3 2016: D+32.9 2012: D+33.3 2008: D+28.9
Not yet ingested
- Civics
- —
Market trends
- HPI YoY
- ▼ -57.44%
- Current HPI
- 194.8986
- Rent YoY
- —
- Metro
- Columbia, SC
- State GDP YoY
- ▲ 4.51%
- F500 in state
- 2
Industry mix (Fortune 500 HQ in SC)
| Industry | F500 HQs | Revenue |
|---|---|---|
| Packaging | 1 | $7B |
|
||
Price history
+9.8% since first listed5 events — show timeline
- 2026-03-17 Price Changed $225,000 Consolidated MLS
- 2025-12-04 Listed $250,000 Consolidated MLS
- 2021-10-14 Sold (Public Records) $200,000 Public Records
- 2021-08-31 Delisted — Consolidated MLS
- 2021-06-25 Listed $205,000 Consolidated MLS
Property tax history
+2.0%/yrLatest (2025): $2,711 · +3.4% YoY. Source: county tax records.
Cash-flow waterfall
monthlySold comps — $/sqft
last 12 mo · ≤1 miLoading sold comps…