 Duplex
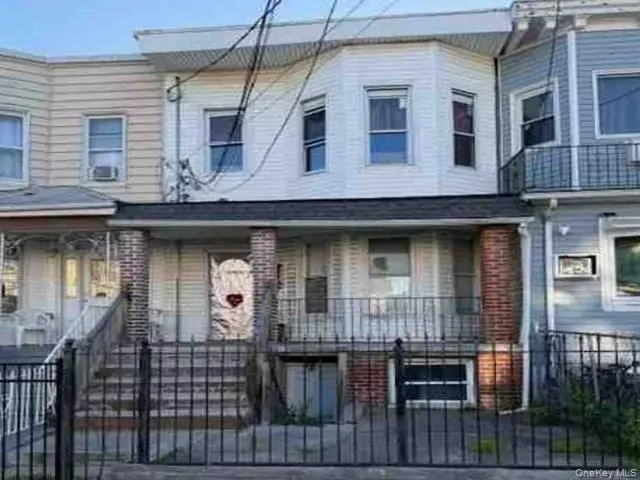
10321 113th St · New York, NY
Flood risk 3/10 · Minor
- FEMA flood zone
- X (unshaded)
- Chance of flooding over 30 yrs
- 0.1%
- Est. flood insurance / yr
- $507 – $1,088
Fire risk 1/10 · Minimal
- Est. fire insurance / yr
- $691 – $1,283
Heat risk 7/10 · Major
- Hot days now (above 98°F)
- 7 days/yr
- Hot days in 30 yrs
- 15 days/yr
Wind risk 6/10 · Moderate
- Chance of severe wind over 30 yrs
- 50.0%
Air-quality risk 4/10 · Minor
- Unhealthy air days now
- 6 days/yr
- Unhealthy air days in 30 yrs
- 6 days/yr
Risk factors via First Street. Map © Google.
Why this score? — see what drove the B- grade
The composite is a weighted blend of 9 inputs, each scored 0–100. Each bar is that input's sub-score; the figure is the points it added to the 100-point composite (weight × sub-score).
- Cash flow +28.2/30.0
- DSCR +10.0/10.0
- ARV discount +7.5/15.0
- 1% rule +7.0/10.0
- Schools +5.0/10.0
- Livability +3.8/5.0
- Rent growth +2.5/5.0
- Condition / age +2.5/5.0
- Appreciation +0.0/10.0
$662,500
🖨 Deal sheet 📄 Offer letter ✓ Due diligence
Multi-family units
County records classify this as Multi-Family (2-4 Unit). Listing-text estimate: 2 units. confirmed
Listing remarks
Spacious two-family featuring 6BR/3BA, ~1,800 SF, and finished basement. Located in a stable residential neighborhood near shopping, schools, major roadways, and public transportation. Convenient access to key corridors enhances commuting and daily living. Strong value-add opportunity with flexible multi-unit layout. Sold as-is; buyer to verify occupancy and condition.
Key facts
- 1,858 sq ft lot
- Built 1910
- Listed 20 days
Property features AI
Finance
- Financial info: Tax year 2026
Exterior
- Parking: No carport; No designated parking features
- Utilities: Public sewer; Utilities: see remarks
- Home design: Duplex; Approx. 1,800 total building area (appraiser source)
- Construction: Frame construction; Other foundation details
- Exterior features: Frame construction; Not waterfront
Interior
- Bedrooms: Two 3-bedroom units
- Bathrooms: Three full bathrooms
- Heating & cooling: Baseboard heating; Hot water heating; Natural gas heating; No central cooling
- Interior features: Finished full basement; Other interior features
Neighborhood map
What this means for you Summary
Snapshot
- This is a 2 × 6.0-bed/3.0-bath units multifamily listed at $662k.
Deal economics
- At list price, monthly cash flow is $2k ($25k/yr) — positive. Per door: $1k/mo.
- The deal already cash-flows at list — no discount required.
- Meets the 1% rule at list price ($8k rent vs $662k).
- Recommended offer: $653k (1.5% below list) — sets the bar for market timing.
- Cap rate 10.1% vs local median 2.6% in New York — top-decile yield for the area; either an underpriced asset or a hidden risk that comps aren't pricing in. Stress-test before assuming the spread holds.
Location & tenants
- Location reads 75/100 on livability (#268 in NY, #4,188 nationally) — a middle-class / working-renter tenant base. Strengths: amenities A+, commute A+, health & safety A; Watch: crime F, cost of living F.
- Market conditions: 136 active listings in the ZIP; solid renter incomes; 5,302 units permitted in Queens County in 2024 (4,918 in 5+ unit buildings).
- At $7,944/mo this rent would consume 102% of the median local household income ($93k/yr) (locally 1646% of renters already pay >50% of income on rent) — very limited rent-growth headroom before tenants either downsize or default.
Forward outlook
- Local home prices are declining (-3.0%/yr); year-one equity from $5k of loan paydown is wiped out by about $20k of value loss. Plan a longer hold.
- Queens County population projected at +16% by 2050 — long-run rental-demand tailwind backs the buy-and-hold thesis.
- At projected returns (-3.0% appreciation + 3.0% rent growth), your $186k cash investment doubles in ~9 years — after that, you're playing with house money.
Negotiation context
- It's been on market 20 days — a 2% lower offer ($653k) is reasonable based on typical stale-listing flexibility.
- 2 sale attempts with the ask held roughly flat each time — persistent listings suggest the price (not the market) is what's stuck; bring a comps-based counter.
Risks & watch-outs
- Watch-outs: built in 1910 — expect roof / HVAC / electrical / plumbing capex.
- Climate carrying-cost: major wind risk, 50% chance of damaging wind over 30y; extreme-heat days projected 7→15/yr by 2055 (HVAC capex compounding) — expect insurance premiums to compound above CPI over the hold.
Questions for the listing agent
- Can we see the unit-by-unit rent roll, current vacancy, and any below-market leases? What's the average tenancy length?
- What capital expenditures (roof, boiler, parking lot, exteriors) have been made in the last 5 years, and what's planned in the next 2?
- Built in 1910 — when were the roof, HVAC, electrical panel, plumbing, and water heater last replaced?
- Is there a deadline driving the sale (1031 exchange, divorce, estate, relocation)? That informs how much negotiation room exists.
- Schools are B-rated — typically a magnet for longer-tenancy family renters. What's the average tenant stay here, and is there a school-zone premium baked into asking?
- Crime grade is F in this area — have there been break-ins, vandalism, or insurance claims at this property in the last 3 years? What carrier currently insures it and at what premium?
- What's the average days-on-market for RENTAL listings here right now (not sales)? A rising rental-DOM trend means longer vacancies and softer asking-rent achievability than the comps imply.
- What's the recent tenant-quality profile in this submarket — average credit score on applications, eviction rate, late-payment / NSF rate, and stable-employment percentage? A property-management company in the area should have these aggregated.
- How much new apartment / multifamily construction is in the pipeline within 1–3 miles? Heavy new supply (>2% of stock underway) typically softens rents 12–24 months out; light construction supports rent growth.
Investment metrics
- 1% rule
- 1.20% ✓
- Cap rate
- 10.08%
- Cash-on-cash
- 13.54%
- DSCR
- 1.60
- GRM
- 6.9
CMA / ARV
No comps found within radius.
Projected returns pro-forma
-3.0% appreciation · 3.0% rent growth · sell at horizon
- IRR
- 3.6%
- Equity multiple
- 1.14×
- Total profit
- $25,806
- Equity at exit
- $98,781
- IRR
- 13.1%
- Equity multiple
- 2.04×
- Total profit
- $193,594
- Equity at exit
- $57,281
Cash invested: $185,500 (down + closing). Projections, not guarantees.
Landlord ↔ Tenant lean methodology
- Overall (CITY)
- 0 Strongly Tenant-Friendly
- State New York
- 15 Strongly Tenant-Friendly · D+10
- County
- — inherits STATE
- City New York
- 0 Strongly Tenant-Friendly · D+34
ZIP-level market 11419
- Active inventory
- 136
- Price-to-rent
- 13.9×
Monthly cashflow live
- Estimated rent
- $7,944 medium interval (Pro) →
- Mortgage (P&I)
- −$3,474
- Tax from tax record
- −$433 /mo · $5,194/yr
- Insurance
- −$276
- HOA
- −$0
- Vacancy / Maint / Mgmt
- −$1,668
- Net cashflow
- $2,093
Break-even live
2-unit breakdown (identical units grouped — click to expand)
| Units | Beds | Baths | Est. rent |
|---|---|---|---|
| 2× units | 6.0 | 3 | $7,944 |
| #1 | 6.0 | 3 | $3,972 |
| #2 | 6.0 | 3 | $3,972 |
| Total (2 units) | $7,944 | ||
UW: 25.0% down · 7.5% · 30yr · 1.5% tax · 5.0% vac · 8.0% maint · 8.0% mgmt
Financing live
Cash to close
- Down payment
- $165,625
- Closing costs
- $19,875
- Reserves months
- —
- Total cash needed
- —
Loan-product check · same deal, 3 products live
Conventional
25% down · 7.5% · 30yr
- Down + closing
- —
- Monthly P&I
- —
- Monthly cashflow
- —
- DSCR
- —
- Eligible?
- —
Personal DTI + credit; lowest rate.
DSCR
20% down · 8.5% · 30yr
- Down + closing
- —
- Monthly P&I
- —
- Monthly cashflow
- —
- DSCR
- —
- Eligible?
- —
No personal income docs; deal must DSCR.
Hard money
10% down · 12.0% · 12mo
- Down + closing
- —
- Monthly P&I
- —
- Monthly cashflow
- —
- DSCR
- —
- Eligible?
- —
Short-term bridge; refi at stabilization.
Listing history 13 events
-
2026-06-18days on market $662,500 Active 20 DOM
-
2026-06-17days on market $662,500 Active 19 DOM
-
2026-06-16days on market $662,500 Active 18 DOM
-
2026-06-15days on market $662,500 Active 17 DOM
-
2026-06-13days on market $662,500 Active 15 DOM
-
2026-06-10days on market $662,500 Active 11 DOM
-
2026-06-08days on market $662,500 Active 10 DOM
-
2026-06-08days on market $662,500 Active 9 DOM
-
2026-06-04days on market $662,500 Active 6 DOM
-
2026-06-03days on market $662,500 Active 5 DOM
-
2026-06-02days on market $662,500 Active 4 DOM
-
2026-06-01days on market $662,500 Active 3 DOM
-
2026-05-31days on market $662,500 Active 2 DOM
ⓘ Source: listings_history table (triggers on properties + properties_extension) + one-shot
backfill from property_details.listing_events for pre-trigger history.
Tax reassessment forecast NY · Partial reset (capped growth)
- Current annual tax
- $5,194 · $433/mo
- Projected year-2 tax
- $8,195 · $683/mo
- Expected delta
- +$3,001/yr (+$250/mo · 57.8%)
ⓘ Screening estimate from a state-policy table — verify with the county assessor before closing.
Climate risk First Street
- Flood 3/10 Moderate FEMA zone X (unshaded) · 10% chance over 30 yrs
- Wildfire 1/10 Low
- Heat 7/10 Severe 7 d/yr ≥98°F today · 15 d/yr by 30 yrs out
- Wind 6/10 Major 50% chance of damaging wind over 30 yrs
- Air quality 4/10 Moderate 6 unhealthy d/yr today · 6 by 30 yrs out
Nearby sold comps map
Loading sold comps map…
Walkable amenities ~0.75 mi
Loading nearby amenities…
Taxation est. · year 1
- Rental income
- $95,328
- − Mortgage interest
- −$37,110
- − Property taxes
- −$5,194
- − Insurance
- −$3,312
- − Repairs & maintenance
- −$7,626
- − Management
- −$7,626
- − Depreciation
- −$19,273
- Taxable income
- $15,186
- Est. tax owed @ 24.0%
- −$3,645
- After-tax cash flow
- $21,467/yr
For passive investors: Depreciation is non-cash, so a rental often shows a tax loss while cash-flowing — sheltering income. Rental losses are passive: they offset passive income freely, and up to $25,000/yr can offset ordinary (W-2) income if you actively participate and your MAGI is under $100k (phasing out to $0 by $150k); unused losses carry forward. On sale, claimed depreciation is recaptured at up to 25%, and gains may owe capital-gains tax (a 1031 exchange can defer both). Figures are a year-1 estimate at your 24.0% rate — not tax advice; consult a CPA.
Schools (NCES district)
No district data.
Livability — New York
- Score
- 75/100
- State rank
- #268
- US rank
- #4188
Category grades
Schools grade is shown separately in the Schools card above.
Census & demographics
- Census place
- New York, NY
- County
- Queens County · 1,914,869 people
- City population
- 7,731,280
- Metro
- New York-Newark-Jersey City, NY-NJ-PA
- Population (ZIP)
- 47,441
- Household income
- $93,399
- Rent vs Own
- Severe rent burden
- 1646.0
Population outlook (Queens County) Hauer SSP2
- Today (2025)
- 2,546,320 people
- By 2030
- 2,643,059 · +3.8%
- By 2040
- 2,815,563 · +10.6%
- By 2050
- 2,944,423 · +15.6%
- By 2075
- 3,123,338 · +22.7%
- By 2100
- 3,098,688 · +21.7%
Race, ethnicity, and origin ACS 2023
- Neighborhood character
- Highly diverse neighborhood (Simpson 0.83)
- Race & ethnicity
- Asian 34% Hispanic / Latino 21% Two or more races 15% Black 11% White 4% Native American 3%
- Hispanic origin (detail)
- Mexican 2% Puerto Rican 3% Dominican 4%
- Common ancestry
- Hispanic 1%
- Foreign-born
- 66% · Canada, Jamaica, China
- Languages at home
- 59% English-only · Other Indo-European 19% Spanish 18% Chinese 2%
Political lean MEDSL · Queens
- 2024 margin
- Strong D (+24.6) · D 62.3% · R 37.7%
- 2008→2024 swing
- -26.2pp toward R · 2008: 50.8pp · 2024: 24.6pp
- All cycles
- 2024: D+24.6 2020: D+45.2 2016: D+53.4 2012: D+58.5 2008: D+50.8
Not yet ingested
- Civics
- —
Market trends
- HPI YoY
- ▼ -490.33%
- Current HPI
- 290.7615
- Rent YoY
- —
- Metro
- New York-Newark-Jersey City, NY-NJ-PA
- State GDP YoY
- ▲ 2.60%
- F500 in state
- 92
Industry mix (Fortune 500 HQ in NY)
| Industry | F500 HQs | Revenue |
|---|---|---|
| Financial Services | 10 | $950B |
|
||
| Consumer Goods | 9 | $162B |
|
||
| Insurance | 4 | $225B |
|
||
| Telecommunications | 2 | $144B |
|
||
| Pharmaceuticals | 2 | $112B |
|
||
| Media / Entertainment | 2 | $69B |
|
||
Price history
+350.7% since first listed6 events — show timeline
- 2026-05-29 Relisted — OneKey® MLS as Distributed by MLS Grid
- 2026-05-28 Listing Removed — OneKey® MLS as Distributed by MLS Grid
- 2026-05-28 Listed $662,500 OneKey® MLS as Distributed by MLS Grid
- 2006-01-04 Sold (Public Records) $576,800 Public Records
- 1998-06-23 Sold (Public Records) $215,000 Public Records
- 1995-02-01 Sold (Public Records) $147,000 Public Records
Property tax history
+4.1%/yrLatest (2025): $5,194 · +6.9% YoY. Source: county tax records.
Cash-flow waterfall
monthlySold comps — $/sqft
last 12 mo · ≤1 miLoading sold comps…