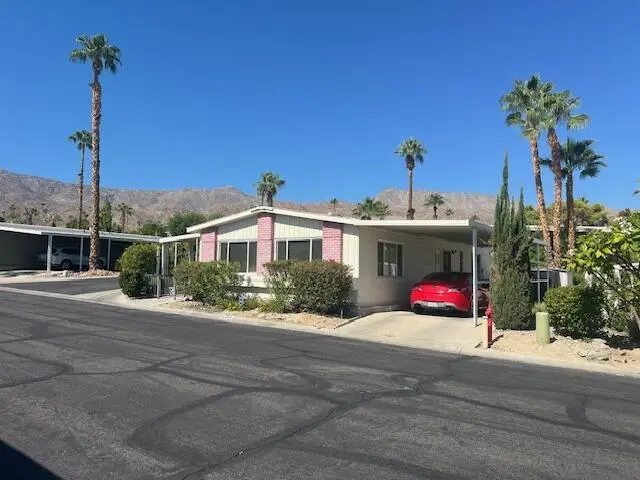
49305 Highway 74 #136 · Palm Desert, CA
Flood risk 4/10 · Minor
- FEMA flood zone
- X
- Chance of flooding over 30 yrs
- 0.22%
- Est. flood insurance / yr
- $507 – $1,088
Fire risk 4/10 · Minor
- Est. fire insurance / yr
- $659 – $1,223
Heat risk 8/10 · Major
- Hot days now (above 107°F)
- 9 days/yr
- Hot days in 30 yrs
- 25 days/yr
Wind risk 1/10 · Minimal
- Chance of severe wind over 30 yrs
- —
Air-quality risk 4/10 · Minor
- Unhealthy air days now
- 5 days/yr
- Unhealthy air days in 30 yrs
- 6 days/yr
Risk factors via First Street. Map © Google.
Why this score? — see what drove the B- grade
The composite is a weighted blend of 9 inputs, each scored 0–100. Each bar is that input's sub-score; the figure is the points it added to the 100-point composite (weight × sub-score).
- Cash flow +30.0/30.0
- 1% rule +10.0/10.0
- DSCR +10.0/10.0
- ARV discount +6.7/15.0
- Schools +3.8/10.0
- Rent growth +2.9/5.0
- Livability +2.6/5.0
- Condition / age +2.5/5.0
- Appreciation +0.0/10.0
$229,000
🖨 Deal sheet 📄 Offer letter ✓ Due diligence
Listing remarks MLS
Location Location Location This property is located steps away from the Pool, Spa, and Clubhouse. It boasts 3 bedrooms and 2 baths approximatelt 1900 sq ft triple wide configuration and has a patio plus ample parking. The home is in need of a new roof and upgrading flooring ect. perfect for someone who would like to make this a diamond in the ruff. Please do not hesitate to make an offer seller is motivated. Call Marilyn Schwartz for showings
Key facts
- Steps away from spa
- Ample parking
- Patio
Tags
Neighborhood map
What this means for you Summary
Snapshot
- This is a 3-bed/2.0-bath manufactured listed at $229k.
Deal economics
- At list price, monthly cash flow is $2k ($21k/yr) — positive.
- The deal already cash-flows at list — no discount required.
- Meets the 1% rule at list price ($4k rent vs $229k).
- Recommended offer: $202k (12.0% below list) — sets the bar for market timing.
- Cap rate 15.5% vs local median 3.5% in Palm Desert — top-decile yield for the area; either an underpriced asset or a hidden risk that comps aren't pricing in. Stress-test before assuming the spread holds.
Location & tenants
- Location reads 51/100 on livability (#1,050 in CA) — a working-class tenant base; expect higher turnover. Strengths: schools A-, employment B+, housing B; Watch: crime D, amenities F, commute F.
- Desert Sands Unified (suburban): math 31% / reading 56% proficiency, ranked #199 of 517 in CA (top 38%) — families likely to look elsewhere, expect single-tenant / working-renter base with shorter leases.
- Market conditions: Rents rising (+1.6%/yr); 545 active listings in the ZIP; 36 comparable units currently listed for rent nearby; rentals at typical pace (median 25d on market — plan ~3-4 weeks tenant-placement turnaround); 44% of comp listings sitting > 30 days — soft ceiling on asking rent; 9,195 units permitted in Riverside County in 2024 (1,512 in 5+ unit buildings).
- At $4,237/mo this rent would consume 73% of the median local household income ($70k/yr) (locally 1734% of renters already pay >50% of income on rent) — very limited rent-growth headroom before tenants either downsize or default.
Forward outlook
- Local home prices are declining (-3.0%/yr); year-one equity from $2k of loan paydown is wiped out by about $7k of value loss. Plan a longer hold.
- Riverside County population projected at +22% by 2050 — long-run rental-demand tailwind backs the buy-and-hold thesis.
- At projected returns (-3.0% appreciation + 1.6% rent growth), your $64k cash investment doubles in ~4 years — after that, you're playing with house money.
Negotiation context
- It's been on market 272 days — a 12% lower offer ($202k) is reasonable based on typical stale-listing flexibility.
- 10 sale attempts since 25y ago with the ask held roughly flat each time — persistent listings suggest the price (not the market) is what's stuck; bring a comps-based counter.
- Current owner paid $54k; list at $229k implies a 324% gain — meaningful room to come down on a strong offer.
Risks & watch-outs
- Climate carrying-cost: extreme-heat days projected 9→25/yr by 2055 (HVAC capex compounding) — expect insurance premiums to compound above CPI over the hold.
Questions for the listing agent
- It's been on market 272 days. Have you received any prior offers? Is the seller open to a 12% concession, seller financing, or rate buy-down credit?
- Built in 1977 — when were the roof, HVAC, electrical panel, plumbing, and water heater last replaced?
- Why hasn't it sold? Are there any deal-killer items the seller is aware of (foundation, flood, title, zoning, code violations)?
- Is there a deadline driving the sale (1031 exchange, divorce, estate, relocation)? That informs how much negotiation room exists.
- Schools are A-rated — typically a magnet for longer-tenancy family renters. What's the average tenant stay here, and is there a school-zone premium baked into asking?
- Crime grade is D in this area — have there been break-ins, vandalism, or insurance claims at this property in the last 3 years? What carrier currently insures it and at what premium?
- What's the average days-on-market for RENTAL listings here right now (not sales)? A rising rental-DOM trend means longer vacancies and softer asking-rent achievability than the comps imply.
- What's the recent tenant-quality profile in this submarket — average credit score on applications, eviction rate, late-payment / NSF rate, and stable-employment percentage? A property-management company in the area should have these aggregated.
- How much new for-sale + rental construction is in the pipeline within 1–3 miles? Heavy new supply typically softens prices + rents 12–24 months out; constrained supply supports both.
Investment metrics
- 1% rule
- 1.85% ✓
- Cap rate
- 15.54%
- Cash-on-cash
- 33.02%
- DSCR
- 2.47
- GRM
- 4.5
CMA / ARV
- ARV (median comp)
- $225,000
- List price
- $229,000
- Delta
- 1.78%
- Verdict
- FAIR
- Comps
- 19 within 1.0 mi
Show comp detail 7 sales within ~0.75 mi
| Address | Dist | Beds/Ba | Sqft | Sold | Price | $/sf | Match |
|---|---|---|---|---|---|---|---|
| 49305 Hwy 74 Spc 49 | 0.00mi | 3/2.0 | 1,920 (+5%) | 5mo | $255,000 | $133 | 87 |
| 49305 Highway 74 #101 | 0.00mi | 3/2.0 | 1,640 (-10%) | 1mo | $90,000 | $55 | 82 |
| 49305 Highway 74 #111 | 0.00mi | 2/2.0 (-1) | 1,650 (-10%) | 4mo | $299,950 | $182 | 76 |
| 50 Country Club Dr | 0.25mi | 2/2.0 (-1) | 1,740 (-5%) | 1mo | $170,000 | $98 | 75 |
| 12 Yucca Ln | 0.39mi | 3/2.0 | 1,770 (-3%) | 15mo | $155,000 | $88 | 65 |
| 49305 Highway 74 #121 | 0.00mi | 2/2.0 (-1) | 1,560 (-14%) | 18mo | $246,000 | $158 | 56 |
| 27 Rustic Rock Ln | 0.19mi | 2/2.0 (-1) | 1,608 (-12%) | 16mo | $255,000 | $159 | 53 |
Match score weights: distance 35% · size 25% · config 20% · recency 20%. Top-matched comps best support the ARV.
Projected returns pro-forma
-3.0% appreciation · 1.6% rent growth · sell at horizon
- IRR
- 26.6%
- Equity multiple
- 2.08×
- Total profit
- $69,446
- Equity at exit
- $34,145
- IRR
- 33.4%
- Equity multiple
- 3.84×
- Total profit
- $181,952
- Equity at exit
- $19,800
Cash invested: $64,120 (down + closing). Projections, not guarantees.
Landlord ↔ Tenant lean methodology
- Overall (STATE)
- 18 Strongly Tenant-Friendly
- State California
- 18 Strongly Tenant-Friendly · D+13
- County
- — inherits STATE
- City
- — inherits STATE
ZIP-level market 92260
- Rents YoY
- 1.6%
- Active inventory
- 545
- Price-to-rent
- 4.5×
Monthly cashflow live
- Estimated rent
- $4,237 high interval (Pro) →
- Mortgage (P&I)
- −$1,201
- Tax est. 1.5%
- −$286 /mo · $3,435/yr
- Insurance
- −$95
- HOA
- −$0
- Vacancy / Maint / Mgmt
- −$890
- Net cashflow
- $1,764
Break-even live
UW: 25.0% down · 7.5% · 30yr · 1.5% tax · 5.0% vac · 8.0% maint · 8.0% mgmt
Financing live
Cash to close
- Down payment
- $57,250
- Closing costs
- $6,870
- Reserves months
- —
- Total cash needed
- —
Loan-product check · same deal, 3 products live
Conventional
25% down · 7.5% · 30yr
- Down + closing
- —
- Monthly P&I
- —
- Monthly cashflow
- —
- DSCR
- —
- Eligible?
- —
Personal DTI + credit; lowest rate.
DSCR
20% down · 8.5% · 30yr
- Down + closing
- —
- Monthly P&I
- —
- Monthly cashflow
- —
- DSCR
- —
- Eligible?
- —
No personal income docs; deal must DSCR.
Hard money
10% down · 12.0% · 12mo
- Down + closing
- —
- Monthly P&I
- —
- Monthly cashflow
- —
- DSCR
- —
- Eligible?
- —
Short-term bridge; refi at stabilization.
Rent comps 36 comps
| Address | Beds | Baths | Sqft | Rent | $/sqft | DOM | Units | Dist |
|---|---|---|---|---|---|---|---|---|
| 72304 Blueridge Ct Palm Desert, CA | 2.0 | 2.0 | 1786 | $4,000 | $2.24 | 10d | 1 | 0.21mi |
| 48950 Desert Flower Dr Palm Desert, CA | 3.0 | 2.5 | 1348 | $5,000 | $3.71 | 2d | 1 | 0.22mi |
| 73280 Avenida Descanso Palm Desert, CA | 3.0 | 2.0 | 1290 | $4,250 | $3.29 | 3d | 1 | 0.24mi |
| 48983 Canyon Crest Ln Unit 1 Palm Desert, CA | 3.0 | 2.0 | 1892 | $2,300 | $1.22 | 2d | 1 | 0.26mi |
| 48790 Desert Flower Dr Palm Desert, CA | 3.0 | 2.5 | 1348 | $2,500 | $1.85 | 24d | 1 | 0.29mi |
| 48790 Desert Flower Dr Palm Desert, CA | 3.0 | 2.5 | 1348 | $2,500 | $1.85 | 2d | 1 | 0.29mi |
| 48728 Desert Flower Dr Palm Desert, CA | 3.0 | 2.0 | 1348 | $2,400 | $1.78 | 24d | 1 | 0.31mi |
| 72417 Rolling Knolls Dr Palm Desert, CA | 3.0 | 2.0 | 1548 | $6,500 | $4.20 | 44d | 1 | 0.35mi |
| 72346 Sommerset Dr Palm Desert, CA | 2.0 | 2.0 | 1440 | $3,950 | $2.74 | 44d | 1 | 0.40mi |
| 72350 Rim Dr Palm Desert, CA | 3.0 | 3.0 | 1744 | $3,800 | $2.18 | 15d | 1 | 0.50mi |
| 72409 Glenview Cir Palm Desert, CA | 3.0 | 2.0 | 1786 | $2,700 | $1.51 | 18d | 1 | 0.52mi |
| 72499 Desert Flower Dr Palm Desert, CA | 3.0 | 2.0 | 1786 | $3,400 | $1.90 | 44d | 1 | 0.59mi |
| 73103 Ajo Ln Palm Desert, CA | 2.0 | 3.0 | 1689 | $8,250 | $4.88 | 2d | 1 | 0.69mi |
| 48624 Torrito Ct Palm Desert, CA | 2.0 | 2.0 | 1745 | $7,000 | $4.01 | 2d | 1 | 0.77mi |
| 73153 Ajo Ln Palm Desert, CA | 2.0 | 2.0 | 1585 | $4,500 | $2.84 | 3d | 1 | 0.93mi |
| 72818 Skyward Way Palm Desert, CA | 3.0 | 2.0 | 1810 | $4,000 | $2.21 | 44d | 1 | 0.96mi |
| 72827 Haystack Rd Palm Desert, CA | 4.0 | 4.0 | 2247 | $7,500 | $3.34 | 44d | 1 | 1.03mi |
| 73407 Foxtail Ln Palm Desert, CA | 2.0 | 2.0 | 1426 | $2,600 | $1.82 | 44d | 1 | 1.11mi |
| 73405 Foxtail Ln Palm Desert, CA | 3.0 | 2.5 | 1525 | $4,000 | $2.62 | 44d | 1 | 1.11mi |
| 73422 Irontree Dr Palm Desert, CA | 2.0 | 2.5 | 1502 | $3,500 | $2.33 | 4d | 1 | 1.11mi |
| 73416 Mariposa Dr Palm Desert, CA | 2.0 | 2.0 | 1685 | $5,000 | $2.97 | 44d | 1 | 1.13mi |
| 72870 Deer Grass Dr Palm Desert, CA | 4.0 | 2.5 | 2220 | $5,999 | $2.70 | 44d | 1 | 1.15mi |
| 73429 Foxtail Ln Palm Desert, CA | 2.0 | 3.0 | 1525 | $3,250 | $2.13 | 44d | 1 | 1.15mi |
| 73441 Foxtail Ln Palm Desert, CA | 2.0 | 2.0 | 1426 | $3,495 | $2.45 | 44d | 1 | 1.16mi |
| 73335 Oriole Ct Palm Desert, CA | 2.0 | 2.0 | 1700 | $6,500 | $3.82 | 44d | 1 | 1.22mi |
| 73476 Dalea Ln Palm Desert, CA | 2.0 | 2.0 | 1271 | $5,000 | $3.93 | 44d | 1 | 1.24mi |
| 73055 Amber St Palm Desert, CA | 3.0 | 2.5 | 2534 | $9,250 | $3.65 | 44d | 1 | 1.27mi |
| 73503 Foxtail Ln Palm Desert, CA | 2.0 | 3.0 | 1502 | $2,800 | $1.86 | 18d | 1 | 1.27mi |
| 48910 Noline Pl Palm Desert, CA | 2.0 | 2.0 | 1512 | $7,000 | $4.63 | 3d | 1 | 1.30mi |
| 73409 Little Bend Trl Palm Desert, CA | 3.0 | 3.0 | 1847 | $4,000 | $2.17 | 24d | 1 | 1.32mi |
| 73428 Little Bend Trl Palm Desert, CA | 3.0 | 2.0 | 1885 | $4,500 | $2.39 | 11d | 1 | 1.36mi |
| 73680 Irontree Dr Palm Desert, CA | 2.0 | 2.5 | 1819 | $6,500 | $3.57 | 3d | 1 | 1.36mi |
| 73310 Calliandra St Palm Desert, CA | 3.0 | 3.5 | 2225 | $6,600 | $2.97 | 3d | 1 | 1.42mi |
| 72751 Citrus Ct Unit Na Palm Desert, CA | 2.0 | 2.0 | 1350 | $4,000 | $2.96 | 44d | 1 | 1.46mi |
| 48832 Cassia Pl Palm Desert, CA | 3.0 | 3.5 | 2238 | $12,000 | $5.36 | 44d | 1 | 1.48mi |
| 47967 Sun Corral Trl Palm Desert, CA | 4.0 | 4.0 | 2374 | $10,000 | $4.21 | 24d | 1 | 1.49mi |
Listing history 29 events
-
2026-06-04days on market $229,000 Active 272 DOM
-
2026-06-03days on market $229,000 Active 271 DOM
-
2026-06-02days on market $229,000 Active 270 DOM
-
2026-06-01days on market $229,000 Active 269 DOM
-
2026-05-31days on market $229,000 Active 268 DOM
-
2025-09-18price $229,000 447-char remark
Show marketing remark (447 chars)
Location Location Location This property is located steps away from the Pool, Spa, and Clubhouse. It boasts 3 bedrooms and 2 baths approximatelt 1900 sq ft triple wide configuration and has a patio plus ample parking. The home is in need of a new roof and upgrading flooring ect. perfect for someone who would like to make this a diamond in the ruff. Please do not hesitate to make an offer seller is motivated. Call Marilyn Schwartz for showings
-
2025-09-05$239,000 Active 447-char remark
Show marketing remark (447 chars)
Location Location Location This property is located steps away from the Pool, Spa, and Clubhouse. It boasts 3 bedrooms and 2 baths approximatelt 1900 sq ft triple wide configuration and has a patio plus ample parking. The home is in need of a new roof and upgrading flooring ect. perfect for someone who would like to make this a diamond in the ruff. Please do not hesitate to make an offer seller is motivated. Call Marilyn Schwartz for showings
-
2017-06-29historical
-
2017-04-12$62,500 Active
-
2016-10-06soldstatus $54,000 Closed
-
2016-10-06soldstatus $54,000 Sold
-
2016-09-02status Pending
-
2016-07-14price $55,700
-
2016-07-13$57,700 Active
-
2016-01-18historical
-
2016-01-02$67,900 Active
-
2014-05-18historical Hold
-
2014-04-08$78,500 Active
-
2014-04-01historical
-
2014-01-31price $78,500
-
2013-11-06$86,500 Active
-
2013-11-06historical
-
2013-05-03$86,500 Active
-
2006-11-11historical
-
2006-05-16$99,900
-
2006-05-10historical
-
2005-11-06$120,000
-
2002-01-04historical
-
2001-06-27$67,500
ⓘ Source: listings_history table (triggers on properties + properties_extension) + one-shot
backfill from property_details.listing_events for pre-trigger history.
Climate risk First Street
- Flood 4/10 Moderate FEMA zone X · 22% chance over 30 yrs
- Wildfire 4/10 Moderate
- Heat 8/10 Severe 9 d/yr ≥107°F today · 25 d/yr by 30 yrs out
- Wind 1/10 Low
- Air quality 4/10 Moderate 5 unhealthy d/yr today · 6 by 30 yrs out
Nearby sold comps map
Loading sold comps map…
Walkable amenities ~0.75 mi
Loading nearby amenities…
Taxation est. · year 1
- Rental income
- $50,840
- − Mortgage interest
- −$12,828
- − Property taxes
- −$3,435
- − Insurance
- −$1,145
- − Repairs & maintenance
- −$4,067
- − Management
- −$4,067
- − Depreciation
- −$6,662
- Taxable income
- $18,636
- Est. tax owed @ 24.0%
- −$4,473
- After-tax cash flow
- $16,700/yr
For passive investors: Depreciation is non-cash, so a rental often shows a tax loss while cash-flowing — sheltering income. Rental losses are passive: they offset passive income freely, and up to $25,000/yr can offset ordinary (W-2) income if you actively participate and your MAGI is under $100k (phasing out to $0 by $150k); unused losses carry forward. On sale, claimed depreciation is recaptured at up to 25%, and gains may owe capital-gains tax (a 1031 exchange can defer both). Figures are a year-1 estimate at your 24.0% rate — not tax advice; consult a CPA.
Schools (NCES district)
- District
- Desert Sands Unified
- NCES district ID
- 0611110
- Math proficiency
- 31% ▼ -4.00%
- Reading proficiency
- 56% ▲ 7.00%
- Median HH income
- $54,957
- Composite
- 37.77/100
- National rank
- #4346
- State rank
- #199 of 517 in CA
Livability — Palm Desert
- Score
- 51/100
- State rank
- #1050
- US rank
- #25164
Category grades
Schools grade is shown separately in the Schools card above.
Census & demographics
- Census place
- Palm Desert, CA
- County
- Riverside County · 2,287,001 people
- City population
- 58,615
- Metro
- Riverside-San Bernardino-Ontario, CA
- Population (ZIP)
- 30,523
- Household income
- $70,091
- Rent vs Own
- Severe rent burden
- 1734.0
Population outlook (Riverside County) Hauer SSP2
- Today (2025)
- 2,664,475 people
- By 2030
- 2,802,692 · +5.2%
- By 2040
- 3,050,904 · +14.5%
- By 2050
- 3,256,783 · +22.2%
- By 2075
- 3,655,058 · +37.2%
- By 2100
- 3,766,594 · +41.4%
Race, ethnicity, and origin ACS 2023
- Neighborhood character
- Majority White (61%)
- Race & ethnicity
- White 61% Hispanic / Latino 31% Two or more races 20% Asian 4% Black 2%
- Hispanic origin (detail)
- Mexican 25%
- Common ancestry
- Italian 4% Lithuanian 3% Slovak 2%
- Foreign-born
- 18% · Canada, South Korea, Vietnam
- Languages at home
- 73% English-only · Spanish 22% French/Haitian/Cajun 1% Other Indo-European 1%
Political lean MEDSL · Riverside
- 2024 margin
- Toss-up / Even · D 48.0% · R 49.3% · Other 2.6%
- 2008→2024 swing
- -3.6pp toward R · 2008: 2.3pp · 2024: -1.3pp
- All cycles
- 2024: R+1.3 2020: D+8.0 2016: D+4.3 2012: R+0.4 2008: D+2.3
Not yet ingested
- Civics
- —
Market trends
- HPI YoY
- ▼ -364.94%
- Current HPI
- 294.9425
- Rent YoY
- ▲ 1.60%
- Metro
- Riverside-San Bernardino-Ontario, CA
- State GDP YoY
- ▲ 3.21%
- F500 in state
- 116
Industry mix (Fortune 500 HQ in CA)
| Industry | F500 HQs | Revenue |
|---|---|---|
| Technology | 27 | $1,492B |
|
||
| Financial Services | 3 | $174B |
|
||
| Retail | 3 | $44B |
|
||
| Insurance | 3 | $26B |
|
||
| Media / Entertainment | 2 | $115B |
|
||
| Pharmaceuticals / Biotech | 2 | $62B |
|
||
Price history
+239.3% since first listed24 events — show timeline
- 2025-09-18 Price Changed $229,000 GPSMLS
- 2025-09-05 Listed $239,000 GPSMLS
- 2017-06-29 Listing Removed — GPSMLS
- 2017-04-12 Listed $62,500 GPSMLS
- 2016-10-06 Sold (MLS) $54,000 GPSMLS
- 2016-10-06 Sold (MLS) $54,000 GPSMLS
- 2016-09-02 Pending — GPSMLS
- 2016-07-14 Price Changed $55,700 GPSMLS
- 2016-07-13 Listed $57,700 GPSMLS
- 2016-01-18 Listing Removed — GPSMLS
- 2016-01-02 Listed $67,900 GPSMLS
- 2014-05-18 Delisted — GPSMLS
- 2014-04-08 Listed $78,500 GPSMLS
- 2014-04-01 Listing Removed — GPSMLS
- 2014-01-31 Price Changed $78,500 GPSMLS
- 2013-11-06 Listed $86,500 GPSMLS
- 2013-11-06 Listing Removed — GPSMLS
- 2013-05-03 Listed $86,500 GPSMLS
- 2006-11-11 Listing Removed — GPSMLS
- 2006-05-16 Listed $99,900 GPSMLS
- 2006-05-10 Listing Removed — GPSMLS
- 2005-11-06 Listed $120,000 GPSMLS
- 2002-01-04 Listing Removed — GPSMLS
- 2001-06-27 Listed $67,500 GPSMLS
Property tax history
-4.0%/yrLatest (2025): $394 · +1.8% YoY. Source: county tax records.
Cash-flow waterfall
monthlySold comps — $/sqft
last 12 mo · ≤1 miLoading sold comps…