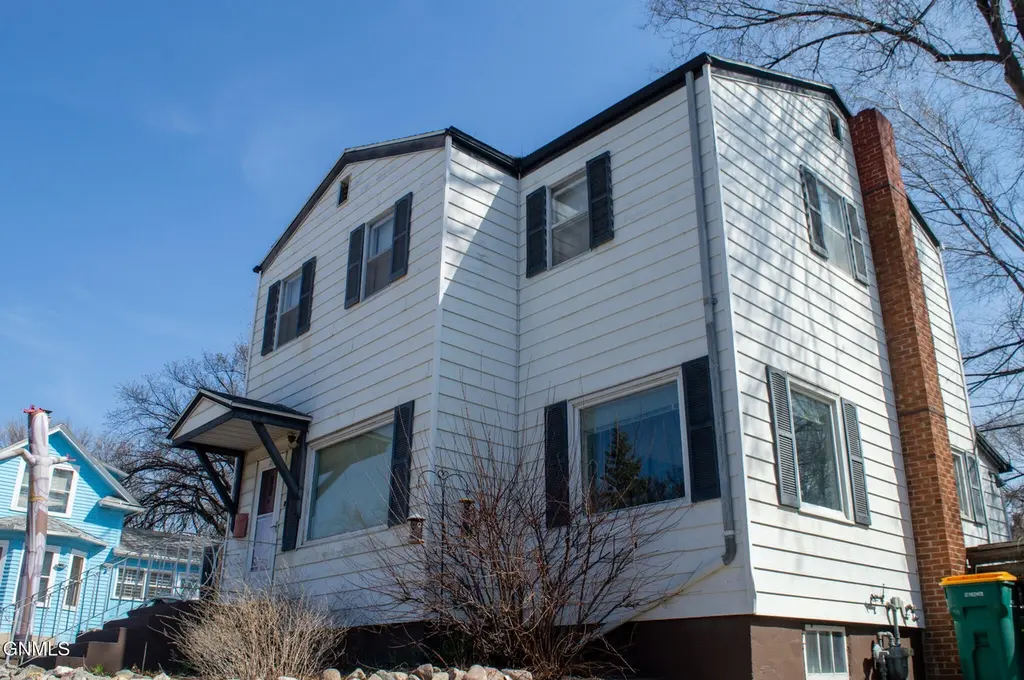
217 Washington St · Bismarck, ND
Flood risk No data
- FEMA flood zone
- —
- Chance of flooding over 30 yrs
- —
- Est. flood insurance / yr
- —
Fire risk No data
- Est. fire insurance / yr
- —
Heat risk No data
- Hot days now (above threshold)
- —
- Hot days in 30 yrs
- —
Wind risk No data
- Chance of severe wind over 30 yrs
- —
Air-quality risk No data
- Unhealthy air days now
- —
- Unhealthy air days in 30 yrs
- —
Risk factors via First Street. Map © Google.
Why this score? — see what drove the D+ grade
The composite is a weighted blend of 9 inputs, each scored 0–100. Each bar is that input's sub-score; the figure is the points it added to the 100-point composite (weight × sub-score).
- ARV discount +15.0/15.0
- Cash flow +13.5/30.0
- DSCR +4.1/10.0
- Livability +4.0/5.0
- 1% rule +3.8/10.0
- Schools +3.7/10.0
- Rent growth +3.2/5.0
- Condition / age +2.2/5.0
- Appreciation +0.0/10.0
$207,500
🖨 Deal sheet 📄 Offer letter ✓ Due diligence
Key facts
- 2,204 sq ft lot
- Built 1905
- Listed 68 days
Property features AI
Exterior
- Parking: Off-street parking; No garage
- Security: Smoke detector(s)
- Utilities: Public water; Public sewer
- Home design: Single family residence; Residential property; Three or more levels
- Construction: Metal siding; Steel siding
- Exterior features: Shingle roof; No exterior features listed; No fencing
Interior
- Kitchen: Range; Refrigerator; Dishwasher not listed
- Bedrooms: Total of 9 rooms (bedrooms included)
- Flooring: Carpet; Hardwood; Linoleum
- Bathrooms: 1 full bathroom
- Heating & cooling: Hot water heating; Ceiling fan(s) for cooling
- Interior features: Finished full basement; Smoke detector(s)
- Laundry & utility: Washer; Dryer; Hot water heating
Neighborhood map
What this means for you Summary
Snapshot
- This is a 3-bed/1.0-bath single-family listed at $208k. Condition is rated fair.
Deal economics
- At list price, monthly cash flow is $7 ($81/yr) — positive.
- The deal already cash-flows at list — no discount required.
- To meet the 1% rule (rent ≥ 1% of price), the offer needs to be $182k (12.1% below list).
- Recommended offer: $182k (12.1% below list) — sets the bar for 1% rule.
- Cap rate 6.3% vs local median 3.1% in Bismarck — top-decile yield for the area; either an underpriced asset or a hidden risk that comps aren't pricing in. Stress-test before assuming the spread holds.
Location & tenants
- Location reads 79/100 on livability (#5 in ND, #2,213 nationally) — a middle-class / working-renter tenant base. Strengths: housing A+, health & safety A+, cost of living A; Watch: crime C-, amenities D+, commute F.
- Bismarck 1 (urban): math 41% / reading 42% proficiency, ranked #25 of 53 in ND (top 47%) — families likely to look elsewhere, expect single-tenant / working-renter base with shorter leases; only 19% free/reduced lunch — higher-income household profile.
- Market conditions: Rents rising (+2.8%/yr); 258 active listings in the ZIP; 6 comparable units currently listed for rent nearby; rentals at typical pace (median 21d on market — plan ~3-4 weeks tenant-placement turnaround); solid renter incomes; 259 units permitted in Burleigh County in 2024 (0 in 5+ unit buildings).
Forward outlook
- Local home prices are declining (-3.0%/yr); year-one equity from $1k of loan paydown is wiped out by about $6k of value loss. Plan a longer hold.
- Burleigh County population projected at +61% by 2050 — long-run rental-demand tailwind backs the buy-and-hold thesis.
Negotiation context
- It's been on market 69 days — a 6% lower offer ($195k) is reasonable based on typical stale-listing flexibility.
Risks & watch-outs
- Watch-outs: built in 1905 — expect roof / HVAC / electrical / plumbing capex.
Questions for the listing agent
- It's been on market 69 days. Have you received any prior offers? Is the seller open to a 12% concession, seller financing, or rate buy-down credit?
- Have any recent inspections been done? Can we get a copy of the seller's disclosures and any deferred-maintenance estimates?
- Built in 1905 — when were the roof, HVAC, electrical panel, plumbing, and water heater last replaced?
- Why hasn't it sold? Are there any deal-killer items the seller is aware of (foundation, flood, title, zoning, code violations)?
- Is there a deadline driving the sale (1031 exchange, divorce, estate, relocation)? That informs how much negotiation room exists.
- Schools are B-rated — typically a magnet for longer-tenancy family renters. What's the average tenant stay here, and is there a school-zone premium baked into asking?
- The area grade is low — what's the realistic commute time and amenity access for the typical tenant pool here? Any planned neighborhood developments (good or bad) we should know about?
- What's the average days-on-market for RENTAL listings here right now (not sales)? A rising rental-DOM trend means longer vacancies and softer asking-rent achievability than the comps imply.
- What's the recent tenant-quality profile in this submarket — average credit score on applications, eviction rate, late-payment / NSF rate, and stable-employment percentage? A property-management company in the area should have these aggregated.
- How much new for-sale + rental construction is in the pipeline within 1–3 miles? Heavy new supply typically softens prices + rents 12–24 months out; constrained supply supports both.
Investment metrics
- 1% rule
- 0.88% ✗
- Cap rate
- 6.33%
- Cash-on-cash
- 0.14%
- DSCR
- 1.01
- GRM
- 9.5
CMA / ARV
- ARV (on-the-fly)
- $271,715
- Comps found
- 12
Show comp detail 12 sales within ~0.75 mi
| Address | Dist | Beds/Ba | Sqft | Sold | Price | $/sf | Match |
|---|---|---|---|---|---|---|---|
| 621 Garden Dr | 0.35mi | 4/2.0 (+1) | 1,664 (-5%) | 0mo | $275,000 | $165 | 66 |
| 515 W Avenue A | 0.60mi | 3/2.0 | 1,756 (+0%) | 8mo | $205,000 | $117 | 61 |
| 521 Thayer Ave | 0.48mi | 3/2.0 | 1,872 (+7%) | 17mo | $289,900 | $155 | 48 |
| 319 Willow Ln | 0.59mi | 4/2.0 (+1) | 1,824 (+4%) | 13mo | $309,900 | $170 | 46 |
| 527 Meadow Ln | 0.41mi | 3/2.0 | 1,966 (+12%) | 13mo | $230,000 | $117 | 46 |
| 502 Meadow Ln | 0.46mi | 3/1.5 | 1,998 (+14%) | 14mo | $309,500 | $155 | 42 |
| 908 Lincoln Ave | 0.55mi | 4/2.0 (+1) | 2,002 (+14%) | 1mo | $364,900 | $182 | 41 |
| 1215 Westwood St | 0.69mi | 4/2.0 (+1) | 1,824 (+4%) | 14mo | $290,000 | $159 | 41 |
| 313 9th St S | 0.73mi | 3/2.0 | 1,904 (+9%) | 9mo | $259,900 | $137 | 40 |
| 912 Summit Blvd | 0.56mi | 3/2.0 | 1,993 (+14%) | 11mo | $239,900 | $120 | 38 |
| 1318 Pocatello Dr | 0.75mi | 4/2.0 (+1) | 1,920 (+10%) | 3mo | $359,900 | $187 | 38 |
| 318 C Ave W | 0.74mi | 2/2.0 (-1) | 1,940 (+11%) | 9mo | $257,000 | $132 | 32 |
Match score weights: distance 35% · size 25% · config 20% · recency 20%. Top-matched comps best support the ARV.
Projected returns pro-forma
-3.0% appreciation · 2.81% rent growth · sell at horizon
- IRR
- -16.3%
- Equity multiple
- 0.42×
- Total profit
- $-33,514
- Equity at exit
- $30,939
- IRR
- -8.3%
- Equity multiple
- 0.48×
- Total profit
- $-29,941
- Equity at exit
- $17,941
Cash invested: $58,100 (down + closing). Projections, not guarantees.
Landlord ↔ Tenant lean methodology
- Overall (STATE)
- 82 Strongly Landlord-Friendly
- State North Dakota
- 82 Strongly Landlord-Friendly · R+20
- County
- — inherits STATE
- City
- — inherits STATE
ZIP-level market 58504
- Rents YoY
- 2.8%
- Active inventory
- 258
- Price-to-rent
- 9.5×
Monthly cashflow live
- Estimated rent
- $1,824 high interval (Pro) →
- Mortgage (P&I)
- −$1,088
- Tax est. 1.5%
- −$259 /mo · $3,112/yr
- Insurance
- −$86
- HOA
- −$0
- Vacancy / Maint / Mgmt
- −$383
- Net cashflow
- $7
Break-even live
UW: 25.0% down · 7.5% · 30yr · 1.5% tax · 5.0% vac · 8.0% maint · 8.0% mgmt
Financing live
Cash to close
- Down payment
- $51,875
- Closing costs
- $6,225
- Reserves months
- —
- Total cash needed
- —
Loan-product check · same deal, 3 products live
Conventional
25% down · 7.5% · 30yr
- Down + closing
- —
- Monthly P&I
- —
- Monthly cashflow
- —
- DSCR
- —
- Eligible?
- —
Personal DTI + credit; lowest rate.
DSCR
20% down · 8.5% · 30yr
- Down + closing
- —
- Monthly P&I
- —
- Monthly cashflow
- —
- DSCR
- —
- Eligible?
- —
No personal income docs; deal must DSCR.
Hard money
10% down · 12.0% · 12mo
- Down + closing
- —
- Monthly P&I
- —
- Monthly cashflow
- —
- DSCR
- —
- Eligible?
- —
Short-term bridge; refi at stabilization.
Rent comps 6 comps
| Address | Beds | Baths | Sqft | Rent | $/sqft | DOM | Units | Dist |
|---|---|---|---|---|---|---|---|---|
| 505 1/2 S 10th St Bismarck, ND | 3.0 | 1.0 | 1500 | $1,600 | $1.07 | 21d | 1 | 0.81mi |
| 1543 S Washington St Bismarck, ND | 3.0 | 2.0 | 1500 | $2,050 | $1.37 | 21d | 1 | 0.96mi |
| 926 N Mandan St Bismarck, ND | 4.0 | 2.0 | 2032 | $2,436 | $1.20 | 21d | 1 | 0.98mi |
| 127 Stuttgart Dr Unit 1 Bismarck, ND | 2.0 | 2.0 | 1600 | $1,400 | $0.88 | 21d | 1 | 1.26mi |
| 1304 N 4th St Bismarck, ND | 4.0 | 2.0 | 1975 | $1,800 | $0.91 | 21d | 1 | 1.49mi |
| 1121 N 12th St Unit Main Bismarck, ND | 3.0 | 1.0 | 1600 | $1,500 | $0.94 | 21d | 1 | 1.50mi |
Listing history 18 events
-
2026-06-19days on market $207,500 Active 69 DOM
-
2026-06-18days on market $207,500 Active 68 DOM
-
2026-06-17days on market $207,500 Active 67 DOM
-
2026-06-16days on market $207,500 Active 66 DOM
-
2026-06-15days on market $207,500 Active 65 DOM
-
2026-06-14days on market $207,500 Active 63 DOM
-
2026-06-13days on market $207,500 Active 62 DOM
-
2026-06-10days on market $207,500 Active 60 DOM
-
2026-06-09days on market $207,500 Active 59 DOM
-
2026-06-08days on market $207,500 Active 58 DOM
-
2026-06-07days on market $207,500 Active 57 DOM
-
2026-06-05days on market $207,500 Active 54 DOM
-
2026-06-03days on market $207,500 Active 53 DOM
-
2026-06-02days on market $207,500 Active 52 DOM
-
2026-06-01days on market $207,500 Active 51 DOM
-
2026-05-31days on market $207,500 Active 50 DOM
-
2026-05-30days on market $207,500 Active 49 DOM
-
2026-04-11$207,500 Active
ⓘ Source: listings_history table (triggers on properties + properties_extension) + one-shot
backfill from property_details.listing_events for pre-trigger history.
Nearby sold comps map
Loading sold comps map…
Walkable amenities ~0.75 mi
Loading nearby amenities…
Taxation est. · year 1
- Rental income
- $21,885
- − Mortgage interest
- −$11,623
- − Property taxes
- −$3,112
- − Insurance
- −$1,038
- − Repairs & maintenance
- −$1,751
- − Management
- −$1,751
- − Depreciation
- −$6,036
- Taxable loss
- −$3,426
- Est. tax savings @ 24.0%
- +$822
- After-tax cash flow
- $903/yr
For passive investors: Depreciation is non-cash, so a rental often shows a tax loss while cash-flowing — sheltering income. Rental losses are passive: they offset passive income freely, and up to $25,000/yr can offset ordinary (W-2) income if you actively participate and your MAGI is under $100k (phasing out to $0 by $150k); unused losses carry forward. On sale, claimed depreciation is recaptured at up to 25%, and gains may owe capital-gains tax (a 1031 exchange can defer both). Figures are a year-1 estimate at your 24.0% rate — not tax advice; consult a CPA.
Condition & rehab AI · 12 photos
The home requires moderate renovations to update the kitchen and bathroom, and some exterior maintenance. Fresh paint and new countertops would significantly enhance its resale value.
Repairs flagged
- Moderate kitchen cabinets — dated and in need of updating
- Moderate bathroom fixtures — dated and in need of updating
- Minor exterior siding — some discoloration
Value-add opportunities
- Resale paint interior walls — fresh paint enhances curb appeal
- Resale replace kitchen countertops — new countertops improve functionality and aesthetics
- Resale update kitchen cabinets — new cabinets modernize the space
- Resale replace bathroom fixtures — new fixtures improve functionality and aesthetics
- Resale landscape front yard — improved landscaping enhances curb appeal
Renovation cost estimate screening
| Repair item | Severity | Est. cost |
|---|---|---|
| kitchen cabinets · dated and in need of updating | Moderate | $3,000–15,000 |
| bathroom fixtures · dated and in need of updating | Moderate | $3,000–15,000 |
| exterior siding · some discoloration | Minor | $500–3,000 |
| Total estimated repair cost · 3 items | $6,500–33,000 |
Value-add ROI direction
- Resale paint interior walls — fresh paint enhances curb appeal ↑
- Resale replace kitchen countertops — new countertops improve functionality and aesthetics ↑
- Resale update kitchen cabinets — new cabinets modernize the space ↑
- Resale replace bathroom fixtures — new fixtures improve functionality and aesthetics ↑
- Resale landscape front yard — improved landscaping enhances curb appeal ↑
ⓘ Cost ranges are severity-bucket heuristics (US national rule-of-thumb). Get contractor quotes + a written scope before underwriting a rehab budget.
Schools (NCES district)
- District
- Bismarck 1
- NCES district ID
- 3800014
- Math proficiency
- 41% ▼ -5.00%
- Reading proficiency
- 42% ▼ -6.00%
- Median HH income
- $60,649
- Composite
- 36.76/100
- National rank
- #4577
- State rank
- #25 of 53 in ND
Livability — Bismarck
- Score
- 79/100
- State rank
- #5
- US rank
- #2213
Category grades
Schools grade is shown separately in the Schools card above.
Census & demographics
- Census place
- Bismarck, ND
- County
- Burleigh County · 97,300 people
- City population
- 97,300
- Metro
- Bismarck, ND
- Population (ZIP)
- 30,212
- Household income
- $85,637
- Rent vs Own
- Severe rent burden
- 400.0
Population outlook (Burleigh County) Hauer SSP2
- Today (2025)
- 119,359 people
- By 2030
- 133,047 · +11.5%
- By 2040
- 161,545 · +35.3%
- By 2050
- 191,960 · +60.8%
- By 2075
- 274,569 · +130.0%
- By 2100
- 350,910 · +194.0%
Race, ethnicity, and origin ACS 2023
- Neighborhood character
- Predominantly White (84%)
- Race & ethnicity
- White 84% Native American 8% Two or more races 5% Hispanic / Latino 4%
- Common ancestry
- Portuguese 13% Scotch-Irish 5% Romanian 2%
- Foreign-born
- 2% · Canada
- Languages at home
- 97% English-only · Spanish 2%
Political lean MEDSL · Burleigh
- 2024 margin
- Solid R (+43.2) · D 27.5% · R 70.7% · Other 1.8%
- 2008→2024 swing
- -19.7pp toward R · 2008: -23.6pp · 2024: -43.2pp
- All cycles
- 2024: R+43.2 2020: R+40.2 2016: R+46.1 2012: R+32.1 2008: R+23.6
Not yet ingested
- Civics
- —
Market trends
- HPI YoY
- ▼ -158.70%
- Current HPI
- 210.0651
- Rent YoY
- ▲ 2.81%
- Metro
- Bismarck, ND
- State GDP YoY
- ▲ 2.09%
- F500 in state
- 2
Industry mix (Fortune 500 HQ in ND)
| Industry | F500 HQs | Revenue |
|---|---|---|
| Utilities / Construction | 1 | $6B |
|
||
Price history
1 event — show timeline
- 2026-04-11 Listed $207,500 GNMLS
Cash-flow waterfall
monthlySold comps — $/sqft
last 12 mo · ≤1 miLoading sold comps…