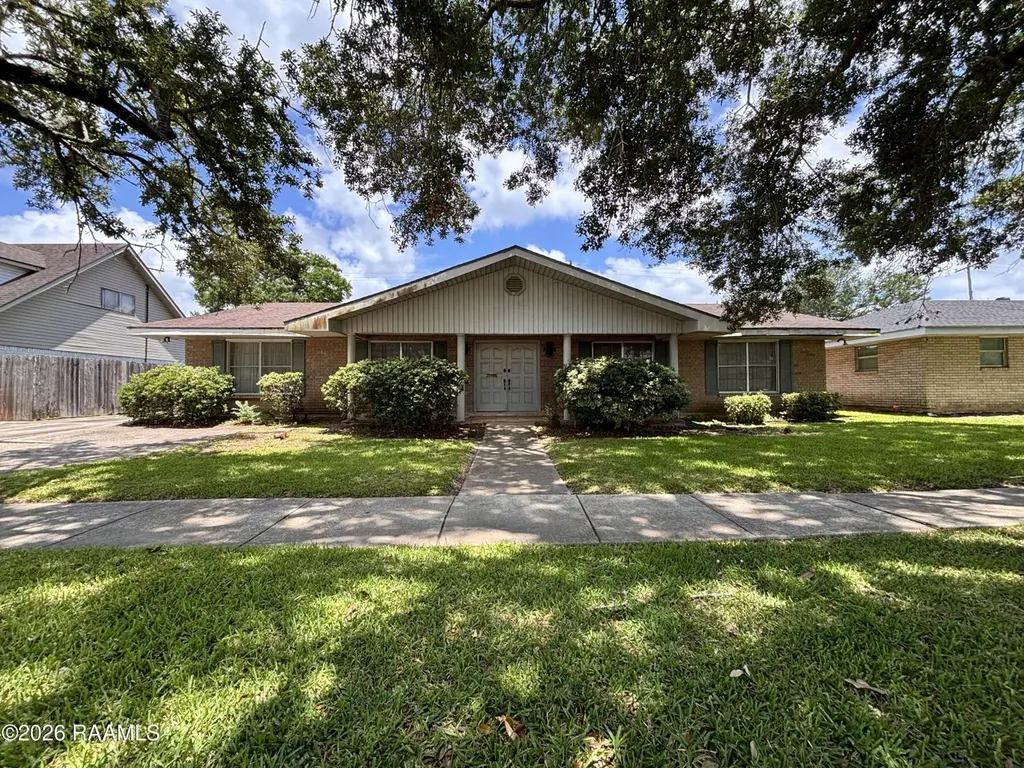
1412 Walnut Dr · Morgan City, LA
Flood risk 7/10 · Major
- FEMA flood zone
- X (shaded)
- Chance of flooding over 30 yrs
- 0.92%
- Est. flood insurance / yr
- $507 – $1,088
Fire risk 1/10 · Minimal
- Est. fire insurance / yr
- $1,269 – $2,357
Heat risk 9/10 · Severe
- Hot days now (above 106°F)
- 7 days/yr
- Hot days in 30 yrs
- 23 days/yr
Wind risk 9/10 · Severe
- Chance of severe wind over 30 yrs
- 99.0%
Air-quality risk 1/10 · Minimal
- Unhealthy air days now
- 0 days/yr
- Unhealthy air days in 30 yrs
- 0 days/yr
Risk factors via First Street. Map © Google.
Why this score? — see what drove the D+ grade
The composite is a weighted blend of 9 inputs, each scored 0–100. Each bar is that input's sub-score; the figure is the points it added to the 100-point composite (weight × sub-score).
- Cash flow +18.2/30.0
- ARV discount +7.5/15.0
- DSCR +5.7/10.0
- 1% rule +4.2/10.0
- Livability +3.4/5.0
- Schools +2.8/10.0
- Rent growth +2.5/5.0
- Condition / age +2.5/5.0
- Appreciation +0.0/10.0
$145,000
🖨 Deal sheet (PDF) 📄 Offer letter ✓ Due diligence
Listing remarks
Waterfront Living Awaits! This 4BR/2.5BA home boasts 2688 sq ft of living space on a generous 80 x 110 lot. Featuring a desirable split floor plan, the 4th bedroom offers flexible space for an office or game room. Enjoy breathtaking water views from the sunroom or step onto the expansive deck for outdoor entertaining. The kitchen and dining areas are brightened by skylights, complementing the stylish granite countertops. A cozy fireplace adds warmth to the living area. The property includes a carport, a convenient cement patio, a boat lift, and a garage. All appliances stay. Quotes on roof and electrical available upon request. Cash or conventional loans only. Selling AS IS with no repairs.
Key facts
- Water views
- Split floor plan
- Sunroom
Tags
Property features AI
Exterior
- Parking: Total 3 parking spaces; 2-car garage (garage faces rear); 1-car carport; Open parking; 3 covered parking spaces
- Utilities: City gas; Public sewer; City electric
- Home design: Single family residence; Listed as fixer; City street frontage on a paved road
- Construction: Brick veneer and frame construction
- Exterior features: Brick veneer and frame exterior; Open and covered patios/porches; RV/boat storage; Waterfront
Interior
- Kitchen: Granite counters; Dishwasher; Disposal; Microwave; Refrigerator
- Bathrooms: 2 full bathrooms; 1 half bathroom
- Heating & cooling: Central heat; Central air conditioning
- Interior features: Granite counters; Dishwasher; Disposal; Microwave; Refrigerator
Neighborhood map
What this means for you Summary
Snapshot
- This is a 3-bed/2.5-bath single-family listed at $145k.
Deal economics
- At list price, monthly cash flow is $63 ($753/yr) — positive.
- The deal already cash-flows at list — no discount required.
- To meet the 1% rule (rent ≥ 1% of price), the offer needs to be $134k (7.6% below list).
- Recommended offer: $134k (7.6% below list) — sets the bar for 1% rule.
- Cap rate 7.4% vs local median 4.6% in Morgan City — top-decile yield for the area; either an underpriced asset or a hidden risk that comps aren't pricing in. Stress-test before assuming the spread holds.
Location & tenants
- Location reads 67/100 on livability (#111 in LA) — a middle-class / working-renter tenant base. Strengths: cost of living A+, health & safety A+, housing A-; Watch: crime F, amenities F, commute F.
- St. Mary Parish (town): math 28% / reading 39% proficiency, ranked #37 of 98 in LA (top 38%) — families likely to look elsewhere, expect single-tenant / working-renter base with shorter leases; 68% free/reduced lunch — lower-income household profile, screen leases tightly.
- Zoned schools: Wyandotte Elementary School (math 37% / reading 47%, grade F, #201 of 646 statewide, top 33%, 346 students, 68% FRL); Morgan City Junior High School (math 22% / reading 34%, grade F, #125 of 218 statewide, top 58%, 488 students, 56% FRL); Morgan City High School (math 27% / reading 42%, grade F, #106 of 265 statewide, top 43%, 732 students, 55% FRL).
- Market conditions: 83 active listings in the ZIP; 37 units permitted in St. Mary Parish in 2024 (20 in 5+ unit buildings).
Forward outlook
- Local home prices are declining (-3.0%/yr); year-one equity from $1k of loan paydown is wiped out by about $4k of value loss. Plan a longer hold.
- St. Mary County population projected at -18% by 2050 — secular population decline; favor cash flow + early exit over multi-decade hold.
Negotiation context
- Only 5 days on market — expect competitive offers; lowballing is unlikely to land.
Risks & watch-outs
- Watch-outs: flood insurance adds $66/mo.
- Climate carrying-cost: major flood risk; severe wind risk, 99% chance of damaging wind over 30y; extreme-heat days projected 7→23/yr by 2055 (HVAC capex compounding) — expect insurance premiums to compound above CPI over the hold.
Questions for the listing agent
- Built in 1968 — when were the roof, HVAC, electrical panel, plumbing, and water heater last replaced?
- What's the actual annual flood-insurance premium (NFIP or private), and is the property in a SFHA with mandatory coverage?
- Is there a deadline driving the sale (1031 exchange, divorce, estate, relocation)? That informs how much negotiation room exists.
- Schools are B-rated — typically a magnet for longer-tenancy family renters. What's the average tenant stay here, and is there a school-zone premium baked into asking?
- Crime grade is F in this area — have there been break-ins, vandalism, or insurance claims at this property in the last 3 years? What carrier currently insures it and at what premium?
- The area grade is low — what's the realistic commute time and amenity access for the typical tenant pool here? Any planned neighborhood developments (good or bad) we should know about?
- What's the average days-on-market for RENTAL listings here right now (not sales)? A rising rental-DOM trend means longer vacancies and softer asking-rent achievability than the comps imply.
- What's the recent tenant-quality profile in this submarket — average credit score on applications, eviction rate, late-payment / NSF rate, and stable-employment percentage? A property-management company in the area should have these aggregated.
- How much new for-sale + rental construction is in the pipeline within 1–3 miles? Heavy new supply typically softens prices + rents 12–24 months out; constrained supply supports both.
Investment metrics
- 1% rule
- 0.92% ✗
- Cap rate
- 7.36%
- Cash-on-cash
- 3.82%
- DSCR
- 1.17
- GRM
- 9.0
CMA / ARV
- ARV (on-the-fly)
- $360,584
- Comps found
- 2
Show comp detail 2 sales within ~0.75 mi
| Address | Dist | Beds/Ba | Sqft | Sold | Price | $/sf | Match |
|---|---|---|---|---|---|---|---|
| 1300 Walnut Dr | 0.11mi | 3/2.0 | 2,341 (-11%) | 5mo | $320,000 | $137 | 70 |
| 1624 Ridgeway Dr | 0.27mi | 3/2.0 | 2,327 (-12%) | 18mo | $312,000 | $134 | 51 |
Match score weights: distance 35% · size 25% · config 20% · recency 20%. Top-matched comps best support the ARV.
Projected returns pro-forma
-3.0% appreciation · 3.0% rent growth · sell at horizon
- IRR
- -13.3%
- Equity multiple
- 0.52×
- Total profit
- $-19,483
- Equity at exit
- $21,620
- IRR
- -4.4%
- Equity multiple
- 0.71×
- Total profit
- $-11,752
- Equity at exit
- $12,537
Cash invested: $40,600 (down + closing). Projections, not guarantees.
Landlord ↔ Tenant lean methodology
- Overall (STATE)
- 90 Strongly Landlord-Friendly
- State Louisiana
- 90 Strongly Landlord-Friendly · R+12
- County
- — inherits STATE
- City
- — inherits STATE
ZIP-level market 70380
- Home prices YoY
- -34.8%
- Active inventory
- 83
- Price-to-rent
- 9.0×
Monthly cashflow live
- Estimated rent
- $1,340 medium interval (Pro) →
- Mortgage (P&I)
- −$760
- Tax from tax record
- −$108 /mo · $1,301/yr
- Insurance
- −$60
- Flood insurance flood zone
- −$66 /mo · $798/yr
- HOA
- −$0
- Vacancy / Maint / Mgmt
- −$281
- Net cashflow
- $63
Break-even live
Sensitivity live
| Price | -10% $145 | -5% $104 | +0% $63 | +5% $22 | +10% $-19 |
|---|---|---|---|---|---|
| Rent | -10% $-43 | -5% $10 | +0% $63 | +5% $116 | +10% $169 |
| Rate | -1.0pp $136 | -0.5pp $100 | base $63 | +0.5pp $25 | +1.0pp $-13 |
UW: 25.0% down · 7.5% · 30yr · 1.5% tax · 5.0% vac · 8.0% maint · 8.0% mgmt
Financing live
Cash to close
- Down payment
- $36,250
- Closing costs
- $4,350
- Reserves months
- —
- Total cash needed
- —
Loan-product check · same deal, 3 products live
Conventional
25% down · 7.5% · 30yr
- Down + closing
- —
- Monthly P&I
- —
- Monthly cashflow
- —
- DSCR
- —
- Eligible?
- —
Personal DTI + credit; lowest rate.
DSCR
20% down · 8.5% · 30yr
- Down + closing
- —
- Monthly P&I
- —
- Monthly cashflow
- —
- DSCR
- —
- Eligible?
- —
No personal income docs; deal must DSCR.
Hard money
10% down · 12.0% · 12mo
- Down + closing
- —
- Monthly P&I
- —
- Monthly cashflow
- —
- DSCR
- —
- Eligible?
- —
Short-term bridge; refi at stabilization.
Listing history 5 events
-
2026-06-02status $145,000 Pending 5 DOM
-
2026-06-01days on market $145,000 Active 5 DOM
-
2026-05-31days on market $145,000 Active 4 DOM
-
2026-05-31days on market $145,000 Active 3 DOM
-
2026-05-27$145,000 Active
ⓘ Source: listings_history table (triggers on properties + properties_extension) + one-shot
backfill from property_details.listing_events for pre-trigger history.
Tax reassessment forecast LA · Resets to sale price
- Current annual tax
- $1,301 · $108/mo
- Projected year-2 tax
- $1,301 · $108/mo
- Expected delta
- $0/yr ($0/mo · 0.0%)
ⓘ Screening estimate from a state-policy table — verify with the county assessor before closing.
Climate risk First Street
- Flood 7/10 Severe FEMA zone X (shaded) · 92% chance over 30 yrs
- Wildfire 1/10 Low
- Heat 9/10 Extreme 7 d/yr ≥106°F today · 23 d/yr by 30 yrs out
- Wind 9/10 Extreme 99% chance of damaging wind over 30 yrs
- Air quality 1/10 Low 0 unhealthy d/yr today · 0 by 30 yrs out
Nearby sold comps map
Loading sold comps map…
Walkable amenities ~0.75 mi
Loading nearby amenities…
Taxation est. · year 1
- Rental income
- $16,078
- − Mortgage interest
- −$8,122
- − Property taxes
- −$1,301
- − Insurance
- −$1,522
- − Repairs & maintenance
- −$1,286
- − Management
- −$1,286
- − Depreciation
- −$4,218
- Taxable loss
- −$1,659
- Est. tax savings @ 24.0%
- +$398
- After-tax cash flow
- $1,151/yr
For passive investors: Depreciation is non-cash, so a rental often shows a tax loss while cash-flowing — sheltering income. Rental losses are passive: they offset passive income freely, and up to $25,000/yr can offset ordinary (W-2) income if you actively participate and your MAGI is under $100k (phasing out to $0 by $150k); unused losses carry forward. On sale, claimed depreciation is recaptured at up to 25%, and gains may owe capital-gains tax (a 1031 exchange can defer both). Figures are a year-1 estimate at your 24.0% rate — not tax advice; consult a CPA.
Schools (NCES district)
- District
- St. Mary Parish
- NCES district ID
- 2201620
- Math proficiency
- 28% ▼ -40.00%
- Reading proficiency
- 39% ▼ -33.00%
- Median HH income
- $39,843
- Composite
- 28.1/100
- National rank
- #6828
- State rank
- #37 of 98 in LA
Livability — Morgan City
- Score
- 67/100
- State rank
- #111
- US rank
- #11015
Category grades
Schools grade is shown separately in the Schools card above.
Census & demographics
- Census place
- Morgan City, LA
- Population (ZIP)
- 21,043
Population outlook (St. Mary County) Hauer SSP2
- Today (2025)
- 49,510 people
- By 2030
- 47,570 · -3.9%
- By 2040
- 43,880 · -11.4%
- By 2050
- 40,655 · -17.9%
- By 2075
- 37,190 · -24.9%
- By 2100
- 38,101 · -23.0%
Race, ethnicity, and origin ACS 2023
- Neighborhood character
- Predominantly White (65%)
- Race & ethnicity
- White 65% Hispanic / Latino 15% Black 12% Two or more races 9% Asian 3%
- Hispanic origin (detail)
- Mexican 7%
- Common ancestry
- Lithuanian 14%
- Foreign-born
- 9% · Canada, Vietnam
- Languages at home
- 84% English-only · Spanish 11% French/Haitian/Cajun 2% Vietnamese 2%
Political lean MEDSL · St. Mary
- 2024 margin
- Solid R (+31.9) · D 33.5% · R 65.4% · Other 1.0%
- 2008→2024 swing
- -15.1pp toward R · 2008: -16.8pp · 2024: -31.9pp
- All cycles
- 2024: R+31.9 2020: R+29.1 2016: R+27.6 2012: R+18.8 2008: R+16.8
Not yet ingested
- Civics
- —
Market trends
- HPI YoY
- ▼ -53.21%
- Current HPI
- 99.8137
- Rent YoY
- —
- Metro
- —
- State GDP YoY
- ▲ 3.29%
- F500 in state
- 10
Industry mix (Fortune 500 HQ in LA)
| Industry | F500 HQs | Revenue |
|---|---|---|
| Telecommunications | 2 | $23B |
|
||
| Utilities | 1 | $12B |
|
||
| Wholesale / Distribution | 1 | $5B |
|
||
| Advertising | 1 | $2B |
|
||
Price history
1 event — show timeline
- 2026-05-27 Listed $145,000 AcadianaMLS
Property tax history
+1.1%/yrLatest (2025): $1,301 · +9.3% YoY. Source: county tax records.
Cash-flow waterfall
monthlySold comps — $/sqft
last 12 mo · ≤1 miLoading sold comps…