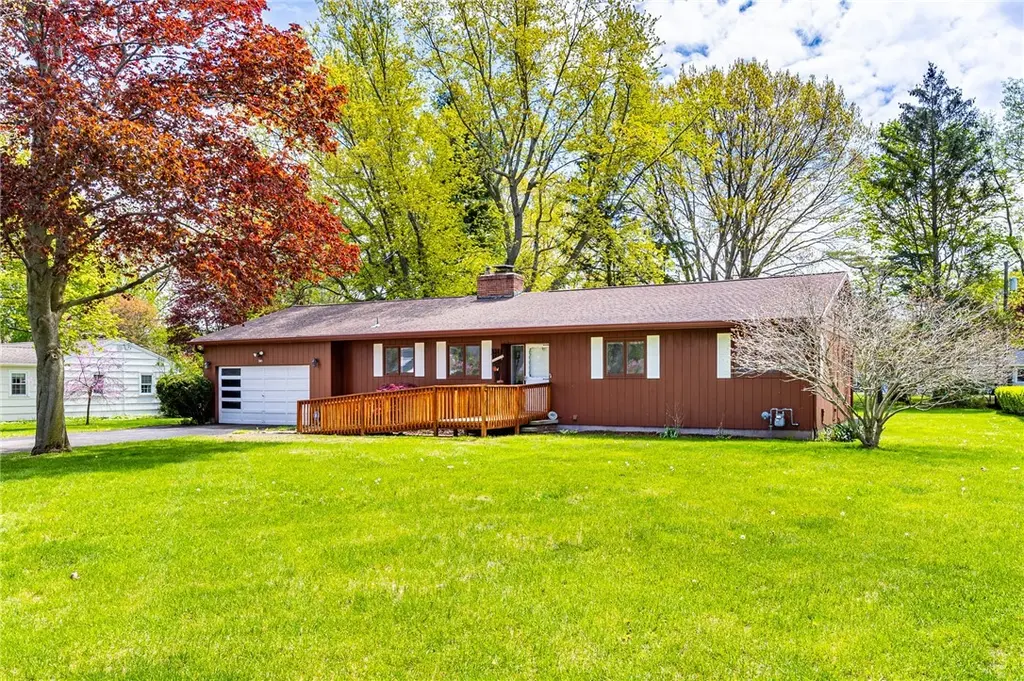
241 Shorewood Dr · Irondequoit, NY
Flood risk 1/10 · Minimal
- FEMA flood zone
- X (unshaded)
- Chance of flooding over 30 yrs
- 0.0%
- Est. flood insurance / yr
- $473 – $860
Fire risk 2/10 · Minimal
- Est. fire insurance / yr
- $691 – $1,283
Heat risk 2/10 · Minimal
- Hot days now (above 96°F)
- 7 days/yr
- Hot days in 30 yrs
- 17 days/yr
Wind risk 1/10 · Minimal
- Chance of severe wind over 30 yrs
- 0.0%
Air-quality risk 2/10 · Minimal
- Unhealthy air days now
- 1 days/yr
- Unhealthy air days in 30 yrs
- 2 days/yr
Risk factors via First Street. Map © Google.
Why this score? — see what drove the C- grade
The composite is a weighted blend of 9 inputs, each scored 0–100. Each bar is that input's sub-score; the figure is the points it added to the 100-point composite (weight × sub-score).
- ARV discount +15.0/15.0
- Cash flow +12.3/30.0
- Schools +5.5/10.0
- 1% rule +4.2/10.0
- Livability +4.0/5.0
- DSCR +3.6/10.0
- Rent growth +3.1/5.0
- Condition / age +2.5/5.0
- Appreciation +0.0/10.0
$249,900
🖨 Deal sheet 📄 Offer letter ✓ Due diligence
Listing remarks
Nestled in one of Webster’s most desirable and secluded neighborhoods, this spacious 3-bedroom, 2-bath, 2 car garage, Ranch offers the perfect blend of comfort, privacy, and location. Just minutes from the bay and lake, this well-maintained home features large windows that fill the interior with natural light and showcase the serene rear yard setting. Enjoy relaxing mornings on the rear porch. Large walkout basement offers endless possibilities for additional living space, while the peaceful surroundings create a true retreat-like atmosphere. Delayed negotiations begin Thursday, May 21, 2026 at 9:00 AM.
Key facts
- Walkout basement
- Natural light
- Rear porch
Tags
Property features AI
Exterior
- Parking: Attached garage with 2 spaces; Driveway; Garage door opener
- Utilities: Public water (connected); Septic tank sewer; Circuit breaker electrical
- Home design: Single-story home; Existing construction
- Construction: Wood siding; Copper plumbing; Asphalt roof; Block foundation; Built (existing)
- Exterior features: Blacktop driveway; Enclosed porch; Open porch; Rectangular residential lot (approx. 0.51 acre, 120x185); City street frontage
Interior
- Kitchen: Dishwasher; Electric cooktop; Electric oven; Electric range; Range hood; Exhaust fan; Refrigerator; Eat-in kitchen
- Bedrooms: 3 main-level bedrooms
- Flooring: Hardwood; Laminate; Varies
- Bathrooms: 2 full bathrooms (both on main level)
- Heating & cooling: Gas heating; Central air conditioning
- Interior features: Ceiling fan(s); Eat-in kitchen; Primary bedroom with private bath; Main-level primary suite; Sunroom / Florida room; Family room
- Laundry & utility: Washer and dryer; Laundry located in basement; Gas water heater
Neighborhood map
What this means for you Summary
Snapshot
- This is a 3-bed/2.0-bath single-family listed at $250k.
Deal economics
- At list price, monthly cash flow is $-47 ($-558/yr) — negative.
- To cash-flow at today's rent, offer at most $242k (3.3% below list).
- To meet the 1% rule (rent ≥ 1% of price), the offer needs to be $229k (8.4% below list).
- Recommended offer: $229k (8.4% below list) — sets the bar for 1% rule.
- Cap rate 6.1% vs local median 4.5% in Irondequoit — top-decile yield for the area; either an underpriced asset or a hidden risk that comps aren't pricing in. Stress-test before assuming the spread holds.
Location & tenants
- Location reads 81/100 on livability (#92 in NY, #1,414 nationally) — a professional / high-income tenant draw. Strengths: housing A+, health & safety A+, crime B+; Watch: amenities F.
- Webster Central School District (suburban): math 62% / reading 63% proficiency, ranked #184 of 590 in NY (top 31%) — acceptable for families but not a draw, mixed tenant base, ~2y average lease; only 12% free/reduced lunch — higher-income household profile.
- Market conditions: Rents rising (+2.4%/yr); 243 active listings in the ZIP; solid renter incomes; 1,169 units permitted in Monroe County in 2024 (591 in 5+ unit buildings).
Forward outlook
- Local home prices are declining (-3.0%/yr); year-one equity from $2k of loan paydown is wiped out by about $7k of value loss. Plan a longer hold.
- Monroe County population projected to shrink 6% by 2050 — rents likely to lag national; underwrite the cash flow, not the appreciation.
Negotiation context
- Only 8 days on market — expect competitive offers; lowballing is unlikely to land.
- Current owner paid $136k; list at $250k implies a 84% gain — meaningful room to come down on a strong offer.
Risks & watch-outs
- Watch-outs: built in 1957 — expect roof / HVAC / electrical / plumbing capex.
Questions for the listing agent
- What do current leases actually rent for vs. the listed asking? Can we see a recent rent roll and the last 12 months of T-12 income?
- Built in 1957 — when were the roof, HVAC, electrical panel, plumbing, and water heater last replaced?
- Is there a deadline driving the sale (1031 exchange, divorce, estate, relocation)? That informs how much negotiation room exists.
- Schools are B-rated — typically a magnet for longer-tenancy family renters. What's the average tenant stay here, and is there a school-zone premium baked into asking?
- What's the average days-on-market for RENTAL listings here right now (not sales)? A rising rental-DOM trend means longer vacancies and softer asking-rent achievability than the comps imply.
- What's the recent tenant-quality profile in this submarket — average credit score on applications, eviction rate, late-payment / NSF rate, and stable-employment percentage? A property-management company in the area should have these aggregated.
- How much new for-sale + rental construction is in the pipeline within 1–3 miles? Heavy new supply typically softens prices + rents 12–24 months out; constrained supply supports both.
Investment metrics
- 1% rule
- 0.92% ✗
- Cap rate
- 6.07%
- Cash-on-cash
- -0.80%
- DSCR
- 0.96
- GRM
- 9.1
CMA / ARV
- ARV (median comp)
- $323,230
- List price
- $249,900
- Delta
- -22.69%
- Verdict
- UNDERPRICED
- Comps
- 20 within 1.0 mi
Show comp detail 12 sales within ~0.75 mi
| Address | Dist | Beds/Ba | Sqft | Sold | Price | $/sf | Match |
|---|---|---|---|---|---|---|---|
| 731 Dewitt Rd | 0.41mi | 3/1.0 | 1,454 (+2%) | 1mo | $325,000 | $224 | 71 |
| 473 Weidel Rd | 0.53mi | 3/2.0 | 1,402 (-1%) | 17mo | $253,000 | $180 | 59 |
| 518 Apple Orchard Ln | 0.74mi | 3/2.0 | 1,429 (+1%) | 14mo | $307,500 | $215 | 53 |
| 246 Dickinson Rd | 0.40mi | 2/1.5 (-1) | 1,494 (+5%) | 17mo | $339,900 | $228 | 51 |
| 465 Backus Rd | 0.49mi | 4/1.5 (+1) | 1,518 (+7%) | 11mo | $280,000 | $184 | 49 |
| 260 Lake Rd | 0.44mi | 3/2.5 | 1,625 (+15%) | 6mo | $376,000 | $231 | 48 |
| 649 Contempri Way | 0.56mi | 3/2.0 | 1,596 (+13%) | 14mo | $345,000 | $216 | 42 |
| 469 Covewood Blvd | 0.64mi | 3/2.0 | 1,237 (-13%) | 9mo | $250,000 | $202 | 41 |
| 588 Adams Rd | 0.68mi | 4/2.0 (+1) | 1,543 (+9%) | 12mo | $312,600 | $203 | 38 |
| 511 Glenview Ct | 0.69mi | 4/1.0 (+1) | 1,528 (+8%) | 14mo | $260,000 | $170 | 35 |
| 480 Covewood Blvd Blvd | 0.72mi | 3/1.0 | 1,207 (-15%) | 8mo | $293,000 | $243 | 31 |
| 441 Vosburg Rd | 0.69mi | 3/1.5 | 1,630 (+15%) | 14mo | $300,000 | $184 | 29 |
Match score weights: distance 35% · size 25% · config 20% · recency 20%. Top-matched comps best support the ARV.
Projected returns pro-forma
-3.0% appreciation · 2.38% rent growth · sell at horizon
- IRR
- -18.3%
- Equity multiple
- 0.36×
- Total profit
- $-44,763
- Equity at exit
- $37,261
- IRR
- -11.9%
- Equity multiple
- 0.31×
- Total profit
- $-48,085
- Equity at exit
- $21,607
Cash invested: $69,972 (down + closing). Projections, not guarantees.
Landlord ↔ Tenant lean methodology
- Overall (STATE)
- 15 Strongly Tenant-Friendly
- State New York
- 15 Strongly Tenant-Friendly · D+10
- County
- — inherits STATE
- City
- — inherits STATE
ZIP-level market 14580
- Rents YoY
- 2.4%
- Active inventory
- 243
- Price-to-rent
- 9.1×
Monthly cashflow live
- Estimated rent
- $2,289 medium interval (Pro) →
- Mortgage (P&I)
- −$1,311
- Tax from tax record
- −$440 /mo · $5,279/yr
- Insurance
- −$104
- HOA
- −$0
- Vacancy / Maint / Mgmt
- −$481
- Net cashflow
- $-47
Break-even live
UW: 25.0% down · 7.5% · 30yr · 1.5% tax · 5.0% vac · 8.0% maint · 8.0% mgmt
Financing live
Cash to close
- Down payment
- $62,475
- Closing costs
- $7,497
- Reserves months
- —
- Total cash needed
- —
Loan-product check · same deal, 3 products live
Conventional
25% down · 7.5% · 30yr
- Down + closing
- —
- Monthly P&I
- —
- Monthly cashflow
- —
- DSCR
- —
- Eligible?
- —
Personal DTI + credit; lowest rate.
DSCR
20% down · 8.5% · 30yr
- Down + closing
- —
- Monthly P&I
- —
- Monthly cashflow
- —
- DSCR
- —
- Eligible?
- —
No personal income docs; deal must DSCR.
Hard money
10% down · 12.0% · 12mo
- Down + closing
- —
- Monthly P&I
- —
- Monthly cashflow
- —
- DSCR
- —
- Eligible?
- —
Short-term bridge; refi at stabilization.
Listing history 2 events
-
2026-05-13$249,900 Active 616-char remark
-
2004-10-06soldstatus $136,000
ⓘ Source: listings_history table (triggers on properties + properties_extension) + one-shot
backfill from property_details.listing_events for pre-trigger history.
Tax reassessment forecast NY · Partial reset (capped growth)
- Current annual tax
- $5,279 · $440/mo
- Projected year-2 tax
- $5,279 · $440/mo
- Expected delta
- $0/yr ($0/mo · 0.0%)
ⓘ Screening estimate from a state-policy table — verify with the county assessor before closing.
Climate risk First Street
- Flood 1/10 Low FEMA zone X (unshaded) · 0% chance over 30 yrs
- Wildfire 2/10 Low
- Heat 2/10 Low 7 d/yr ≥96°F today · 17 d/yr by 30 yrs out
- Wind 1/10 Low 0% chance of damaging wind over 30 yrs
- Air quality 2/10 Low 1 unhealthy d/yr today · 2 by 30 yrs out
Nearby sold comps map
Loading sold comps map…
Walkable amenities ~0.75 mi
Loading nearby amenities…
Taxation est. · year 1
- Rental income
- $27,464
- − Mortgage interest
- −$13,998
- − Property taxes
- −$5,279
- − Insurance
- −$1,250
- − Repairs & maintenance
- −$2,197
- − Management
- −$2,197
- − Depreciation
- −$7,270
- Taxable loss
- −$4,727
- Est. tax savings @ 24.0%
- +$1,134
- After-tax cash flow
- $576/yr
For passive investors: Depreciation is non-cash, so a rental often shows a tax loss while cash-flowing — sheltering income. Rental losses are passive: they offset passive income freely, and up to $25,000/yr can offset ordinary (W-2) income if you actively participate and your MAGI is under $100k (phasing out to $0 by $150k); unused losses carry forward. On sale, claimed depreciation is recaptured at up to 25%, and gains may owe capital-gains tax (a 1031 exchange can defer both). Figures are a year-1 estimate at your 24.0% rate — not tax advice; consult a CPA.
Schools (NCES district)
- District
- Webster Central School District
- NCES district ID
- 3630360
- Math proficiency
- 62% ▼ -3.00%
- Reading proficiency
- 63% ▲ 6.00%
- Median HH income
- $71,221
- Composite
- 55.18/100
- National rank
- #1273
- State rank
- #184 of 590 in NY
Livability — Irondequoit
- Score
- 81/100
- State rank
- #92
- US rank
- #1414
Category grades
Schools grade is shown separately in the Schools card above.
Census & demographics
- County
- Monroe County · 674,131 people
- City population
- 74,252
- Metro
- Rochester, NY
- Population (ZIP)
- 54,180
- Household income
- $98,310
- Rent vs Own
- Severe rent burden
- 1325.0
Population outlook (Monroe County) Hauer SSP2
- Today (2025)
- 759,460 people
- By 2030
- 757,154 · -0.3%
- By 2040
- 740,644 · -2.5%
- By 2050
- 714,443 · -5.9%
- By 2075
- 645,883 · -15.0%
- By 2100
- 547,084 · -28.0%
Race, ethnicity, and origin ACS 2023
- Neighborhood character
- Predominantly White (88%)
- Race & ethnicity
- White 88% Two or more races 5% Hispanic / Latino 3% Asian 3% Black 2%
- Common ancestry
- Romanian 4% Iranian 3% Subsaharan African 3%
- Foreign-born
- 8% · Canada, China
- Languages at home
- 91% English-only · Other Indo-European 3% Russian/Polish/Slavic 2% Spanish 2%
Political lean MEDSL · Monroe
- 2024 margin
- D (+19.1) · D 59.5% · R 40.5%
- 2008→2024 swing
- +1.4pp toward D · 2008: 17.7pp · 2024: 19.1pp
- All cycles
- 2024: D+19.1 2020: D+21.0 2016: D+14.1 2012: D+17.4 2008: D+17.7
Not yet ingested
- Civics
- —
Market trends
- HPI YoY
- ▼ -154.52%
- Current HPI
- 266.2145
- Rent YoY
- ▲ 2.38%
- Metro
- Rochester, NY
- State GDP YoY
- ▲ 2.60%
- F500 in state
- 92
Industry mix (Fortune 500 HQ in NY)
| Industry | F500 HQs | Revenue |
|---|---|---|
| Financial Services | 10 | $950B |
|
||
| Consumer Goods | 9 | $162B |
|
||
| Insurance | 4 | $225B |
|
||
| Telecommunications | 2 | $144B |
|
||
| Pharmaceuticals | 2 | $112B |
|
||
| Media / Entertainment | 2 | $69B |
|
||
Price history
+83.8% since first listed3 events — show timeline
- 2026-05-21 Pending — UNYREIS
- 2026-05-13 Listed $249,900 UNYREIS
- 2004-10-06 Sold (Public Records) $136,000 Public Records
Property tax history
+4.5%/yrLatest (2025): $5,279 · +37.5% YoY. Source: county tax records.
Cash-flow waterfall
monthlySold comps — $/sqft
last 12 mo · ≤1 miLoading sold comps…