 Triplex
39 Shepard St · New Haven, CT
Flood risk 3/10 · Minor
- FEMA flood zone
- X (unshaded)
- Chance of flooding over 30 yrs
- 0.2%
- Est. flood insurance / yr
- $473 – $860
Fire risk 1/10 · Minimal
- Est. fire insurance / yr
- $829 – $1,539
Heat risk 6/10 · Moderate
- Hot days now (above 99°F)
- 7 days/yr
- Hot days in 30 yrs
- 16 days/yr
Wind risk 6/10 · Moderate
- Chance of severe wind over 30 yrs
- 53.0%
Air-quality risk 5/10 · Moderate
- Unhealthy air days now
- 6 days/yr
- Unhealthy air days in 30 yrs
- 8 days/yr
Risk factors via First Street. Map © Google.
Why this score? — see what drove the C- grade
The composite is a weighted blend of 9 inputs, each scored 0–100. Each bar is that input's sub-score; the figure is the points it added to the 100-point composite (weight × sub-score).
- Cash flow +26.3/30.0
- DSCR +8.9/10.0
- 1% rule +6.7/10.0
- Livability +4.0/5.0
- Rent growth +3.2/5.0
- Condition / age +2.5/5.0
- Schools +1.5/10.0
- ARV discount +0.0/15.0
- Appreciation +0.0/10.0
$499,900
🖨 Deal sheet 📄 Offer letter ✓ Due diligence
Multi-family units
County records classify this as Multi-Family (2-4 Unit). Listing-text estimate: 3 units. confirmed
Listing remarks MLS
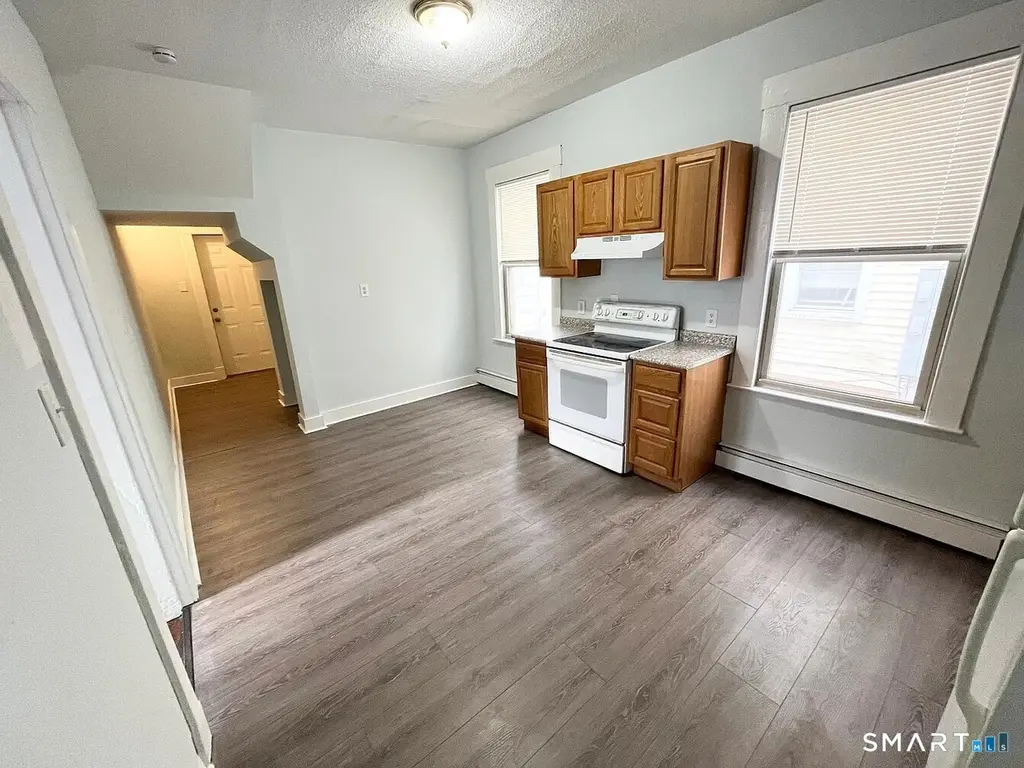
Occupied 3 family in good condition with hard wood floors. Close to Yale, Albertus & Southern, homeowner real estate agent
Key facts
- 3,920 sq ft lot
- Built 1910
- Listed 41 days
Property features AI
Exterior
- Utilities: Public water connected; Public sewer connected; Hot water: Other
- Home design: Multi-family property (3-family)
- Construction: Frame construction; Concrete foundation; Asphalt shingle roof
- Exterior features: Level lot; Vinyl siding
Interior
- Bedrooms: 6 bedrooms
- Bathrooms: 3 full bathrooms
- Heating & cooling: Gas heating
- Interior features: 12 total rooms; Full basement
Neighborhood map
What this means for you Summary
Snapshot
- This is a 3 × 2-bed/1.0-bath units multifamily listed at $500k.
Deal economics
- At list price, monthly cash flow is $1k ($15k/yr) — positive. Per door: $429/mo.
- The deal already cash-flows at list — no discount required.
- Meets the 1% rule at list price ($6k rent vs $500k).
- Recommended offer: $485k (3.0% below list) — sets the bar for market timing.
- Cap rate 9.4% vs local median 4.8% in New Haven — top-decile yield for the area; either an underpriced asset or a hidden risk that comps aren't pricing in. Stress-test before assuming the spread holds.
Location & tenants
- Location reads 79/100 on livability (#31 in CT, #2,190 nationally) — a middle-class / working-renter tenant base. Strengths: amenities A+, commute A+, health & safety A+; Watch: schools D+, employment D, crime F.
- New Haven School District (urban): math 12% / reading 25% proficiency, ranked #147 of 153 in CT (top 96%) — low school quality limits family demand, transient renter base, plan for 1-2y turnover; 66% free/reduced lunch — lower-income household profile, screen leases tightly.
- Market conditions: Rents rising (+2.6%/yr); 137 active listings in the ZIP; 39 comparable units currently listed for rent nearby; rentals lingering (median 44d on market — plan ~5-8 weeks vacancy on turnover, expect pricing pressure); 54% of comp listings sitting > 30 days — soft ceiling on asking rent; 1,059 units permitted in South Central Connecticut Planning Region in 2024 (779 in 5+ unit buildings).
- At $5,842/mo this rent would consume 117% of the median local household income ($60k/yr) (locally 4999% of renters already pay >50% of income on rent) — very limited rent-growth headroom before tenants either downsize or default.
Forward outlook
- Local home prices are declining (-3.0%/yr); year-one equity from $3k of loan paydown is wiped out by about $15k of value loss. Plan a longer hold.
Negotiation context
- It's been on market 41 days — a 3% lower offer ($485k) is reasonable based on typical stale-listing flexibility.
- 8 sale attempts since 15y ago with the ask held roughly flat each time — persistent listings suggest the price (not the market) is what's stuck; bring a comps-based counter.
- Current owner paid $174k; list at $500k implies a 188% gain — meaningful room to come down on a strong offer.
Risks & watch-outs
- Watch-outs: built in 1910 — expect roof / HVAC / electrical / plumbing capex.
- Climate carrying-cost: major wind risk, 53% chance of damaging wind over 30y; extreme-heat days projected 7→16/yr by 2055 (HVAC capex compounding) — expect insurance premiums to compound above CPI over the hold.
Questions for the listing agent
- It's been on market 41 days. Have you received any prior offers? Is the seller open to a 3% concession, seller financing, or rate buy-down credit?
- Can we see the unit-by-unit rent roll, current vacancy, and any below-market leases? What's the average tenancy length?
- What capital expenditures (roof, boiler, parking lot, exteriors) have been made in the last 5 years, and what's planned in the next 2?
- Built in 1910 — when were the roof, HVAC, electrical panel, plumbing, and water heater last replaced?
- Is there a deadline driving the sale (1031 exchange, divorce, estate, relocation)? That informs how much negotiation room exists.
- Schools are D-rated, which usually means shorter tenancies and higher turnover. Who's the typical renter profile here, and what's been the actual vacancy rate?
- Crime grade is F in this area — have there been break-ins, vandalism, or insurance claims at this property in the last 3 years? What carrier currently insures it and at what premium?
- What's the average days-on-market for RENTAL listings here right now (not sales)? A rising rental-DOM trend means longer vacancies and softer asking-rent achievability than the comps imply.
- What's the recent tenant-quality profile in this submarket — average credit score on applications, eviction rate, late-payment / NSF rate, and stable-employment percentage? A property-management company in the area should have these aggregated.
- How much new apartment / multifamily construction is in the pipeline within 1–3 miles? Heavy new supply (>2% of stock underway) typically softens rents 12–24 months out; light construction supports rent growth.
Investment metrics
- 1% rule
- 1.17% ✓
- Cap rate
- 9.38%
- Cash-on-cash
- 11.04%
- DSCR
- 1.49
- GRM
- 7.1
CMA / ARV
- ARV (median comp)
- $422,450
- List price
- $499,900
- Delta
- 18.33%
- Verdict
- OVERPRICED
- Comps
- 20 within 1.0 mi
Show comp detail 4 sales within ~0.75 mi
| Address | Dist | Beds/Ba | Sqft | Sold | Price | $/sf | Match |
|---|---|---|---|---|---|---|---|
| 245 Goodrich St | 0.20mi | 4/4.0 (+1) | 2,880 (+9%) | 6mo | $420,000 | $146 | 62 |
| 272 Bassett St | 0.42mi | 4/2.0 (+1) | 2,854 (+8%) | 10mo | $265,000 | $93 | 50 |
| 25 Lander St | 0.18mi | 4/2.0 (+1) | 2,365 (-11%) | 21mo | $350,000 | $148 | 47 |
| 374 Shelton Ave | 0.15mi | 4/2.0 (+1) | 3,021 (+14%) | 19mo | $370,000 | $122 | 45 |
Match score weights: distance 35% · size 25% · config 20% · recency 20%. Top-matched comps best support the ARV.
Projected returns pro-forma
-3.0% appreciation · 2.6% rent growth · sell at horizon
- IRR
- -0.3%
- Equity multiple
- 0.99×
- Total profit
- $-1,345
- Equity at exit
- $74,537
- IRR
- 9.0%
- Equity multiple
- 1.68×
- Total profit
- $94,916
- Equity at exit
- $43,222
Cash invested: $139,972 (down + closing). Projections, not guarantees.
Landlord ↔ Tenant lean methodology
- Overall (STATE)
- 27 Tenant-Leaning
- State Connecticut
- 27 Tenant-Leaning · D+7
- County
- — inherits STATE
- City
- — inherits STATE
ZIP-level market 06511
- Home prices YoY
- -20.8%
- Rents YoY
- 2.6%
- Active inventory
- 137
- Price-to-rent
- 21.4×
Monthly cashflow live
- Estimated rent
- $5,842 high interval (Pro) →
- Mortgage (P&I)
- −$2,622
- Tax from tax record
- −$498 /mo · $5,976/yr
- Insurance
- −$208
- HOA
- −$0
- Vacancy / Maint / Mgmt
- −$1,227
- Net cashflow
- $1,287
Break-even live
3-unit breakdown (identical units grouped — click to expand)
| Units | Beds | Baths | Est. rent |
|---|---|---|---|
| 3× units | 2 | 1 | $5,841 |
| #1 | 2 | 1 | $1,947 |
| #2 | 2 | 1 | $1,947 |
| #3 | 2 | 1 | $1,947 |
| Total (3 units) | $5,842 | ||
UW: 25.0% down · 7.5% · 30yr · 1.5% tax · 5.0% vac · 8.0% maint · 8.0% mgmt
Financing live
Cash to close
- Down payment
- $124,975
- Closing costs
- $14,997
- Reserves months
- —
- Total cash needed
- —
Loan-product check · same deal, 3 products live
Conventional
25% down · 7.5% · 30yr
- Down + closing
- —
- Monthly P&I
- —
- Monthly cashflow
- —
- DSCR
- —
- Eligible?
- —
Personal DTI + credit; lowest rate.
DSCR
20% down · 8.5% · 30yr
- Down + closing
- —
- Monthly P&I
- —
- Monthly cashflow
- —
- DSCR
- —
- Eligible?
- —
No personal income docs; deal must DSCR.
Hard money
10% down · 12.0% · 12mo
- Down + closing
- —
- Monthly P&I
- —
- Monthly cashflow
- —
- DSCR
- —
- Eligible?
- —
Short-term bridge; refi at stabilization.
Rent comps 39 comps
| Address | Beds | Baths | Sqft | Rent | $/sqft | DOM | Units | Dist |
|---|---|---|---|---|---|---|---|---|
| 106 Butler St New Haven, CT | 4.0 | 2.0 | 3045 | $2,600 | $0.85 | 14d | 1 | 0.07mi |
| 327 Newhall St New Haven, CT | 3.0 | 1.0 | 2742 | $1,950 | $0.71 | 43d | 1 | 0.10mi |
| 35 Goodyear St Unit 2 New Haven, CT | 2.0 | 1.0 | 3046 | $1,800 | $0.59 | 14d | 1 | 0.17mi |
| 918 Winchester Ave Unit 2 New Haven, CT | 3.0 | 1.0 | 3603 | $1,900 | $0.53 | 43d | 1 | 0.22mi |
| 761 Winchester Ave Unit 3 New Haven, CT | 2.0 | 1.0 | 3052 | $1,800 | $0.59 | 43d | 1 | 0.22mi |
| 165 Starr St Unit 2nd Floor New Haven, CT | 4.0 | 1.0 | 2099 | $2,200 | $1.05 | 18d | 1 | 0.37mi |
| 165 Starr St Unit 2nd Floor New Haven, CT | 4.0 | 2.0 | 2099 | $2,150 | $1.02 | 14d | 1 | 0.37mi |
| 233 Highland St New Haven, CT | 4.0 | 3.5 | 2200 | $3,950 | $1.80 | 43d | 1 | 0.39mi |
| 247 W Ivy St Unit 2 New Haven, CT | 3.0 | 1.0 | 3531 | $2,200 | $0.62 | 43d | 1 | 0.40mi |
| 322 Bassett St Unit 2 New Haven, CT | 3.0 | 1.0 | 2936 | $1,900 | $0.65 | 43d | 1 | 0.50mi |
| 327 Augur St Unit 3 Hamden, CT | 3.0 | 1.0 | 3036 | $1,800 | $0.59 | 2d | 1 | 0.62mi |
| 1097 Dixwell Ave Hamden, CT | 4.0 | 1.0 | 2005 | $1,750 | $0.87 | 11d | 1 | 0.76mi |
| 105 1st St Hamden, CT | 2.0 | 1.0 | 2870 | $2,100 | $0.73 | 2d | 1 | 0.84mi |
| 266 Everit St New Haven, CT | 4.0 | 3.5 | 3259 | $4,500 | $1.38 | 43d | 1 | 0.90mi |
| 30 Tilton St Unit 1 New Haven, CT | 2.0 | 1.0 | 2128 | $1,995 | $0.94 | 43d | 1 | 0.90mi |
| 420 Whitney Ave New Haven, CT | 3.0–4.0 | 2.0–3.0 | 1800 | $2,395 | $1.33 | 11d | 2 | 0.93mi |
| 420 Whitney Ave Unit 424-3B New Haven, CT | 4.0 | 3.0 | 1800 | $4,700 | $2.61 | 3d | 1 | 0.93mi |
| 125 Stimson Rd New Haven, CT | 3.0 | 2.5 | 3434 | $3,500 | $1.02 | 43d | 1 | 0.97mi |
| 339 Willow St Unit 1 New Haven, CT | 4.0 | 2.0 | 2163 | $4,050 | $1.87 | 11d | 1 | 0.97mi |
| 156 Putnam Ave Hamden, CT | 3.0 | 1.0 | 2304 | $1,800 | $0.78 | 2d | 1 | 0.98mi |
| 75 Stimson Rd New Haven, CT | 4.0 | 1.0 | 1890 | $3,500 | $1.85 | 14d | 1 | 1.00mi |
| 1768 Ella T Grasso Blvd New Haven, CT | 4.0 | 2.0 | 2193 | $3,950 | $1.80 | 43d | 1 | 1.01mi |
| 190 Pine Rock Ave Hamden, CT | 1.0–4.0 | 1.0–3.0 | 1850 | $2,905 | $1.57 | 43d | 1 | 1.01mi |
| 119 Carmel St Unit 3 New Haven, CT | 3.0 | 1.0 | 3282 | $1,900 | $0.58 | 43d | 1 | 1.09mi |
| 56 Mansfield St Unit 1 New Haven, CT | 3.0 | 1.0 | 2759 | $2,800 | $1.01 | 43d | 1 | 1.14mi |
| 1634 Ella T Grasso Blvd New Haven, CT | 4.0 | 1.5 | 2018 | $3,600 | $1.78 | 43d | 1 | 1.21mi |
| 47 Dickerman St Unit 1 New Haven, CT | 3.0 | 1.0 | 3729 | $2,100 | $0.56 | 43d | 1 | 1.25mi |
| 151 Fitch St #161 New Haven, CT | 3.0 | 2.0 | 2200 | $2,481 | $1.13 | 43d | 1 | 1.28mi |
| 604 Orange St #3 New Haven, CT | 2.0 | 1.0 | 3453 | $2,595 | $0.75 | 2d | 1 | 1.30mi |
| 1428 Dixwell Ave Fl 2 Hamden, CT | 3.0 | 1.0 | 3096 | $2,100 | $0.68 | 43d | 1 | 1.31mi |
| 146 Hartford Tpke Hamden, CT | 3.0 | 2.5 | 3644 | $6,900 | $1.89 | 2d | 1 | 1.34mi |
| 52 Goffe St New Haven, CT | 3.0 | 2.0 | 1935 | $2,600 | $1.34 | 23d | 1 | 1.34mi |
| 239 Bradley St Unit 1 New Haven, CT | 3.0 | 1.0 | 1982 | $3,650 | $1.84 | 43d | 1 | 1.40mi |
| 315 Humphrey St Unit A New Haven, CT | 4.0 | 3.5 | 2465 | $4,500 | $1.83 | 3d | 1 | 1.44mi |
| 84 Church St Unit 2 Hamden, CT | 2.0 | 1.0 | 2913 | $1,900 | $0.65 | 43d | 1 | 1.44mi |
| 52 Edwards St Unit 1 New Haven, CT | 2.0 | 1.0 | 2348 | $2,850 | $1.21 | 2d | 1 | 1.47mi |
| 799 Elm St New Haven, CT | 2.0 | 1.0 | 3613 | $1,590 | $0.44 | 43d | 1 | 1.47mi |
| 300 Humphrey St Unit 2 New Haven, CT | 3.0 | 2.0 | 2868 | $3,295 | $1.15 | 43d | 1 | 1.48mi |
| 30 Platt St Unit 3rd New Haven, CT | 2.0 | 1.0 | 2957 | $2,000 | $0.68 | 11d | 1 | 1.50mi |
Listing history 34 events
-
2026-06-16statusdays on market $499,900 Under Contract 41 DOM
-
2026-06-15days on market $499,900 Active 40 DOM
-
2026-06-14days on market $499,900 Active 38 DOM
-
2026-06-13days on market $499,900 Active 37 DOM
-
2026-06-10days on market $499,900 Active 35 DOM
-
2026-06-09days on market $499,900 Active 34 DOM
-
2026-06-09status $499,900 Active 33 DOM
-
2026-06-08days on market $499,900 Under Contract - Continue to Show 33 DOM
-
2026-06-07days on market $499,900 Under Contract - Continue to Show 32 DOM
-
2026-06-05days on market $499,900 Under Contract - Continue to Show 29 DOM
-
2026-06-03days on market $499,900 Under Contract - Continue to Show 28 DOM
-
2026-06-03statusdays on market $499,900 Under Contract - Continue to Show 27 DOM
-
2026-06-01days on market $499,900 Active 26 DOM
-
2026-05-31days on market $499,900 Active 25 DOM
-
2026-05-06$499,900 Active 259-char remark
-
2021-03-22historical
-
2021-02-23historical Under Contract - Continue to Show
-
2021-02-08$265,000 Active
-
2018-09-06soldstatus $173,775
-
2018-09-05soldstatus $173,775 Closed
Show marketing remark (127 chars)
Occupied 3 family in good condition with hard wood floors. Close to Yale, Albertus & Southern, homeowner real estate agent
-
2018-07-29historical
Show marketing remark (127 chars)
Occupied 3 family in good condition with hard wood floors. Close to Yale, Albertus & Southern, homeowner real estate agent
-
2018-07-29status Active
Show marketing remark (127 chars)
Occupied 3 family in good condition with hard wood floors. Close to Yale, Albertus & Southern, homeowner real estate agent
-
2018-07-04historical
Show marketing remark (127 chars)
Occupied 3 family in good condition with hard wood floors. Close to Yale, Albertus & Southern, homeowner real estate agent
-
2018-06-12status Active
Show marketing remark (127 chars)
Occupied 3 family in good condition with hard wood floors. Close to Yale, Albertus & Southern, homeowner real estate agent
-
2018-05-31historical
Show marketing remark (127 chars)
Occupied 3 family in good condition with hard wood floors. Close to Yale, Albertus & Southern, homeowner real estate agent
-
2018-03-10status Under Contract
Show marketing remark (127 chars)
Occupied 3 family in good condition with hard wood floors. Close to Yale, Albertus & Southern, homeowner real estate agent
-
2018-03-08price $189,999
Show marketing remark (127 chars)
Occupied 3 family in good condition with hard wood floors. Close to Yale, Albertus & Southern, homeowner real estate agent
-
2018-03-02price $220,039
Show marketing remark (127 chars)
Occupied 3 family in good condition with hard wood floors. Close to Yale, Albertus & Southern, homeowner real estate agent
-
2018-03-01$179,917 Active
Show marketing remark (127 chars)
Occupied 3 family in good condition with hard wood floors. Close to Yale, Albertus & Southern, homeowner real estate agent
-
2014-09-25soldstatus $122,000
-
2014-09-23soldstatus $122,000
-
2014-08-14$129,900
-
2011-11-08historical
-
2011-03-08$114,900
ⓘ Source: listings_history table (triggers on properties + properties_extension) + one-shot
backfill from property_details.listing_events for pre-trigger history.
Tax reassessment forecast CT · Partial reset (capped growth)
- Current annual tax
- $5,976 · $498/mo
- Projected year-2 tax
- $8,337 · $695/mo
- Expected delta
- +$2,361/yr (+$197/mo · 39.5%)
ⓘ Screening estimate from a state-policy table — verify with the county assessor before closing.
Climate risk First Street
- Flood 3/10 Moderate FEMA zone X (unshaded) · 20% chance over 30 yrs
- Wildfire 1/10 Low
- Heat 6/10 Major 7 d/yr ≥99°F today · 16 d/yr by 30 yrs out
- Wind 6/10 Major 53% chance of damaging wind over 30 yrs
- Air quality 5/10 Major 6 unhealthy d/yr today · 8 by 30 yrs out
Nearby sold comps map
Loading sold comps map…
Walkable amenities ~0.75 mi
Loading nearby amenities…
Taxation est. · year 1
- Rental income
- $70,104
- − Mortgage interest
- −$28,002
- − Property taxes
- −$5,976
- − Insurance
- −$2,500
- − Repairs & maintenance
- −$5,608
- − Management
- −$5,608
- − Depreciation
- −$14,543
- Taxable income
- $7,867
- Est. tax owed @ 24.0%
- −$1,888
- After-tax cash flow
- $13,560/yr
For passive investors: Depreciation is non-cash, so a rental often shows a tax loss while cash-flowing — sheltering income. Rental losses are passive: they offset passive income freely, and up to $25,000/yr can offset ordinary (W-2) income if you actively participate and your MAGI is under $100k (phasing out to $0 by $150k); unused losses carry forward. On sale, claimed depreciation is recaptured at up to 25%, and gains may owe capital-gains tax (a 1031 exchange can defer both). Figures are a year-1 estimate at your 24.0% rate — not tax advice; consult a CPA.
Schools (NCES district)
- District
- New Haven School District
- NCES district ID
- 0902790
- Math proficiency
- 12% ▼ -10.00%
- Reading proficiency
- 25% ▼ -10.00%
- Median HH income
- $38,058
- Composite
- 15.48/100
- National rank
- #9308
- State rank
- #147 of 153 in CT
Livability — New Haven
- Score
- 79/100
- State rank
- #31
- US rank
- #2190
Category grades
Schools grade is shown separately in the Schools card above.
Census & demographics
- Census place
- New Haven, CT
- County
- New Haven County · 688,236 people
- City population
- 132,813
- Metro
- New Haven-Milford, CT
- Population (ZIP)
- 54,730
- Household income
- $59,969
- Rent vs Own
- Severe rent burden
- 4999.0
Population outlook (South Central Connecticut County) Hauer SSP2
- By 2040
- 608,362
Race, ethnicity, and origin ACS 2023
- Neighborhood character
- Highly diverse neighborhood (Simpson 0.73)
- Race & ethnicity
- Black 34% White 32% Hispanic / Latino 21% Two or more races 8% Asian 7%
- Hispanic origin (detail)
- Mexican 4% Puerto Rican 10% Dominican 2%
- Common ancestry
- Romanian 2% Lithuanian 1% Russian 1%
- Foreign-born
- 17% · Canada, China, South Korea
- Languages at home
- 74% English-only · Spanish 15% Chinese 3% Other Indo-European 2%
Political lean MEDSL · South Central Connecticut
- 2024 margin
- Strong D (+20.1) · D 59.0% · R 38.9% · Other 2.1%
- All cycles
- 2024: D+20.1
Not yet ingested
- Civics
- —
Market trends
- HPI YoY
- ▼ -86.05%
- Current HPI
- 328.1353
- Rent YoY
- ▲ 2.60%
- Metro
- New Haven-Milford, CT
- State GDP YoY
- ▲ 1.06%
- F500 in state
- 38
Industry mix (Fortune 500 HQ in CT)
| Industry | F500 HQs | Revenue |
|---|---|---|
| Industrial Machinery | 4 | $38B |
|
||
| Insurance | 3 | $71B |
|
||
| Financial Services | 2 | $25B |
|
||
| Transportation / Logistics | 2 | $18B |
|
||
| Healthcare | 1 | $247B |
|
||
| Telecommunications | 1 | $55B |
|
||
Price history
+335.1% since first listed23 events — show timeline
- 2026-06-16 Pending — Smart MLS
- 2026-06-08 Relisted — Smart MLS
- 2026-06-02 Contingent — Smart MLS
- 2026-05-06 Listed $499,900 Smart MLS
- 2021-03-22 Listing Removed — Smart MLS
- 2021-02-23 Contingent — Smart MLS
- 2021-02-08 Listed $265,000 Smart MLS
- 2018-09-06 Sold (Public Records) $173,775 Public Records
- 2018-09-05 Sold (MLS) $173,775 Smart MLS
- 2018-07-29 Listing Removed — Smart MLS
- 2018-07-29 Relisted — Smart MLS
- 2018-07-04 Listing Removed — Smart MLS
- 2018-06-12 Relisted — Smart MLS
- 2018-05-31 Listing Removed — Smart MLS
- 2018-03-10 Pending — Smart MLS
- 2018-03-08 Price Changed $189,999 Smart MLS
- 2018-03-02 Price Changed $220,039 Smart MLS
- 2018-03-01 Listed $179,917 Smart MLS
- 2014-09-25 Sold (Public Records) $122,000 Public Records
- 2014-09-23 Sold (MLS) $122,000 Smart MLS
- 2014-08-14 Listed $129,900 Smart MLS
- 2011-11-08 Listing Removed — Smart MLS
- 2011-03-08 Listed $114,900 Smart MLS
Property tax history
+6.7%/yrLatest (2023): $5,976 · -6.4% YoY. Source: county tax records.
Cash-flow waterfall
monthlySold comps — $/sqft
last 12 mo · ≤1 miLoading sold comps…