Aragon Dr #93 · Charles Town, WV
Flood risk 1/10 · Minimal
- FEMA flood zone
- X (unshaded)
- Chance of flooding over 30 yrs
- 0.0%
- Est. flood insurance / yr
- $507 – $1,088
Fire risk 1/10 · Minimal
- Est. fire insurance / yr
- $787 – $1,461
Heat risk 5/10 · Moderate
- Hot days now (above 102°F)
- 7 days/yr
- Hot days in 30 yrs
- 16 days/yr
Wind risk 3/10 · Minor
- Chance of severe wind over 30 yrs
- 5.0%
Air-quality risk 2/10 · Minimal
- Unhealthy air days now
- 1 days/yr
- Unhealthy air days in 30 yrs
- 2 days/yr
Risk factors via First Street. Map © Google.
Why this score? — see what drove the D- grade
The composite is a weighted blend of 9 inputs, each scored 0–100. Each bar is that input's sub-score; the figure is the points it added to the 100-point composite (weight × sub-score).
- Cash flow +7.9/30.0
- ARV discount +7.4/15.0
- Appreciation +6.3/10.0
- Livability +3.8/5.0
- Rent growth +3.6/5.0
- Schools +3.4/10.0
- Condition / age +2.5/5.0
- 1% rule +2.4/10.0
- DSCR +1.9/10.0
$299,807
🖨 Deal sheet 📄 Offer letter ✓ Due diligence
Listing remarks
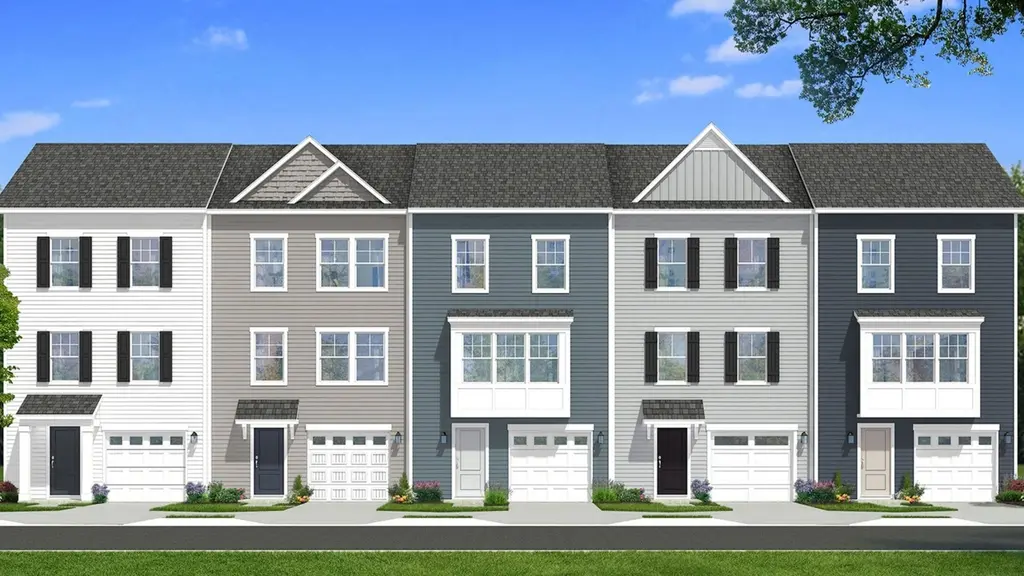
Beautiful York II interior townhome featuring 3 bedrooms, 2 full baths, and 2 half baths. The open-concept main level is enhanced with durable LVP flooring throughout, creating a seamless and modern living space. The gourmet kitchen showcases elegant quartz countertops, stylish pendant lighting over the island, and upgraded cabinetry with crown molding for a refined finish. With thoughtful design details and plenty of room for comfortable living and entertaining, this home offers the perfect blend of style and functionality.
Key facts
- Garage
- Built 2026
- Listed 6 days
Property features AI
Finance
- Financial info: List price: $299,807
Exterior
- Parking: 1 garage space; 1 total parking space
- Home design: York II Garage plan; Single-family spec home; Active listing
- Exterior features: Address: Aragon Dr #93, Charles Town, WV 25414
Interior
- Bedrooms: 3 bedrooms
- Bathrooms: 2 full bathrooms; 2 half bathrooms; 3 total bathrooms
- Interior features: Spec home (York II Garage plan); Living area approximately 1600
Neighborhood map
What this means for you Summary
Snapshot
- This is a 3-bed/3.0-bath townhouse listed at $300k.
Deal economics
- At list price, monthly cash flow is $-323 ($-4k/yr) — negative.
- To cash-flow at today's rent, offer at most $253k (15.6% below list).
- To meet the 1% rule (rent ≥ 1% of price), the offer needs to be $221k (26.2% below list).
- Recommended offer: $221k (26.2% below list) — sets the bar for 1% rule.
- Cap rate 5.0% vs local median 3.4% in Charles Town — top-decile yield for the area; either an underpriced asset or a hidden risk that comps aren't pricing in. Stress-test before assuming the spread holds.
Location & tenants
- Location reads 76/100 on livability (#22 in WV, #3,460 nationally) — a middle-class / working-renter tenant base. Strengths: crime A+, housing A+, health & safety A+; Watch: schools D+, amenities D+, commute F.
- Jefferson County Schools (rural): math 29% / reading 46% proficiency, ranked #6 of 55 in WV (top 11%) — families likely to look elsewhere, expect single-tenant / working-renter base with shorter leases.
- Market conditions: Rents rising fast (+4.3%/yr); 382 active listings in the ZIP; 14 comparable units currently listed for rent nearby; rentals at typical pace (median 25d on market — plan ~3-4 weeks tenant-placement turnaround); solid renter incomes; 1,162 units permitted in Jefferson County in 2024 (360 in 5+ unit buildings).
Forward outlook
- In year one you build about $10k of equity ($2k loan paydown + $8k appreciation (2.7% local appreciation)).
- Jefferson County population projected at +13% by 2050 — modest demand growth; plan on rents tracking national, not racing it.
- By year 4, paydown + projected appreciation supports a ~$34k cash-out refi (75% LTV) — recoverable capital for the next deal without selling this one.
Negotiation context
- Only 6 days on market — expect competitive offers; lowballing is unlikely to land.
Risks & watch-outs
- Climate carrying-cost: extreme-heat days projected 7→16/yr by 2055 (HVAC capex compounding) — expect insurance premiums to compound above CPI over the hold.
Questions for the listing agent
- What do current leases actually rent for vs. the listed asking? Can we see a recent rent roll and the last 12 months of T-12 income?
- Is there a deadline driving the sale (1031 exchange, divorce, estate, relocation)? That informs how much negotiation room exists.
- Schools are D-rated, which usually means shorter tenancies and higher turnover. Who's the typical renter profile here, and what's been the actual vacancy rate?
- The area grade is low — what's the realistic commute time and amenity access for the typical tenant pool here? Any planned neighborhood developments (good or bad) we should know about?
- What's the average days-on-market for RENTAL listings here right now (not sales)? A rising rental-DOM trend means longer vacancies and softer asking-rent achievability than the comps imply.
- What's the recent tenant-quality profile in this submarket — average credit score on applications, eviction rate, late-payment / NSF rate, and stable-employment percentage? A property-management company in the area should have these aggregated.
- How much new for-sale + rental construction is in the pipeline within 1–3 miles? Heavy new supply typically softens prices + rents 12–24 months out; constrained supply supports both.
Investment metrics
- 1% rule
- 0.74% ✗
- Cap rate
- 5.00%
- Cash-on-cash
- -4.62%
- DSCR
- 0.79
- GRM
- 11.3
CMA / ARV
- ARV (on-the-fly)
- $299,200
- Comps found
- 12
Show comp detail 12 sales within ~0.75 mi
| Address | Dist | Beds/Ba | Sqft | Sold | Price | $/sf | Match |
|---|---|---|---|---|---|---|---|
| 70 Bolingbroke Way | 0.24mi | 3/3.5 | 1,600 (0%) | 5mo | $299,990 | $187 | 82 |
| 89 Bolingbroke Way | 0.27mi | 3/3.5 | 1,600 (0%) | 4mo | $287,849 | $180 | 82 |
| 118 Bolingbroke Way | 0.29mi | 3/3.5 | 1,600 (0%) | 4mo | $302,421 | $189 | 82 |
| 9 Bolingbroke Way | 0.21mi | 3/3.5 | 1,600 (0%) | 8mo | $298,988 | $187 | 82 |
| 58 Bolingbroke Way | 0.23mi | 3/3.5 | 1,600 (0%) | 7mo | $305,649 | $191 | 81 |
| 85 Bolingbroke Way | 0.27mi | 3/3.5 | 1,600 (0%) | 6mo | $293,990 | $184 | 80 |
| 369 Aragon Dr | 0.25mi | 3/3.0 | 1,674 (+5%) | 1mo | $303,808 | $181 | 80 |
| 361 Aragon Dr | 0.25mi | 3/3.5 | 1,674 (+5%) | 0mo | $324,990 | $194 | 78 |
| 128 Bolingbroke Way | 0.24mi | 3/2.5 | 1,674 (+5%) | 2mo | $311,645 | $186 | 78 |
| 76 Bolingbroke Way | 0.26mi | 4/3.5 (+1) | 1,600 (0%) | 7mo | $321,819 | $201 | 76 |
| 84 Bolingbroke Way | 0.25mi | 4/3.5 (+1) | 1,600 (0%) | 7mo | $291,566 | $182 | 75 |
| 97 Bolingbroke Way | 0.28mi | 4/3.5 (+1) | 1,600 (0%) | 6mo | $304,014 | $190 | 75 |
Match score weights: distance 35% · size 25% · config 20% · recency 20%. Top-matched comps best support the ARV.
Projected returns pro-forma
2.67% appreciation · 4.35% rent growth · sell at horizon
- IRR
- 2.8%
- Equity multiple
- 1.16×
- Total profit
- $13,476
- Equity at exit
- $129,351
- IRR
- 7.0%
- Equity multiple
- 2.05×
- Total profit
- $88,042
- Equity at exit
- $195,203
Cash invested: $83,946 (down + closing). Projections, not guarantees.
Landlord ↔ Tenant lean methodology
- Overall (STATE)
- 83 Strongly Landlord-Friendly
- State West Virginia
- 83 Strongly Landlord-Friendly · R+22
- County
- — inherits STATE
- City
- — inherits STATE
ZIP-level market 25414
- Home prices YoY
- 0.9%
- Rents YoY
- 4.3%
- Active inventory
- 382
- Price-to-rent
- 11.3×
Monthly cashflow live
- Estimated rent
- $2,213 high interval (Pro) →
- Mortgage (P&I)
- −$1,572
- Tax est. 1.5%
- −$375 /mo · $4,497/yr
- Insurance
- −$125
- HOA
- −$0
- Vacancy / Maint / Mgmt
- −$465
- Net cashflow
- $-323
Break-even live
UW: 25.0% down · 7.5% · 30yr · 1.5% tax · 5.0% vac · 8.0% maint · 8.0% mgmt
Financing live
Cash to close
- Down payment
- $74,952
- Closing costs
- $8,994
- Reserves months
- —
- Total cash needed
- —
Loan-product check · same deal, 3 products live
Conventional
25% down · 7.5% · 30yr
- Down + closing
- —
- Monthly P&I
- —
- Monthly cashflow
- —
- DSCR
- —
- Eligible?
- —
Personal DTI + credit; lowest rate.
DSCR
20% down · 8.5% · 30yr
- Down + closing
- —
- Monthly P&I
- —
- Monthly cashflow
- —
- DSCR
- —
- Eligible?
- —
No personal income docs; deal must DSCR.
Hard money
10% down · 12.0% · 12mo
- Down + closing
- —
- Monthly P&I
- —
- Monthly cashflow
- —
- DSCR
- —
- Eligible?
- —
Short-term bridge; refi at stabilization.
Rent comps 14 comps
| Address | Beds | Baths | Sqft | Rent | $/sqft | DOM | Units | Dist |
|---|---|---|---|---|---|---|---|---|
| 27 Towton PL Charles Town, WV | 3.0 | 2.5 | 1550 | $1,995 | $1.29 | 24d | 1 | 0.23mi |
| 114 Telluride Way Charles Town, WV | 3.0 | 2.5 | 1700 | $2,090 | $1.23 | 24d | 1 | 0.82mi |
| 135 Telluride Way Charles Town, WV | 4.0 | 3.5 | 2097 | $2,400 | $1.14 | 24d | 1 | 0.85mi |
| 509 Seeback Dr Charles Town, WV | 3.0 | 2.5 | 1946 | $2,150 | $1.10 | 24d | 1 | 0.85mi |
| 19 Winterplace Dr Charles Town, WV | 4.0 | 3.5 | 2095 | $2,100 | $1.00 | 13d | 1 | 0.89mi |
| 10 Telluride Way Charles Town, WV | 3.0 | 4.0 | 2097 | $2,300 | $1.10 | 24d | 1 | 0.93mi |
| 470 Seeback Dr Charles Town, WV | 3.0 | 2.5 | 1946 | $2,100 | $1.08 | 24d | 1 | 1.02mi |
| 454 Seeback Dr Charles Town, WV | 3.0 | 4.0 | 1952 | $2,100 | $1.08 | 24d | 1 | 1.02mi |
| 439 Seeback Dr Unit 255 Charles Town, WV | 3.0 | 2.5 | 1920 | $2,100 | $1.09 | 20d | 1 | 1.02mi |
| 458 Seeback Dr Charles Town, WV | 3.0 | 2.5 | 1946 | $2,100 | $1.08 | 24d | 1 | 1.02mi |
| 450 Seeback Dr Charles Town, WV | 3.0 | 2.5 | 1793 | $2,050 | $1.14 | 13d | 1 | 1.02mi |
| 478 Seeback Dr Charles Town, WV | 3.0 | 2.5 | 1946 | $2,200 | $1.13 | 20d | 1 | 1.02mi |
| 214 Gumspring Dr Charles Town, WV | 4.0 | 2.5 | 2148 | $2,500 | $1.16 | 20d | 1 | 1.29mi |
| 115 Bell Tower Ln Charles Town, WV | 4.0 | 2.5 | 2223 | $2,600 | $1.17 | 2d | 1 | 1.30mi |
Listing history 6 events
-
2026-06-18days on market $299,807 Active 6 DOM
-
2026-06-17days on market $299,807 Active 5 DOM
-
2026-06-16days on market $299,807 Active 4 DOM
-
2026-06-15days on market $299,807 Active 3 DOM
-
2026-06-13remarks 530-char remark
-
2026-06-13$299,807 Active 1 DOM
ⓘ Source: listings_history table (triggers on properties + properties_extension) + one-shot
backfill from property_details.listing_events for pre-trigger history.
Climate risk First Street
- Flood 1/10 Low FEMA zone X (unshaded) · 0% chance over 30 yrs
- Wildfire 1/10 Low
- Heat 5/10 Major 7 d/yr ≥102°F today · 16 d/yr by 30 yrs out
- Wind 3/10 Moderate 5% chance of damaging wind over 30 yrs
- Air quality 2/10 Low 1 unhealthy d/yr today · 2 by 30 yrs out
Nearby sold comps map
Loading sold comps map…
Walkable amenities ~0.75 mi
Loading nearby amenities…
Taxation est. · year 1
- Rental income
- $26,561
- − Mortgage interest
- −$16,794
- − Property taxes
- −$4,497
- − Insurance
- −$1,499
- − Repairs & maintenance
- −$2,125
- − Management
- −$2,125
- − Depreciation
- −$8,722
- Taxable loss
- −$9,201
- Est. tax savings @ 24.0%
- +$2,208
- After-tax cash flow
- $-1,672/yr
For passive investors: Depreciation is non-cash, so a rental often shows a tax loss while cash-flowing — sheltering income. Rental losses are passive: they offset passive income freely, and up to $25,000/yr can offset ordinary (W-2) income if you actively participate and your MAGI is under $100k (phasing out to $0 by $150k); unused losses carry forward. On sale, claimed depreciation is recaptured at up to 25%, and gains may owe capital-gains tax (a 1031 exchange can defer both). Figures are a year-1 estimate at your 24.0% rate — not tax advice; consult a CPA.
Schools (NCES district)
- District
- Jefferson County Schools
- NCES district ID
- 5400570
- Math proficiency
- 29% ▼ -13.00%
- Reading proficiency
- 46% ▼ -7.00%
- Median HH income
- $67,038
- Composite
- 33.98/100
- National rank
- #5322
- State rank
- #6 of 55 in WV
Livability — Charles Town
- Score
- 76/100
- State rank
- #22
- US rank
- #3460
Category grades
Schools grade is shown separately in the Schools card above.
Census & demographics
- County
- Jefferson County · 28,403 people
- City population
- 21,073
- Metro
- Washington-Arlington-Alexandria, DC-VA-MD-WV
- Population (ZIP)
- 21,073
- Household income
- $105,500
- Rent vs Own
- Severe rent burden
- 290.0
Population outlook (Jefferson County) Hauer SSP2
- Today (2025)
- 61,715 people
- By 2030
- 64,052 · +3.8%
- By 2040
- 67,713 · +9.7%
- By 2050
- 69,843 · +13.2%
- By 2075
- 72,679 · +17.8%
- By 2100
- 71,872 · +16.5%
Race, ethnicity, and origin ACS 2023
- Neighborhood character
- Predominantly White (78%)
- Race & ethnicity
- White 78% Two or more races 10% Black 7% Hispanic / Latino 7% Asian 1%
- Hispanic origin (detail)
- Mexican 2% Puerto Rican 1%
- Common ancestry
- Romanian 3% Slovak 2% Lithuanian 2%
- Foreign-born
- 5% · Canada, Jamaica
- Languages at home
- 93% English-only · Spanish 5% Other Indo-European 1%
Political lean MEDSL · Jefferson
- 2024 margin
- R (+15.8) · D 41.0% · R 56.8% · Other 2.1%
- 2008→2024 swing
- -20.6pp toward R · 2008: 4.8pp · 2024: -15.8pp
- All cycles
- 2024: R+15.8 2020: R+10.5 2016: R+15.3 2012: R+4.0 2008: D+4.8
Not yet ingested
- Civics
- —
Market trends
- HPI YoY
- ▲ 2.67%
- Current HPI
- 296.8007
- Rent YoY
- ▲ 4.35%
- Metro
- Washington-Arlington-Alexandria, DC-VA-MD-WV
- State GDP YoY
- —
- F500 in state
- 0
Cash-flow waterfall
monthlySold comps — $/sqft
last 12 mo · ≤1 miLoading sold comps…