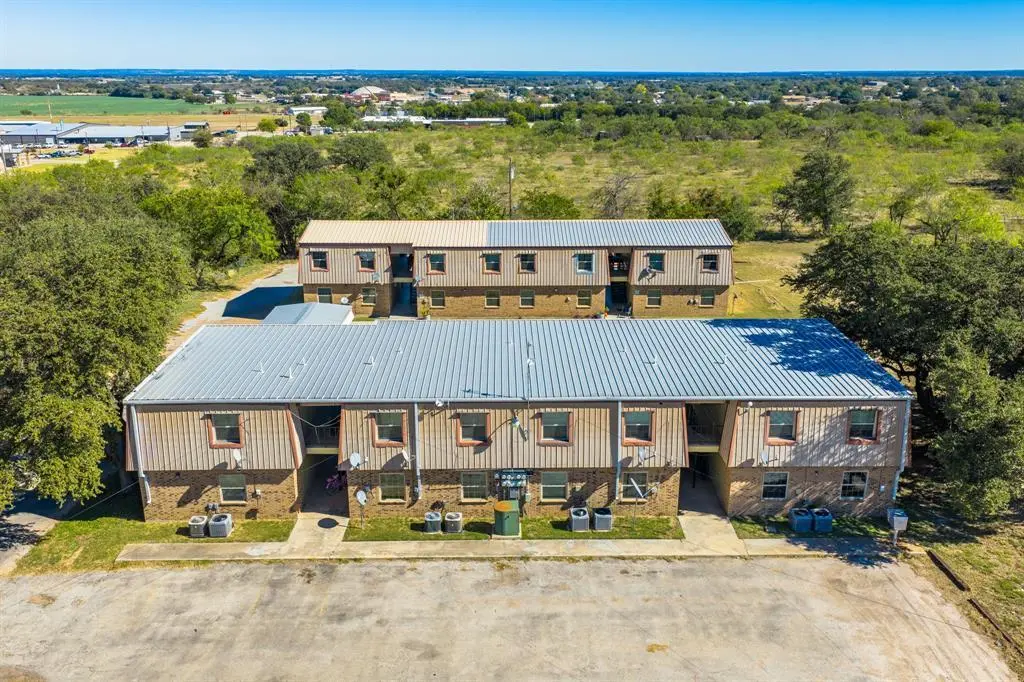
 16-Plex
1316 N Mary St · Comanche, TX
Flood risk 1/10 · Minimal
- FEMA flood zone
- X
- Chance of flooding over 30 yrs
- 0.0%
- Est. flood insurance / yr
- $507 – $1,088
Fire risk 6/10 · Moderate
- Est. fire insurance / yr
- $1,222 – $2,270
Heat risk 7/10 · Major
- Hot days now (above 106°F)
- 7 days/yr
- Hot days in 30 yrs
- 21 days/yr
Wind risk 6/10 · Moderate
- Chance of severe wind over 30 yrs
- 27.0%
Air-quality risk 1/10 · Minimal
- Unhealthy air days now
- 0 days/yr
- Unhealthy air days in 30 yrs
- 0 days/yr
Risk factors via First Street. Map © Google.
Why this score? — see what drove the B- grade
The composite is a weighted blend of 9 inputs, each scored 0–100. Each bar is that input's sub-score; the figure is the points it added to the 100-point composite (weight × sub-score).
- Cash flow +30.0/30.0
- 1% rule +10.0/10.0
- DSCR +10.0/10.0
- ARV discount +7.5/15.0
- Livability +3.2/5.0
- Schools +3.1/10.0
- Rent growth +2.5/5.0
- Condition / age +2.5/5.0
- Appreciation +0.0/10.0
$750,000
🖨 Deal sheet 📄 Offer letter ✓ Due diligence
Multi-family units
County records classify this as Multi-Family (5+ Unit). Listing-text estimate: 16 units. confirmed
5+ unit building — per-unit beds/baths from public records are typically unavailable; the breakdown below (if shown) is an estimate from the listing text.
Listing remarks MLS
Welcome to a rare investment opportunity: a 16-unit multifamily property located in the heart of Comanche, Texas, the county seat of Comanche County. This strategically positioned asset combines stable cash flow with the charm of a small Central Texas town. With 16 units, the property offers meaningful scale while remaining manageable. In small markets like Comanche, long-term tenants are common, reducing vacancy risk. The city's stable population, modest income levels, and moderate home values create consistent demand for quality rental housing. This 16-unit complex has been consistently well maintained, reflecting attentive ownership and stable long-term operations. Hold for cash flow or reposition with improvements and reappraise — small-town multifamily often benefits from value-add plays and long-term steadiness. This 16-unit multifamily property in Comanche, Texas, represents a compelling blend of stable income, value-add potential, and community-driven demand. For investors looking to diversify into a low-cost, small-market multifamily play with long-term upside, this asset offers a rare opportunity in Central Texas.
Key facts
- 1.64 acre lot
- 48 parking spots
- Built 1967
Neighborhood map
What this means for you Summary
Snapshot
- This is a 16 × 29-bed/16.0-bath units multifamily listed at $750k.
Deal economics
- At list price, monthly cash flow is $11k ($134k/yr) — positive. Per door: $700/mo.
- The deal already cash-flows at list — no discount required.
- Meets the 1% rule at list price ($20k rent vs $750k).
- Recommended offer: $660k (12.0% below list) — sets the bar for market timing.
- Cap rate 24.2% vs local median 2.1% in Comanche — top-decile yield for the area; either an underpriced asset or a hidden risk that comps aren't pricing in. Stress-test before assuming the spread holds.
Location & tenants
- Location reads 64/100 on livability (#763 in TX) — a middle-class / working-renter tenant base. Strengths: cost of living A+, housing A+; Watch: crime D+, health & safety D+, schools F.
- Comanche ISD (town): math 39% / reading 36% proficiency, ranked #484 of 826 in TX (top 59%) — families likely to look elsewhere, expect single-tenant / working-renter base with shorter leases; 60% free/reduced lunch — lower-income household profile, screen leases tightly.
- Market conditions: 168 active listings in the ZIP; 4 units permitted in Comanche County in 2024 (0 in 5+ unit buildings).
Forward outlook
- Local home prices are declining (-3.0%/yr); year-one equity from $5k of loan paydown is wiped out by about $22k of value loss. Plan a longer hold.
- Comanche County population projected at -29% by 2050 — secular population decline; favor cash flow + early exit over multi-decade hold.
- At projected returns (-3.0% appreciation + 3.0% rent growth), your $210k cash investment doubles in ~2 years — after that, you're playing with house money.
Negotiation context
- It's been on market 178 days — a 12% lower offer ($660k) is reasonable based on typical stale-listing flexibility.
- 3 sale attempts with the ask held roughly flat each time — persistent listings suggest the price (not the market) is what's stuck; bring a comps-based counter.
Risks & watch-outs
- Climate carrying-cost: major wind risk, 27% chance of damaging wind over 30y; major wildfire risk; extreme-heat days projected 7→21/yr by 2055 (HVAC capex compounding) — expect insurance premiums to compound above CPI over the hold.
Questions for the listing agent
- It's been on market 178 days. Have you received any prior offers? Is the seller open to a 12% concession, seller financing, or rate buy-down credit?
- Can we see the unit-by-unit rent roll, current vacancy, and any below-market leases? What's the average tenancy length?
- What capital expenditures (roof, boiler, parking lot, exteriors) have been made in the last 5 years, and what's planned in the next 2?
- Built in 1967 — when were the roof, HVAC, electrical panel, plumbing, and water heater last replaced?
- Why hasn't it sold? Are there any deal-killer items the seller is aware of (foundation, flood, title, zoning, code violations)?
- Is there a deadline driving the sale (1031 exchange, divorce, estate, relocation)? That informs how much negotiation room exists.
- Schools are F-rated, which usually means shorter tenancies and higher turnover. Who's the typical renter profile here, and what's been the actual vacancy rate?
- Crime grade is D in this area — have there been break-ins, vandalism, or insurance claims at this property in the last 3 years? What carrier currently insures it and at what premium?
- What's the average days-on-market for RENTAL listings here right now (not sales)? A rising rental-DOM trend means longer vacancies and softer asking-rent achievability than the comps imply.
- What's the recent tenant-quality profile in this submarket — average credit score on applications, eviction rate, late-payment / NSF rate, and stable-employment percentage? A property-management company in the area should have these aggregated.
- How much new apartment / multifamily construction is in the pipeline within 1–3 miles? Heavy new supply (>2% of stock underway) typically softens rents 12–24 months out; light construction supports rent growth.
Investment metrics
- 1% rule
- 2.73% ✓
- Cap rate
- 24.22%
- Cash-on-cash
- 64.02%
- DSCR
- 3.85
- GRM
- 3.1
CMA / ARV
No comps found within radius.
Projected returns pro-forma
-3.0% appreciation · 3.0% rent growth · sell at horizon
- IRR
- 63.1%
- Equity multiple
- 3.82×
- Total profit
- $592,220
- Equity at exit
- $111,827
- IRR
- 67.6%
- Equity multiple
- 7.83×
- Total profit
- $1,435,276
- Equity at exit
- $64,846
Cash invested: $210,000 (down + closing). Projections, not guarantees.
Landlord ↔ Tenant lean methodology
- Overall (STATE)
- 87 Strongly Landlord-Friendly
- State Texas
- 87 Strongly Landlord-Friendly · R+5
- County
- — inherits STATE
- City
- — inherits STATE
ZIP-level market 76442
- Home prices YoY
- -15.9%
- Active inventory
- 168
- Price-to-rent
- 48.8×
Monthly cashflow live
- Estimated rent
- $20,486 medium interval (Pro) →
- Mortgage (P&I)
- −$3,933
- Tax from tax record
- −$735 /mo · $8,816/yr
- Insurance
- −$312
- HOA
- −$0
- Vacancy / Maint / Mgmt
- −$4,302
- Net cashflow
- $11,204
Break-even live
16-unit breakdown (identical units grouped — click to expand)
| Units | Beds | Baths | Est. rent |
|---|---|---|---|
| 16× units | 29 | 16 | $20,480 |
| #1 | 29 | 16 | $1,280 |
| #2 | 29 | 16 | $1,280 |
| #3 | 29 | 16 | $1,280 |
| #4 | 29 | 16 | $1,280 |
| #5 | 29 | 16 | $1,280 |
| #6 | 29 | 16 | $1,280 |
| #7 | 29 | 16 | $1,280 |
| #8 | 29 | 16 | $1,280 |
| #9 | 29 | 16 | $1,280 |
| #10 | 29 | 16 | $1,280 |
| #11 | 29 | 16 | $1,280 |
| #12 | 29 | 16 | $1,280 |
| #13 | 29 | 16 | $1,280 |
| #14 | 29 | 16 | $1,280 |
| #15 | 29 | 16 | $1,280 |
| #16 | 29 | 16 | $1,280 |
| Total (16 units) | $20,486 | ||
UW: 25.0% down · 7.5% · 30yr · 1.5% tax · 5.0% vac · 8.0% maint · 8.0% mgmt
Financing live
Cash to close
- Down payment
- $187,500
- Closing costs
- $22,500
- Reserves months
- —
- Total cash needed
- —
Loan-product check · same deal, 3 products live
Conventional
25% down · 7.5% · 30yr
- Down + closing
- —
- Monthly P&I
- —
- Monthly cashflow
- —
- DSCR
- —
- Eligible?
- —
Personal DTI + credit; lowest rate.
DSCR
20% down · 8.5% · 30yr
- Down + closing
- —
- Monthly P&I
- —
- Monthly cashflow
- —
- DSCR
- —
- Eligible?
- —
No personal income docs; deal must DSCR.
Hard money
10% down · 12.0% · 12mo
- Down + closing
- —
- Monthly P&I
- —
- Monthly cashflow
- —
- DSCR
- —
- Eligible?
- —
Short-term bridge; refi at stabilization.
Listing history 5 events
-
2026-02-11status Active 1147-char remark
Show marketing remark (1147 chars)
Welcome to a rare investment opportunity: a 16-unit multifamily property located in the heart of Comanche, Texas, the county seat of Comanche County. This strategically positioned asset combines stable cash flow with the charm of a small Central Texas town. With 16 units, the property offers meaningful scale while remaining manageable. In small markets like Comanche, long-term tenants are common, reducing vacancy risk. The city's stable population, modest income levels, and moderate home values create consistent demand for quality rental housing. This 16-unit complex has been consistently well maintained, reflecting attentive ownership and stable long-term operations. Hold for cash flow or reposition with improvements and reappraise — small-town multifamily often benefits from value-add plays and long-term steadiness. This 16-unit multifamily property in Comanche, Texas, represents a compelling blend of stable income, value-add potential, and community-driven demand. For investors looking to diversify into a low-cost, small-market multifamily play with long-term upside, this asset offers a rare opportunity in Central Texas.
-
2025-11-30$750,000 Active 1153-char remark
Show marketing remark (1153 chars)
Welcome to a rare investment opportunity: a 16-unit multifamily property located in the heart of Comanche, Texas, the county seat of Comanche County. This strategically positioned asset combines stable cash flow with the charm of a small Central Texas town. With 16 units, the property offers meaningful scale while remaining manageable. In small markets like Comanche, long-term tenants are common, reducing vacancy risk. The city’s stable population, modest income levels, and moderate home values create consistent demand for quality rental housing. This 16-unit complex has been consistently well maintained, reflecting attentive ownership and stable long-term operations. Hold for cash flow or reposition with improvements and reappraise — small-town multifamily often benefits from value-add plays and long-term steadiness. This 16-unit multifamily property in Comanche, Texas, represents a compelling blend of stable income, value-add potential, and community-driven demand. For investors looking to diversify into a low-cost, small-market multifamily play with long-term upside, this asset offers a rare opportunity in Central Texas.
-
2025-11-19$750,000 Active 1147-char remark
Show marketing remark (1147 chars)
Welcome to a rare investment opportunity: a 16-unit multifamily property located in the heart of Comanche, Texas, the county seat of Comanche County. This strategically positioned asset combines stable cash flow with the charm of a small Central Texas town. With 16 units, the property offers meaningful scale while remaining manageable. In small markets like Comanche, long-term tenants are common, reducing vacancy risk. The city's stable population, modest income levels, and moderate home values create consistent demand for quality rental housing. This 16-unit complex has been consistently well maintained, reflecting attentive ownership and stable long-term operations. Hold for cash flow or reposition with improvements and reappraise — small-town multifamily often benefits from value-add plays and long-term steadiness. This 16-unit multifamily property in Comanche, Texas, represents a compelling blend of stable income, value-add potential, and community-driven demand. For investors looking to diversify into a low-cost, small-market multifamily play with long-term upside, this asset offers a rare opportunity in Central Texas.
-
2021-10-26soldstatus
-
1990-06-19soldstatus
ⓘ Source: listings_history table (triggers on properties + properties_extension) + one-shot
backfill from property_details.listing_events for pre-trigger history.
Tax reassessment forecast TX · Resets to sale price
- Current annual tax
- $8,816 · $735/mo
- Projected year-2 tax
- $13,725 · $1,144/mo
- Expected delta
- +$4,909/yr (+$409/mo · 55.7%)
ⓘ Screening estimate from a state-policy table — verify with the county assessor before closing.
Climate risk First Street
- Flood 1/10 Low FEMA zone X · 0% chance over 30 yrs
- Wildfire 6/10 Major
- Heat 7/10 Severe 7 d/yr ≥106°F today · 21 d/yr by 30 yrs out
- Wind 6/10 Major 27% chance of damaging wind over 30 yrs
- Air quality 1/10 Low 0 unhealthy d/yr today · 0 by 30 yrs out
Nearby sold comps map
Loading sold comps map…
Walkable amenities ~0.75 mi
Loading nearby amenities…
Taxation est. · year 1
- Rental income
- $245,832
- − Mortgage interest
- −$42,012
- − Property taxes
- −$8,816
- − Insurance
- −$3,750
- − Repairs & maintenance
- −$19,667
- − Management
- −$19,667
- − Depreciation
- −$21,818
- Taxable income
- $130,103
- Est. tax owed @ 24.0%
- −$31,225
- After-tax cash flow
- $103,219/yr
For passive investors: Depreciation is non-cash, so a rental often shows a tax loss while cash-flowing — sheltering income. Rental losses are passive: they offset passive income freely, and up to $25,000/yr can offset ordinary (W-2) income if you actively participate and your MAGI is under $100k (phasing out to $0 by $150k); unused losses carry forward. On sale, claimed depreciation is recaptured at up to 25%, and gains may owe capital-gains tax (a 1031 exchange can defer both). Figures are a year-1 estimate at your 24.0% rate — not tax advice; consult a CPA.
Schools (NCES district)
- District
- Comanche ISD
- NCES district ID
- 4814760
- Math proficiency
- 39% ▲ 1.00%
- Reading proficiency
- 36% ▼ -4.00%
- Median HH income
- $37,766
- Composite
- 31.27/100
- National rank
- #6024
- State rank
- #484 of 826 in TX
Livability — Comanche
- Score
- 64/100
- State rank
- #763
- US rank
- #13962
Category grades
Schools grade is shown separately in the Schools card above.
Census & demographics
- Census place
- Comanche, TX
- City population
- 7,082
- Population (ZIP)
- 7,082
Population outlook (Comanche County) Hauer SSP2
- Today (2025)
- 12,214 people
- By 2030
- 11,531 · -5.6%
- By 2040
- 10,132 · -17.0%
- By 2050
- 8,724 · -28.6%
- By 2075
- 5,684 · -53.5%
- By 2100
- 3,649 · -70.1%
Race, ethnicity, and origin ACS 2023
- Neighborhood character
- Majority White (60%)
- Race & ethnicity
- White 60% Hispanic / Latino 35% Two or more races 25% Native American 1%
- Hispanic origin (detail)
- Mexican 33%
- Common ancestry
- Italian 5% Slovak 1% Serbian 1%
- Foreign-born
- 10% · Canada
- Languages at home
- 76% English-only · Spanish 23% German/W. Germanic 1%
Political lean MEDSL · Comanche
- 2024 margin
- Solid R (+74.0) · D 12.7% · R 86.8%
- 2008→2024 swing
- -26.5pp toward R · 2008: -47.5pp · 2024: -74.0pp
- All cycles
- 2024: R+74.0 2020: R+71.0 2016: R+67.4 2012: R+62.3 2008: R+47.5
Not yet ingested
- Civics
- —
Market trends
- HPI YoY
- ▼ -41.00%
- Current HPI
- 216.9759
- Rent YoY
- —
- Metro
- —
- State GDP YoY
- ▲ 3.95%
- F500 in state
- 110
Industry mix (Fortune 500 HQ in TX)
| Industry | F500 HQs | Revenue |
|---|---|---|
| Energy | 16 | $1,198B |
|
||
| Technology | 5 | $198B |
|
||
| Engineering / Construction | 4 | $72B |
|
||
| Energy Services | 3 | $60B |
|
||
| Utilities | 3 | $41B |
|
||
| Healthcare | 2 | $330B |
|
||
Price history
+0.0% since first listed5 events — show timeline
- 2026-02-11 Relisted — KVMLS
- 2025-11-30 Listed $750,000 NTREIS
- 2025-11-19 Listed $750,000 KVMLS
- 2021-10-26 Sold (Public Records) — Public Records
- 1990-06-19 Sold (Public Records) — Public Records
Property tax history
+18.0%/yrLatest (2025): $8,816 · +19.3% YoY. Source: county tax records.
Cash-flow waterfall
monthlySold comps — $/sqft
last 12 mo · ≤1 miLoading sold comps…