914 N Midland Blvd Trlr 31 · Nampa, ID
Flood risk 1/10 · Minimal
- FEMA flood zone
- X (unshaded)
- Chance of flooding over 30 yrs
- 0.0%
- Est. flood insurance / yr
- $507 – $1,088
Fire risk 1/10 · Minimal
- Est. fire insurance / yr
- $584 – $1,086
Heat risk 5/10 · Moderate
- Hot days now (above 99°F)
- 7 days/yr
- Hot days in 30 yrs
- 18 days/yr
Wind risk 1/10 · Minimal
- Chance of severe wind over 30 yrs
- —
Air-quality risk 8/10 · Major
- Unhealthy air days now
- 12 days/yr
- Unhealthy air days in 30 yrs
- 19 days/yr
Risk factors via First Street. Map © Google.
Why this score? — see what drove the B grade
The composite is a weighted blend of 9 inputs, each scored 0–100. Each bar is that input's sub-score; the figure is the points it added to the 100-point composite (weight × sub-score).
- Cash flow +30.0/30.0
- 1% rule +10.0/10.0
- DSCR +10.0/10.0
- ARV discount +7.5/15.0
- Rent growth +4.1/5.0
- Livability +3.6/5.0
- Schools +2.7/10.0
- Condition / age +2.5/5.0
- Appreciation +0.0/10.0
$80,000
🖨 Deal sheet 📄 Offer letter ✓ Due diligence
Listing remarks
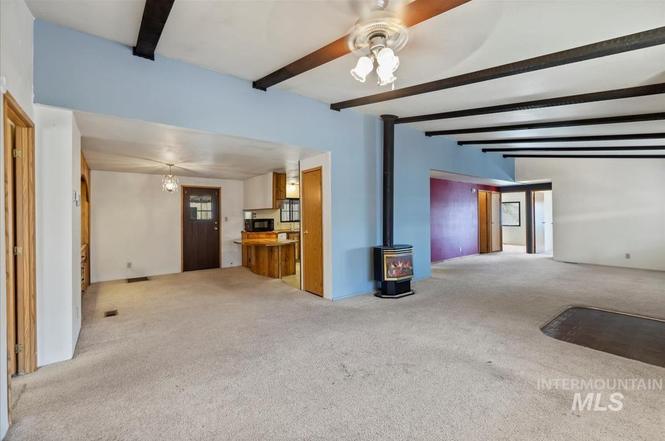
MASSIVE PRICE DROP!!! Complete with New Exterior Paint and several significant updates. Come see why this is the Best Value in the Valley! Welcome to simple, comfortable living in this spacious home located in a quiet 55+ community. With an open layout, generously sized rooms, and plenty of storage throughout, there’s room to settle in and feel right at home. The moment you open the door you are greeted with vaulted ceilings with exposed beams, adding character, and lots of windows to bring in great natural light. The dining area includes a built-in hutch- perfect for everyday use or displaying your favorite pieces. Outside, you’ll find covered parking with a spacious carport, a
Key facts
- Large bedrooms
- Bright open layout
- Exposed beams
Tags
Property features AI
Finance
- HOA & community: Located in an over-55 community/mobile home park (rented lot)
Exterior
- Parking: Covered carport parking for 2 vehicles
- Utilities: City water service; Sewer connected; Cable connected; Electric water heater
- Home design: Mobile/manufactured home in a rented-lot community; Located in an over-55 mobile home park; Built in 1983
- Construction: Composition roof
- Exterior features: Partial block/brick/stone fencing; Covered patio/deck; Auto sprinkler system; Storage shed; Paved road access
Interior
- Kitchen: Kitchen on main level (~11 x 13); Dishwasher; Built-in oven/range; Microwave; Breakfast bar
- Bedrooms: 3 bedrooms all on the main level (Primary: ~13 x 13; Bedroom 2: ~10 x 10; Bedroom 3: ~10 x 13)
- Flooring: Carpet; Laminate
- Bathrooms: 2 bathrooms (including a bath in the primary bedroom)
- Heating & cooling: Forced-air heating (natural gas); Central air conditioning; One fireplace
- Interior features: Primary bedroom with ensuite bath; Main-level bedrooms; Family room; Walk-in closet(s); Breakfast bar
- Laundry & utility: Utility room on main level (~7 x 10); Electric water heater
Neighborhood map
What this means for you Summary
Snapshot
- This is a 3-bed/2.0-bath manufactured listed at $80k.
Deal economics
- At list price, monthly cash flow is $868 ($10k/yr) — positive.
- The deal already cash-flows at list — no discount required.
- Meets the 1% rule at list price ($2k rent vs $80k).
- Recommended offer: $70k (12.0% below list) — sets the bar for market timing.
- Cap rate 19.3% vs local median 3.2% in Nampa — top-decile yield for the area; either an underpriced asset or a hidden risk that comps aren't pricing in. Stress-test before assuming the spread holds.
Location & tenants
- Location reads 72/100 on livability (#47 in ID) — a middle-class / working-renter tenant base. Strengths: housing A+, health & safety A+, cost of living A-; Watch: employment C-, schools D+, amenities F.
- Nampa School District (suburban): math 23% / reading 41% proficiency, ranked #82 of 92 in ID (top 89%) — families likely to look elsewhere, expect single-tenant / working-renter base with shorter leases.
- Market conditions: Rents rising fast (+6.4%/yr); 319 active listings in the ZIP; 18 comparable units currently listed for rent nearby; rentals at typical pace (median 15d on market — plan ~3-4 weeks tenant-placement turnaround); 3,620 units permitted in Canyon County in 2024 (196 in 5+ unit buildings).
Forward outlook
- Local home prices are declining (-3.0%/yr); year-one equity from $553 of loan paydown is wiped out by about $2k of value loss. Plan a longer hold.
- Canyon County population projected at +41% by 2050 — long-run rental-demand tailwind backs the buy-and-hold thesis.
- At projected returns (-3.0% appreciation + 6.4% rent growth), your $22k cash investment doubles in ~3 years — after that, you're playing with house money.
Negotiation context
- It's been on market 372 days — a 12% lower offer ($70k) is reasonable based on typical stale-listing flexibility.
- 3 sale attempts since 9y ago; this cycle's ask has dropped $45k (36%) from the opening price — seller is motivated, your offer sets the floor, not the list.
Risks & watch-outs
- Climate carrying-cost: extreme-heat days projected 7→18/yr by 2055 (HVAC capex compounding) — expect insurance premiums to compound above CPI over the hold.
Questions for the listing agent
- It's been on market 372 days. Have you received any prior offers? Is the seller open to a 12% concession, seller financing, or rate buy-down credit?
- Why hasn't it sold? Are there any deal-killer items the seller is aware of (foundation, flood, title, zoning, code violations)?
- Is there a deadline driving the sale (1031 exchange, divorce, estate, relocation)? That informs how much negotiation room exists.
- Schools are D-rated, which usually means shorter tenancies and higher turnover. Who's the typical renter profile here, and what's been the actual vacancy rate?
- What's the average days-on-market for RENTAL listings here right now (not sales)? A rising rental-DOM trend means longer vacancies and softer asking-rent achievability than the comps imply.
- What's the recent tenant-quality profile in this submarket — average credit score on applications, eviction rate, late-payment / NSF rate, and stable-employment percentage? A property-management company in the area should have these aggregated.
- How much new for-sale + rental construction is in the pipeline within 1–3 miles? Heavy new supply typically softens prices + rents 12–24 months out; constrained supply supports both.
Investment metrics
- 1% rule
- 2.13% ✓
- Cap rate
- 19.31%
- Cash-on-cash
- 46.50%
- DSCR
- 3.07
- GRM
- 3.9
CMA / ARV
- ARV (on-the-fly)
- $188,160
- Comps found
- 12
Show comp detail 12 sales within ~0.75 mi
| Address | Dist | Beds/Ba | Sqft | Sold | Price | $/sf | Match |
|---|---|---|---|---|---|---|---|
| 1907 W Flamingo Ave Unit 43 | 0.61mi | 3/2.0 | 1,632 (-3%) | 2mo | $179,995 | $110 | 65 |
| 1907 W Flamingo Ave #88 | 0.61mi | 3/2.0 | 1,600 (-5%) | 5mo | $179,800 | $112 | 59 |
| 1907 Flamingo Ave #124 | 0.61mi | 3/2.0 | 1,782 (+6%) | 5mo | $199,900 | $112 | 57 |
| 1907 W Flamingo Ave #39 | 0.61mi | 3/2.0 | 1,626 (-3%) | 14mo | $172,500 | $106 | 54 |
| 1907 W Flamingo #69 #69 | 0.61mi | 3/2.0 | 1,513 (-10%) | 1mo | $168,000 | $111 | 54 |
| 1907 W Flamingo Ave Trlr 118 | 0.61mi | 3/2.0 | 1,570 (-6%) | 9mo | $189,000 | $120 | 53 |
| 1907 W Flamingo Ave #100 | 0.61mi | 3/2.0 | 1,508 (-10%) | 3mo | $189,000 | $125 | 52 |
| 1907 W Flamingo Ave #134 | 0.61mi | 3/2.0 | 1,765 (+5%) | 19mo | $195,000 | $110 | 47 |
| 1410 Flamingo Ave #49 | 0.64mi | 3/2.0 | 1,440 (-14%) | 2mo | $79,900 | $55 | 45 |
| 1907 W Flamingo Ave #152 | 0.61mi | 2/2.0 (-1) | 1,452 (-14%) | 3mo | $160,000 | $110 | 42 |
| 1410 Eldoran Dr | 0.56mi | 2/2.0 (-1) | 1,545 (-8%) | 17mo | $289,500 | $187 | 41 |
| 1907 W Flamingo Ave Unit 86 #86 | 0.61mi | 2/2.0 (-1) | 1,486 (-12%) | 11mo | $189,086 | $127 | 38 |
Match score weights: distance 35% · size 25% · config 20% · recency 20%. Top-matched comps best support the ARV.
Projected returns pro-forma
-3.0% appreciation · 6.41% rent growth · sell at horizon
- IRR
- 47.4%
- Equity multiple
- 3.16×
- Total profit
- $48,336
- Equity at exit
- $11,928
- IRR
- 54.4%
- Equity multiple
- 7.24×
- Total profit
- $139,761
- Equity at exit
- $6,917
Cash invested: $22,400 (down + closing). Projections, not guarantees.
Landlord ↔ Tenant lean methodology
- Overall (STATE)
- 91 Strongly Landlord-Friendly
- State Idaho
- 91 Strongly Landlord-Friendly · R+18
- County
- — inherits STATE
- City
- — inherits STATE
ZIP-level market 83651
- Home prices YoY
- -28.3%
- Rents YoY
- 6.4%
- Active inventory
- 319
- Price-to-rent
- 3.9×
Monthly cashflow live
- Estimated rent
- $1,701 high interval (Pro) →
- Mortgage (P&I)
- −$420
- Tax from tax record
- −$23 /mo · $277/yr
- Insurance
- −$33
- HOA
- −$0
- Vacancy / Maint / Mgmt
- −$357
- Net cashflow
- $868
Break-even live
UW: 25.0% down · 7.5% · 30yr · 1.5% tax · 5.0% vac · 8.0% maint · 8.0% mgmt
Financing live
Cash to close
- Down payment
- $20,000
- Closing costs
- $2,400
- Reserves months
- —
- Total cash needed
- —
Loan-product check · same deal, 3 products live
Conventional
25% down · 7.5% · 30yr
- Down + closing
- —
- Monthly P&I
- —
- Monthly cashflow
- —
- DSCR
- —
- Eligible?
- —
Personal DTI + credit; lowest rate.
DSCR
20% down · 8.5% · 30yr
- Down + closing
- —
- Monthly P&I
- —
- Monthly cashflow
- —
- DSCR
- —
- Eligible?
- —
No personal income docs; deal must DSCR.
Hard money
10% down · 12.0% · 12mo
- Down + closing
- —
- Monthly P&I
- —
- Monthly cashflow
- —
- DSCR
- —
- Eligible?
- —
Short-term bridge; refi at stabilization.
Rent comps 18 comps
| Address | Beds | Baths | Sqft | Rent | $/sqft | DOM | Units | Dist |
|---|---|---|---|---|---|---|---|---|
| 1215 N Benewah St Nampa, ID | 3.0 | 2.0 | 1219 | $1,250 | $1.03 | 14d | 1 | 0.18mi |
| 450 W Orchard Ave Nampa, ID | 1.0–3.0 | 1.0–2.0 | 1129 | $1,699 | $1.50 | 3d | 11 | 0.32mi |
| 1275 Caldwell Blvd Nampa, ID | 1.0–3.0 | 1.0–2.0 | 921 | $1,900 | $2.06 | 23d | 1 | 0.63mi |
| 617 Purple Sage Dr Nampa, ID | 3.0 | 2.0 | 1104 | $1,795 | $1.63 | 23d | 1 | 0.65mi |
| 1820 W Camelot Dr Nampa, ID | 3.0 | 2.0 | 1400 | $2,195 | $1.57 | 3d | 1 | 0.70mi |
| 123 Trifecta Ln Nampa, ID | 3.0 | 2.5 | 1505 | $1,795 | $1.19 | 11d | 1 | 0.76mi |
| 2084 W Bella Ln Unit 1460910P Nampa, ID | 3.0 | 2.0 | 1237 | $3,905 | $3.16 | 23d | 1 | 0.84mi |
| 16060 N Merchant Way Nampa, ID | 2.0–3.0 | 2.0 | 1115 | $1,695 | $1.52 | 2d | 1 | 0.91mi |
| 9848 W Sand Hill Dr Nampa, ID | 1.0–3.0 | 1.0–2.0 | 1008 | $1,650 | $1.64 | 23d | 1 | 1.06mi |
| 121 E Ravenna Ln Unit 121 Nampa, ID | 3.0 | 2.5 | 1400 | $1,650 | $1.18 | 23d | 1 | 1.14mi |
| 130 E Ravenna Ln Unit 116 Nampa, ID | 3.0 | 2.5 | 1452 | $1,800 | $1.24 | 3d | 1 | 1.17mi |
| 427 1st Ave N Unit 102 Nampa, ID | 2.0 | 2.5 | 1189 | $1,350 | $1.14 | 14d | 1 | 1.18mi |
| 431 1st Ave N Unit 101 Nampa, ID | 2.0 | 2.5 | 1189 | $1,350 | $1.14 | 14d | 1 | 1.20mi |
| 15690 N Knightgate Ln Nampa, ID | 2.0–3.0 | 2.0–3.0 | 1239 | $1,825 | $1.47 | 2d | 3 | 1.23mi |
| 11130 W Ashburn Ln Nampa, ID | 2.0 | 2.0 | 1106 | $1,650 | $1.49 | 14d | 2 | 1.26mi |
| 2410 W Vanderbilt Ln Nampa, ID | 1.0–3.0 | 1.0–2.0 | 1029 | $2,425 | $2.36 | 2d | 30 | 1.31mi |
| 11215 W Ashburn Ln Nampa, ID | 2.0–3.0 | 2.0–3.0 | 1176 | $1,825 | $1.55 | 2d | 2 | 1.33mi |
| 11214 W Ashburn Ln Nampa, ID | 3.0 | 3.0 | 1301 | $1,825 | $1.40 | 2d | 2 | 1.35mi |
Listing history 22 events
-
2026-06-18days on market $80,000 Active 372 DOM
-
2026-06-17days on market $80,000 Active 371 DOM
-
2026-06-16days on market $80,000 Active 370 DOM
-
2026-06-15days on market $80,000 Active 369 DOM
-
2026-06-13days on market $80,000 Active 367 DOM
-
2026-06-10days on market $80,000 Active 364 DOM
-
2026-06-09days on market $80,000 Active 363 DOM
-
2026-06-08days on market $80,000 Active 362 DOM
-
2026-06-07pricedays on market $80,000 Active 361 DOM
-
2026-06-03days on market $99,900 Active 357 DOM
-
2026-06-03days on market $99,900 Active 356 DOM
-
2026-06-01days on market $99,900 Active 355 DOM
-
2026-05-31days on market $99,900 Active 354 DOM
-
2026-01-24price $99,900
-
2025-12-06price $109,900
-
2025-08-08price $114,900
-
2025-06-11$124,900 Active
-
2025-05-31historical
-
2025-02-19$140,000 Active
-
2018-03-21soldstatus Sold
-
2017-09-19historical
-
2017-06-05$44,900
ⓘ Source: listings_history table (triggers on properties + properties_extension) + one-shot
backfill from property_details.listing_events for pre-trigger history.
Tax reassessment forecast ID · Resets to sale price
- Current annual tax
- $277 · $23/mo
- Projected year-2 tax
- $552 · $46/mo
- Expected delta
- +$275/yr (+$23/mo · 99.1%)
ⓘ Screening estimate from a state-policy table — verify with the county assessor before closing.
Climate risk First Street
- Flood 1/10 Low FEMA zone X (unshaded) · 0% chance over 30 yrs
- Wildfire 1/10 Low
- Heat 5/10 Major 7 d/yr ≥99°F today · 18 d/yr by 30 yrs out
- Wind 1/10 Low
- Air quality 8/10 Severe 12 unhealthy d/yr today · 19 by 30 yrs out
Nearby sold comps map
Loading sold comps map…
Walkable amenities ~0.75 mi
Loading nearby amenities…
Taxation est. · year 1
- Rental income
- $20,415
- − Mortgage interest
- −$4,481
- − Property taxes
- −$277
- − Insurance
- −$400
- − Repairs & maintenance
- −$1,633
- − Management
- −$1,633
- − Depreciation
- −$2,327
- Taxable income
- $9,663
- Est. tax owed @ 24.0%
- −$2,319
- After-tax cash flow
- $8,097/yr
For passive investors: Depreciation is non-cash, so a rental often shows a tax loss while cash-flowing — sheltering income. Rental losses are passive: they offset passive income freely, and up to $25,000/yr can offset ordinary (W-2) income if you actively participate and your MAGI is under $100k (phasing out to $0 by $150k); unused losses carry forward. On sale, claimed depreciation is recaptured at up to 25%, and gains may owe capital-gains tax (a 1031 exchange can defer both). Figures are a year-1 estimate at your 24.0% rate — not tax advice; consult a CPA.
Schools (NCES district)
- District
- Nampa School District
- NCES district ID
- 1602340
- Math proficiency
- 23% ▼ -13.00%
- Reading proficiency
- 41% ▼ -9.00%
- Median HH income
- $43,576
- Composite
- 27.18/100
- National rank
- #7022
- State rank
- #82 of 92 in ID
Livability — Nampa
- Score
- 72/100
- State rank
- #47
- US rank
- #6250
Category grades
Schools grade is shown separately in the Schools card above.
Census & demographics
- Census place
- Nampa, ID
- County
- Canyon County · 235,358 people
- City population
- 142,249
- Metro
- Boise City, ID
- Population (ZIP)
- 38,121
- Household income
- $69,914
- Rent vs Own
- Severe rent burden
- 723.0
Population outlook (Canyon County) Hauer SSP2
- Today (2025)
- 248,853 people
- By 2030
- 269,596 · +8.3%
- By 2040
- 311,081 · +25.0%
- By 2050
- 350,809 · +41.0%
- By 2075
- 441,884 · +77.6%
- By 2100
- 505,641 · +103.2%
Race, ethnicity, and origin ACS 2023
- Neighborhood character
- Predominantly White (70%)
- Race & ethnicity
- White 70% Hispanic / Latino 24% Two or more races 11%
- Hispanic origin (detail)
- Mexican 20%
- Common ancestry
- Portuguese 3% Slovak 2% Lithuanian 2%
- Foreign-born
- 8% · Canada, Vietnam
- Languages at home
- 81% English-only · Spanish 16% German/W. Germanic 1% Russian/Polish/Slavic 1%
Political lean MEDSL · Canyon
- 2024 margin
- Solid R (+46.6) · D 25.4% · R 72.0% · Other 2.5%
- 2008→2024 swing
- -11.4pp toward R · 2008: -35.2pp · 2024: -46.6pp
- All cycles
- 2024: R+46.6 2020: R+39.7 2016: R+41.8 2012: R+37.1 2008: R+35.2
Not yet ingested
- Civics
- —
Market trends
- HPI YoY
- ▼ -132.40%
- Current HPI
- 335.6717
- Rent YoY
- ▲ 6.41%
- Metro
- Boise City, ID
- State GDP YoY
- ▲ 4.51%
- F500 in state
- 6
Industry mix (Fortune 500 HQ in ID)
| Industry | F500 HQs | Revenue |
|---|---|---|
| Retail | 1 | $79B |
|
||
| Technology | 1 | $25B |
|
||
| Food / Agriculture | 1 | $6B |
|
||
Price history
+122.5% since first listed9 events — show timeline
- 2026-01-24 Price Changed $99,900 IMLS
- 2025-12-06 Price Changed $109,900 IMLS
- 2025-08-08 Price Changed $114,900 IMLS
- 2025-06-11 Listed $124,900 IMLS
- 2025-05-31 Listing Removed — IMLS
- 2025-02-19 Listed $140,000 IMLS
- 2018-03-21 Sold (MLS) — IMLS
- 2017-09-19 Listing Removed — IMLS
- 2017-06-05 Listed $44,900 IMLS
Property tax history
+3.3%/yrLatest (2025): $277 · +89.7% YoY. Source: county tax records.
Cash-flow waterfall
monthlySold comps — $/sqft
last 12 mo · ≤1 miLoading sold comps…