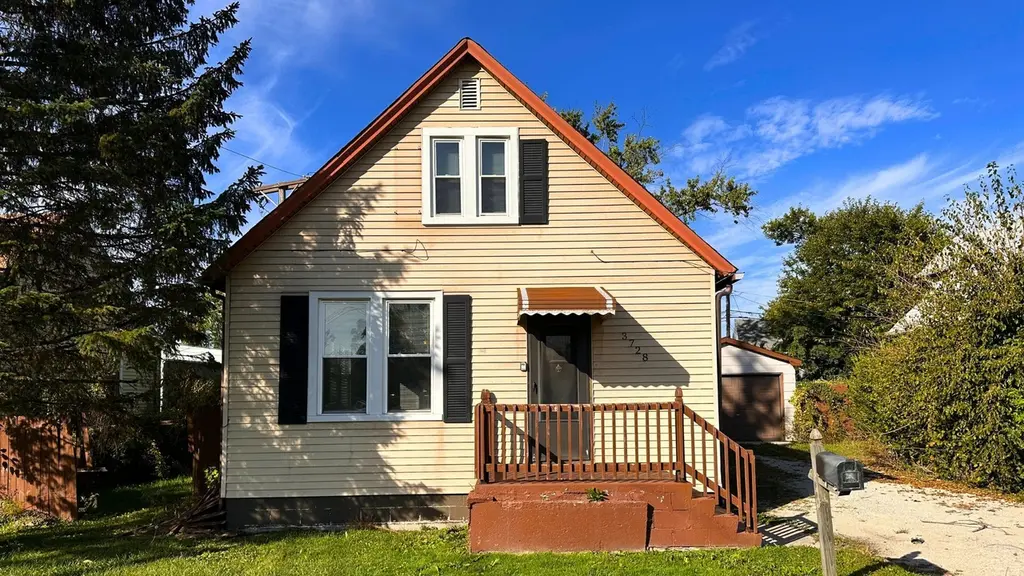
3728 Chicago Rd · Steger, IL
Flood risk 1/10 · Minimal
- FEMA flood zone
- X (unshaded)
- Chance of flooding over 30 yrs
- 0.0%
- Est. flood insurance / yr
- $507 – $1,088
Fire risk 1/10 · Minimal
- Est. fire insurance / yr
- $804 – $1,492
Heat risk 3/10 · Minor
- Hot days now (above 101°F)
- 7 days/yr
- Hot days in 30 yrs
- 16 days/yr
Wind risk 2/10 · Minimal
- Chance of severe wind over 30 yrs
- —
Air-quality risk 2/10 · Minimal
- Unhealthy air days now
- 2 days/yr
- Unhealthy air days in 30 yrs
- 2 days/yr
Risk factors via First Street. Map © Google.
Why this score? — see what drove the B- grade
The composite is a weighted blend of 9 inputs, each scored 0–100. Each bar is that input's sub-score; the figure is the points it added to the 100-point composite (weight × sub-score).
- Cash flow +30.0/30.0
- 1% rule +10.0/10.0
- DSCR +10.0/10.0
- ARV discount +7.5/15.0
- Livability +3.4/5.0
- Rent growth +2.5/5.0
- Condition / age +2.5/5.0
- Schools +0.7/10.0
- Appreciation +0.0/10.0
$107,000
🖨 Deal sheet (PDF) 📄 Offer letter ✓ Due diligence
Listing remarks MLS
HANDY MAN SPECIAL! This 3 Bedroom 1 Bath Home is being sold "As-Is" and includes a 1-car detached Garage. Seller will not furnish Survey or Termite Inspection. Come take a look today!
Key facts
- Rear mudroom
- Large walk-in pantry
- Garage
Tags
Property features AI
Finance
- Other: Immediate possession; Listing brokerage: eXp Realty
- HOA & community: No master association fee required
Exterior
- Parking: Detached garage (1 garage space, 1 total parking space)
- Utilities: Public water; Public sewer
- Home design: Detached single-family home; 1.5-story design; Fee simple ownership; Property is over 100 years old; Built before 1978
- Construction: Aluminum siding
- Exterior features: Lot under 0.25 acre; Lot dimensions listed as 5227
Interior
- Kitchen: Kitchen (Main level, 12 x 9)
- Bedrooms: Master bedroom (Second level, 20 x 11); Bedroom (Main level, 10 x 8); Bedroom 2 (Main level, 9 x 9); Bedroom 3 (Main level, 9 x 9)
- Bathrooms: 1 full bathroom
- Heating & cooling: Natural gas forced-air heating; Central air conditioning
- Interior features: Crawl space basement; Mud room; Dining room; Family room; Living room
- Laundry & utility: Laundry room
Neighborhood map
What this means for you Summary
Snapshot
- This is a 3-bed/1.0-bath other listed at $107k.
Deal economics
- At list price, monthly cash flow is $476 ($6k/yr) — positive.
- The deal already cash-flows at list — no discount required.
- Meets the 1% rule at list price ($2k rent vs $107k).
- Cap rate 11.6% vs local median 5.1% in Steger — top-decile yield for the area; either an underpriced asset or a hidden risk that comps aren't pricing in. Stress-test before assuming the spread holds.
Location & tenants
- Location reads 67/100 on livability (#498 in IL) — a middle-class / working-renter tenant base. Strengths: commute A+, cost of living A+, housing A+; Watch: employment C-, health & safety D+, amenities F.
- Bloom Twp Hsd 206 (suburban): math 8% / reading 9% proficiency, ranked #591 of 620 in IL (top 95%) — low school quality limits family demand, transient renter base, plan for 1-2y turnover.
- Zoned schools: Steger Intermediate Center (math 2% / reading 8%, grade F, #1,741 of 2,056 statewide, top 93%, 446 students, 0% FRL); Columbia Central School (math 7% / reading 17%, grade F, #562 of 665 statewide, top 86%, 616 students, 0% FRL); Bloom Trail High School (math 12% / reading 12%, grade F, #511 of 693 statewide, top 75%, 1,227 students, 0% FRL).
- Market conditions: 43 active listings in the ZIP; 4 comparable units currently listed for rent nearby; rentals at typical pace (median 27d on market — plan ~3-4 weeks tenant-placement turnaround); 2,028 units permitted in Will County in 2024 (530 in 5+ unit buildings).
Forward outlook
- Local home prices are declining (-3.0%/yr); year-one equity from $740 of loan paydown is wiped out by about $3k of value loss. Plan a longer hold.
- Will County population projected to shrink 4% by 2050 — rents likely to lag national; underwrite the cash flow, not the appreciation.
- At projected returns (-3.0% appreciation + 3.0% rent growth), your $30k cash investment doubles in ~7 years — after that, you're playing with house money.
Negotiation context
- Only 10 days on market — expect competitive offers; lowballing is unlikely to land.
- 6 sale attempts since 16y ago; this cycle's ask has dropped $43k (29%) from the opening price — seller is motivated, your offer sets the floor, not the list.
Risks & watch-outs
- Watch-outs: property tax is 4.6% of price; built in 1900 — expect roof / HVAC / electrical / plumbing capex.
Questions for the listing agent
- Built in 1900 — when were the roof, HVAC, electrical panel, plumbing, and water heater last replaced?
- Property tax is high relative to price — has the assessment been appealed recently, and will the sale trigger a re-assessment?
- Is there a deadline driving the sale (1031 exchange, divorce, estate, relocation)? That informs how much negotiation room exists.
- Schools are F-rated, which usually means shorter tenancies and higher turnover. Who's the typical renter profile here, and what's been the actual vacancy rate?
- What's the average days-on-market for RENTAL listings here right now (not sales)? A rising rental-DOM trend means longer vacancies and softer asking-rent achievability than the comps imply.
- What's the recent tenant-quality profile in this submarket — average credit score on applications, eviction rate, late-payment / NSF rate, and stable-employment percentage? A property-management company in the area should have these aggregated.
- How much new for-sale + rental construction is in the pipeline within 1–3 miles? Heavy new supply typically softens prices + rents 12–24 months out; constrained supply supports both.
Investment metrics
- 1% rule
- 1.76% ✓
- Cap rate
- 11.63%
- Cash-on-cash
- 19.06%
- DSCR
- 1.85
- GRM
- 4.7
CMA / ARV
No comps found within radius.
Projected returns pro-forma
-3.0% appreciation · 3.0% rent growth · sell at horizon
- IRR
- 11.1%
- Equity multiple
- 1.44×
- Total profit
- $13,168
- Equity at exit
- $15,954
- IRR
- 20.2%
- Equity multiple
- 2.71×
- Total profit
- $51,299
- Equity at exit
- $9,251
Cash invested: $29,960 (down + closing). Projections, not guarantees.
Landlord ↔ Tenant lean methodology
- Overall (STATE)
- 43 Moderately Tenant-Leaning
- State Illinois
- 43 Moderately Tenant-Leaning · D+7
- County
- — inherits STATE
- City
- — inherits STATE
ZIP-level market 60475
- Active inventory
- 43
- Price-to-rent
- 4.7×
Monthly cashflow live
- Estimated rent
- $1,888 medium interval (Pro) →
- Mortgage (P&I)
- −$561
- Tax from tax record
- −$410 /mo · $4,920/yr
- Insurance
- −$45
- HOA
- −$0
- Vacancy / Maint / Mgmt
- −$396
- Net cashflow
- $476
Break-even live
Sensitivity live
| Price | -10% $826 | -5% $506 | +0% $476 | +5% $446 | +10% $415 |
|---|---|---|---|---|---|
| Rent | -10% $327 | -5% $401 | +0% $476 | +5% $550 | +10% $625 |
| Rate | -1.0pp $530 | -0.5pp $503 | base $476 | +0.5pp $448 | +1.0pp $420 |
UW: 25.0% down · 7.5% · 30yr · 1.5% tax · 5.0% vac · 8.0% maint · 8.0% mgmt
Financing live
Cash to close
- Down payment
- $26,750
- Closing costs
- $3,210
- Reserves months
- —
- Total cash needed
- —
Loan-product check · same deal, 3 products live
Conventional
25% down · 7.5% · 30yr
- Down + closing
- —
- Monthly P&I
- —
- Monthly cashflow
- —
- DSCR
- —
- Eligible?
- —
Personal DTI + credit; lowest rate.
DSCR
20% down · 8.5% · 30yr
- Down + closing
- —
- Monthly P&I
- —
- Monthly cashflow
- —
- DSCR
- —
- Eligible?
- —
No personal income docs; deal must DSCR.
Hard money
10% down · 12.0% · 12mo
- Down + closing
- —
- Monthly P&I
- —
- Monthly cashflow
- —
- DSCR
- —
- Eligible?
- —
Short-term bridge; refi at stabilization.
Rent comps 4 comps
| Address | Beds | Baths | Sqft | Rent | $/sqft | DOM | Units | Dist |
|---|---|---|---|---|---|---|---|---|
| 3763 Emerald Ave Steger, IL | 3.0 | 1.0 | 1125 | $1,950 | $1.73 | 26d | 1 | 0.15mi |
| 3135 Chicago Rd Unit 2nd Steger, IL | 2.0 | 1.0 | 1300 | $1,650 | $1.27 | 26d | 1 | 0.76mi |
| 316 W 34th St Steger, IL | 3.0 | 1.0–1.5 | 720 | $1,715 | $2.38 | 0d | 5 | 0.93mi |
| 236 Chestnut Ave Unit S South Chicago Heights, IL | 3.0 | 1.0 | 1032 | $2,000 | $1.94 | 26d | 1 | 1.36mi |
Listing history 41 events
-
2026-06-21days on market $107,000 Active 10 DOM
-
2026-06-18days on market $107,000 Active 7 DOM
-
2026-06-17days on market $107,000 Active 6 DOM
-
2026-06-16days on market $107,000 Active 5 DOM
-
2026-06-15days on market $107,000 Active 4 DOM
-
2026-06-13days on market $107,000 Active 2 DOM
-
2026-06-13days on market $107,000 Active 1 DOM
-
2026-06-09days on market $107,000 Active 243 DOM
-
2026-06-08days on market $107,000 Active 242 DOM
-
2026-06-07pricedays on market $107,000 Active 241 DOM
-
2026-06-04days on market $110,000 Active 238 DOM
-
2026-06-03days on market $110,000 Active 237 DOM
-
2026-06-02days on market $110,000 Active 236 DOM
-
2026-06-01days on market $110,000 Active 235 DOM
-
2026-05-31days on market $110,000 Active 234 DOM
-
2026-05-04status Active
-
2026-05-04price $110,000
-
2026-04-06historical Contingent - Continue to Show
-
2026-03-27price $122,000
-
2026-02-27price $125,000
-
2026-02-06price $128,000
-
2026-01-16price $132,000
-
2025-12-19price $136,000
-
2025-11-21price $142,000
-
2025-10-31price $146,000
-
2025-10-09$150,000 Active
-
2015-09-04soldstatus $4,466,598
-
2013-02-20soldstatus $25,000
-
2013-02-11soldstatus $25,000 Closed Sale 193-char remark
Show marketing remark (193 chars)
HANDY MAN SPECIAL! This 3 Bedroom 1 Bath Home is being sold "As-Is" and includes a 1-car detached Garage. Seller will not furnish Survey or Termite Inspection. Come take a look today!
-
2013-01-02status Pending 193-char remark
Show marketing remark (193 chars)
HANDY MAN SPECIAL! This 3 Bedroom 1 Bath Home is being sold "As-Is" and includes a 1-car detached Garage. Seller will not furnish Survey or Termite Inspection. Come take a look today!
-
2012-12-05$29,900 New 193-char remark
Show marketing remark (193 chars)
HANDY MAN SPECIAL! This 3 Bedroom 1 Bath Home is being sold "As-Is" and includes a 1-car detached Garage. Seller will not furnish Survey or Termite Inspection. Come take a look today!
-
2012-05-02soldstatus $20,001
-
2012-04-11soldstatus $20,001
-
2011-10-29soldstatus $45,000 Closed Sale 107-char remark
Show marketing remark (107 chars)
NICE SOLID HOME FOR THE MONEY. ENCLOSED BACK PORCH. SIDE DRIVE WITH GARAGE. COME AND TAKE A PEEK TODAY!!
-
2011-06-28$108,000 New 107-char remark
Show marketing remark (107 chars)
NICE SOLID HOME FOR THE MONEY. ENCLOSED BACK PORCH. SIDE DRIVE WITH GARAGE. COME AND TAKE A PEEK TODAY!!
-
2011-06-21historical
-
2010-12-03New
-
2010-12-01historical
-
2010-11-18New
-
1998-05-06soldstatus $75,000
-
1990-03-14soldstatus $43,900
ⓘ Source: listings_history table (triggers on properties + properties_extension) + one-shot
backfill from property_details.listing_events for pre-trigger history.
Tax reassessment forecast IL · Partial reset (capped growth)
- Current annual tax
- $4,920 · $410/mo
- Projected year-2 tax
- $4,920 · $410/mo
- Expected delta
- $0/yr ($0/mo · 0.0%)
ⓘ Screening estimate from a state-policy table — verify with the county assessor before closing.
Climate risk First Street
- Flood 1/10 Low FEMA zone X (unshaded) · 0% chance over 30 yrs
- Wildfire 1/10 Low
- Heat 3/10 Moderate 7 d/yr ≥101°F today · 16 d/yr by 30 yrs out
- Wind 2/10 Low
- Air quality 2/10 Low 2 unhealthy d/yr today · 2 by 30 yrs out
Nearby sold comps map
Loading sold comps map…
Walkable amenities ~0.75 mi
Loading nearby amenities…
Taxation est. · year 1
- Rental income
- $22,656
- − Mortgage interest
- −$5,994
- − Property taxes
- −$4,920
- − Insurance
- −$535
- − Repairs & maintenance
- −$1,812
- − Management
- −$1,812
- − Depreciation
- −$3,113
- Taxable income
- $4,470
- Est. tax owed @ 24.0%
- −$1,073
- After-tax cash flow
- $4,638/yr
For passive investors: Depreciation is non-cash, so a rental often shows a tax loss while cash-flowing — sheltering income. Rental losses are passive: they offset passive income freely, and up to $25,000/yr can offset ordinary (W-2) income if you actively participate and your MAGI is under $100k (phasing out to $0 by $150k); unused losses carry forward. On sale, claimed depreciation is recaptured at up to 25%, and gains may owe capital-gains tax (a 1031 exchange can defer both). Figures are a year-1 estimate at your 24.0% rate — not tax advice; consult a CPA.
Schools (NCES district)
- District
- Bloom Twp Hsd 206
- NCES district ID
- 1706420
- Math proficiency
- 8% ▼ -3.00%
- Reading proficiency
- 9% ▼ -8.00%
- Median HH income
- $39,795
- Composite
- 7.4/100
- National rank
- #9952
- State rank
- #591 of 620 in IL
Livability — Steger
- Score
- 67/100
- State rank
- #498
- US rank
- #10279
Category grades
Schools grade is shown separately in the Schools card above.
Census & demographics
- Census place
- Steger, IL
- City population
- 10,103
- Population (ZIP)
- 10,103
Population outlook (Will County) Hauer SSP2
- Today (2025)
- 705,368 people
- By 2030
- 708,154 · +0.4%
- By 2040
- 702,692 · -0.4%
- By 2050
- 680,249 · -3.6%
- By 2075
- 611,990 · -13.2%
- By 2100
- 516,215 · -26.8%
Race, ethnicity, and origin ACS 2023
- Neighborhood character
- Diverse neighborhood (Simpson 0.65)
- Race & ethnicity
- White 52% Hispanic / Latino 23% Black 18% Two or more races 11% Asian 1%
- Hispanic origin (detail)
- Mexican 21%
- Common ancestry
- Romanian 5% Lithuanian 1% Italian 1%
- Foreign-born
- 7% · Canada, South Korea
- Languages at home
- 85% English-only · Spanish 13% Other Indo-European 1%
Political lean MEDSL · Will
- 2024 margin
- Toss-up / Even · D 50.1% · R 48.5% · Other 1.4%
- 2008→2024 swing
- -11.6pp toward R · 2008: 13.2pp · 2024: 1.6pp
- All cycles
- 2024: D+1.6 2020: D+8.3 2016: D+5.7 2012: D+3.7 2008: D+13.2
Not yet ingested
- Civics
- —
Market trends
- HPI YoY
- ▼ -92.95%
- Current HPI
- 134.0677
- Rent YoY
- —
- Metro
- —
- State GDP YoY
- ▲ 1.59%
- F500 in state
- 60
Industry mix (Fortune 500 HQ in IL)
| Industry | F500 HQs | Revenue |
|---|---|---|
| Insurance | 4 | $201B |
|
||
| Consumer Goods | 4 | $87B |
|
||
| Industrial Machinery | 3 | $64B |
|
||
| Healthcare | 2 | $55B |
|
||
| Retail / Pharmacy | 1 | $148B |
|
||
| Agriculture / Food | 1 | $86B |
|
||
Price history
+150.6% since first listed26 events — show timeline
- 2026-05-04 Relisted — MRED as Distributed by MLS Grid
- 2026-05-04 Price Changed $110,000 MRED as Distributed by MLS Grid
- 2026-04-06 Contingent — MRED as Distributed by MLS Grid
- 2026-03-27 Price Changed $122,000 MRED as Distributed by MLS Grid
- 2026-02-27 Price Changed $125,000 MRED as Distributed by MLS Grid
- 2026-02-06 Price Changed $128,000 MRED as Distributed by MLS Grid
- 2026-01-16 Price Changed $132,000 MRED as Distributed by MLS Grid
- 2025-12-19 Price Changed $136,000 MRED as Distributed by MLS Grid
- 2025-11-21 Price Changed $142,000 MRED as Distributed by MLS Grid
- 2025-10-31 Price Changed $146,000 MRED as Distributed by MLS Grid
- 2025-10-09 Listed $150,000 MRED as Distributed by MLS Grid
- 2015-09-04 Sold (Public Records) $4,466,598 Public Records
- 2013-02-20 Sold (Public Records) $25,000 Public Records
- 2013-02-11 Sold (MLS) $25,000 MRED as Distributed by MLS Grid
- 2013-01-02 Pending — MRED as Distributed by MLS Grid
- 2012-12-05 Listed $29,900 MRED as Distributed by MLS Grid
- 2012-05-02 Sold (Public Records) $20,001 Public Records
- 2012-04-11 Sold (Public Records) $20,001 Public Records
- 2011-10-29 Sold (MLS) $45,000 MRED as Distributed by MLS Grid
- 2011-06-28 Listed $108,000 MRED as Distributed by MLS Grid
- 2011-06-21 Listing Removed — MRED as Distributed by MLS Grid
- 2010-12-03 Listed — MRED as Distributed by MLS Grid
- 2010-12-01 Listing Removed — MRED as Distributed by MLS Grid
- 2010-11-18 Listed — MRED as Distributed by MLS Grid
- 1998-05-06 Sold (Public Records) $75,000 Public Records
- 1990-03-14 Sold (Public Records) $43,900 Public Records
Property tax history
+4.2%/yrLatest (2024): $4,920 · +5.6% YoY. Source: county tax records.
Cash-flow waterfall
monthlySold comps — $/sqft
last 12 mo · ≤1 miLoading sold comps…