735 Woodside Dr · Richwood, NJ
Flood risk 1/10 · Minimal
- FEMA flood zone
- X (unshaded)
- Chance of flooding over 30 yrs
- 0.0%
- Est. flood insurance / yr
- $507 – $1,088
Fire risk 3/10 · Minor
- Est. fire insurance / yr
- $526 – $976
Heat risk 6/10 · Moderate
- Hot days now (above 104°F)
- 7 days/yr
- Hot days in 30 yrs
- 15 days/yr
Wind risk 6/10 · Moderate
- Chance of severe wind over 30 yrs
- 56.0%
Air-quality risk 3/10 · Minor
- Unhealthy air days now
- 2 days/yr
- Unhealthy air days in 30 yrs
- 5 days/yr
Risk factors via First Street. Map © Google.
Why this score? — see what drove the B- grade
The composite is a weighted blend of 9 inputs, each scored 0–100. Each bar is that input's sub-score; the figure is the points it added to the 100-point composite (weight × sub-score).
- Cash flow +27.4/30.0
- 1% rule +10.0/10.0
- DSCR +9.6/10.0
- ARV discount +7.5/15.0
- Schools +4.1/10.0
- Livability +3.2/5.0
- Rent growth +2.5/5.0
- Condition / age +2.5/5.0
- Appreciation +0.0/10.0
$139,900
🖨 Deal sheet (PDF) 📄 Offer letter ✓ Due diligence
Listing remarks MLS
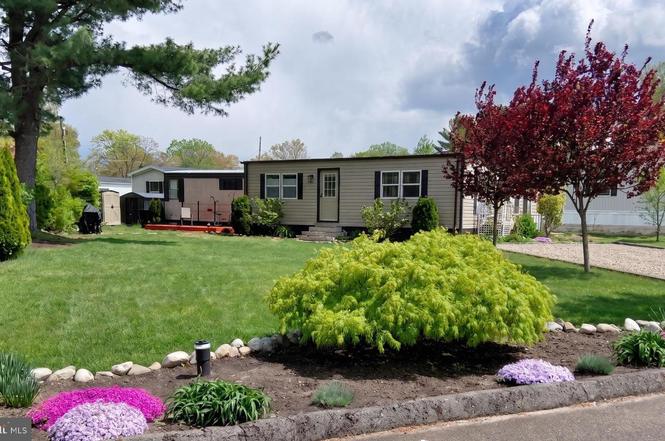
Check out this mobile home in Laux Lakeview Park. With a little TLC this would be a great place to call home.
Key facts
- Built 2004
- Listed 154 days
Property features AI
Finance
- HOA & community: Land lease of $670 per month (99 years remaining); HOA/Association fee $670 monthly
Exterior
- Parking: Driveway parking
- Utilities: Public water; Public sewer; Electric service
- Home design: Manufactured home; Pitched shingle roof; Above-grade living space
- Construction: Vinyl siding; Estimated major remodel in 2022
- Exterior features: Driveway
Interior
- Kitchen: Refrigerator
- Bedrooms: Three bedrooms on the main level
- Flooring: Fully carpeted; Vinyl flooring
- Bathrooms: One full bathroom
- Heating & cooling: Central heating (oil); Wall unit cooling (electric); Electric hot water
- Interior features: Eat-in kitchen
- Laundry & utility: Main-floor laundry
Neighborhood map
What this means for you Summary
Snapshot
- This is a 3-bed/1.0-bath manufactured listed at $140k.
Deal economics
- At list price, monthly cash flow is $409 ($5k/yr) — positive.
- The deal already cash-flows at list — no discount required.
- Meets the 1% rule at list price ($3k rent vs $140k).
- Recommended offer: $123k (12.0% below list) — sets the bar for market timing.
- Cap rate 9.8% vs local median 0.8% in Richwood — top-decile yield for the area; either an underpriced asset or a hidden risk that comps aren't pricing in. Stress-test before assuming the spread holds.
Location & tenants
- Location reads 63/100 on livability (#434 in NJ) — a middle-class / working-renter tenant base. Strengths: crime A+, employment A+, housing A+; Watch: amenities F, commute F, cost of living F.
- Kingsway Regional School District (rural): math 29% / reading 54% proficiency, ranked #175 of 472 in NJ (top 37%) — families likely to look elsewhere, expect single-tenant / working-renter base with shorter leases; only 8% free/reduced lunch — higher-income household profile.
- Zoned schools: South Harrison Elementary School (math 22% / reading 47%, grade F, #582 of 1,303 statewide, top 49%, 333 students, 14% FRL); Kingsway Regional Middle School (math 27% / reading 55%, grade F, #188 of 431 statewide, top 44%, 954 students, 11% FRL); Kingsway Regional High School (math 31% / reading 51%, grade F, #180 of 399 statewide, top 46%, 1,947 students, 10% FRL) — zoned schools at 12% FRL track the district average.
- Market conditions: 148 active listings in the ZIP; 1,047 units permitted in Gloucester County in 2024 (183 in 5+ unit buildings).
Forward outlook
- Local home prices are declining (-3.0%/yr); year-one equity from $967 of loan paydown is wiped out by about $4k of value loss. Plan a longer hold.
- Gloucester County population projected to shrink 5% by 2050 — rents likely to lag national; underwrite the cash flow, not the appreciation.
- At projected returns (-3.0% appreciation + 3.0% rent growth), your $39k cash investment doubles in ~9 years — after that, you're playing with house money.
Negotiation context
- It's been on market 154 days — a 12% lower offer ($123k) is reasonable based on typical stale-listing flexibility.
- 4 sale attempts since 8y ago; this cycle's ask has dropped $19k (12%) from the opening price — seller is motivated, your offer sets the floor, not the list.
- Current owner paid $11k; list at $140k implies a 1172% gain — meaningful room to come down on a strong offer.
Risks & watch-outs
- Watch-outs: HOA is 26% of rent.
- Climate carrying-cost: major wind risk, 56% chance of damaging wind over 30y; extreme-heat days projected 7→15/yr by 2055 (HVAC capex compounding) — expect insurance premiums to compound above CPI over the hold.
Questions for the listing agent
- It's been on market 154 days. Have you received any prior offers? Is the seller open to a 12% concession, seller financing, or rate buy-down credit?
- What does the HOA fee cover, when was the last increase, and are there any pending special assessments or reserve-fund shortfalls?
- Why hasn't it sold? Are there any deal-killer items the seller is aware of (foundation, flood, title, zoning, code violations)?
- Is there a deadline driving the sale (1031 exchange, divorce, estate, relocation)? That informs how much negotiation room exists.
- What's the average days-on-market for RENTAL listings here right now (not sales)? A rising rental-DOM trend means longer vacancies and softer asking-rent achievability than the comps imply.
- What's the recent tenant-quality profile in this submarket — average credit score on applications, eviction rate, late-payment / NSF rate, and stable-employment percentage? A property-management company in the area should have these aggregated.
- How much new for-sale + rental construction is in the pipeline within 1–3 miles? Heavy new supply typically softens prices + rents 12–24 months out; constrained supply supports both.
Investment metrics
- 1% rule
- 1.85% ✓
- Cap rate
- 9.80%
- Cash-on-cash
- 12.53%
- DSCR
- 1.56
- GRM
- 4.5
CMA / ARV
No comps found within radius.
Projected returns pro-forma
-3.0% appreciation · 3.0% rent growth · sell at horizon
- IRR
- 2.5%
- Equity multiple
- 1.10×
- Total profit
- $3,834
- Equity at exit
- $20,860
- IRR
- 12.4%
- Equity multiple
- 1.99×
- Total profit
- $38,717
- Equity at exit
- $12,096
Cash invested: $39,172 (down + closing). Projections, not guarantees.
Landlord ↔ Tenant lean methodology
- Overall (STATE)
- 21 Tenant-Leaning
- State New Jersey
- 21 Tenant-Leaning · D+6
- County
- — inherits STATE
- City
- — inherits STATE
ZIP-level market 08062
- Home prices YoY
- -18.7%
- Active inventory
- 148
- Price-to-rent
- 4.5×
Monthly cashflow live
- Estimated rent
- $2,590 medium interval (Pro) →
- Mortgage (P&I)
- −$734
- Tax est. 1.5%
- −$175 /mo · $2,098/yr
- Insurance
- −$58
- HOA
- −$670
- Vacancy / Maint / Mgmt
- −$544
- Net cashflow
- $409
Break-even live
Sensitivity live
| Price | -10% $506 | -5% $457 | +0% $409 | +5% $361 | +10% $312 |
|---|---|---|---|---|---|
| Rent | -10% $204 | -5% $307 | +0% $409 | +5% $511 | +10% $614 |
| Rate | -1.0pp $480 | -0.5pp $445 | base $409 | +0.5pp $373 | +1.0pp $336 |
UW: 25.0% down · 7.5% · 30yr · 1.5% tax · 5.0% vac · 8.0% maint · 8.0% mgmt
Financing live
Cash to close
- Down payment
- $34,975
- Closing costs
- $4,197
- Reserves months
- —
- Total cash needed
- —
Loan-product check · same deal, 3 products live
Conventional
25% down · 7.5% · 30yr
- Down + closing
- —
- Monthly P&I
- —
- Monthly cashflow
- —
- DSCR
- —
- Eligible?
- —
Personal DTI + credit; lowest rate.
DSCR
20% down · 8.5% · 30yr
- Down + closing
- —
- Monthly P&I
- —
- Monthly cashflow
- —
- DSCR
- —
- Eligible?
- —
No personal income docs; deal must DSCR.
Hard money
10% down · 12.0% · 12mo
- Down + closing
- —
- Monthly P&I
- —
- Monthly cashflow
- —
- DSCR
- —
- Eligible?
- —
Short-term bridge; refi at stabilization.
HOA detail
- Monthly dues
- $670 · $8,040/yr
Listing history 17 events
-
2026-05-14status Pending
-
2026-04-12status Active
-
2026-03-31historical
-
2026-03-16price $139,900
-
2025-12-16price $149,000
-
2025-12-16status Active
-
2025-11-10status Pending
-
2025-11-10historical
-
2025-10-25$159,000 Active
-
2025-10-20historical $159,000
-
2018-10-30status Pending 109-char remark
Show marketing remark (109 chars)
Check out this mobile home in Laux Lakeview Park. With a little TLC this would be a great place to call home.
-
2018-10-27soldstatus $11,000 Closed 109-char remark
Show marketing remark (109 chars)
Check out this mobile home in Laux Lakeview Park. With a little TLC this would be a great place to call home.
-
2018-10-26price $12,000 109-char remark
Show marketing remark (109 chars)
Check out this mobile home in Laux Lakeview Park. With a little TLC this would be a great place to call home.
-
2018-10-03price $17,500 109-char remark
Show marketing remark (109 chars)
Check out this mobile home in Laux Lakeview Park. With a little TLC this would be a great place to call home.
-
2018-08-14price $19,900 109-char remark
Show marketing remark (109 chars)
Check out this mobile home in Laux Lakeview Park. With a little TLC this would be a great place to call home.
-
2018-06-13price $22,000 109-char remark
Show marketing remark (109 chars)
Check out this mobile home in Laux Lakeview Park. With a little TLC this would be a great place to call home.
-
2018-05-21$30,000 Active 109-char remark
Show marketing remark (109 chars)
Check out this mobile home in Laux Lakeview Park. With a little TLC this would be a great place to call home.
ⓘ Source: listings_history table (triggers on properties + properties_extension) + one-shot
backfill from property_details.listing_events for pre-trigger history.
Climate risk First Street
- Flood 1/10 Low FEMA zone X (unshaded) · 0% chance over 30 yrs
- Wildfire 3/10 Moderate
- Heat 6/10 Major 7 d/yr ≥104°F today · 15 d/yr by 30 yrs out
- Wind 6/10 Major 56% chance of damaging wind over 30 yrs
- Air quality 3/10 Moderate 2 unhealthy d/yr today · 5 by 30 yrs out
Nearby sold comps map
Loading sold comps map…
Walkable amenities ~0.75 mi
Loading nearby amenities…
Taxation est. · year 1
- Rental income
- $31,077
- − Mortgage interest
- −$7,837
- − Property taxes
- −$2,098
- − Insurance
- −$700
- − Repairs & maintenance
- −$2,486
- − Management
- −$2,486
- − HOA
- −$8,040
- − Depreciation
- −$4,070
- Taxable income
- $3,360
- Est. tax owed @ 24.0%
- −$806
- After-tax cash flow
- $4,102/yr
For passive investors: Depreciation is non-cash, so a rental often shows a tax loss while cash-flowing — sheltering income. Rental losses are passive: they offset passive income freely, and up to $25,000/yr can offset ordinary (W-2) income if you actively participate and your MAGI is under $100k (phasing out to $0 by $150k); unused losses carry forward. On sale, claimed depreciation is recaptured at up to 25%, and gains may owe capital-gains tax (a 1031 exchange can defer both). Figures are a year-1 estimate at your 24.0% rate — not tax advice; consult a CPA.
Schools (NCES district)
- District
- Kingsway Regional School District
- NCES district ID
- 3407980
- Math proficiency
- 29% ▼ -27.00%
- Reading proficiency
- 54% ▼ -13.00%
- Median HH income
- $108,204
- Composite
- 41.2/100
- National rank
- #3543
- State rank
- #175 of 472 in NJ
Livability — Richwood
- Score
- 63/100
- State rank
- #434
- US rank
- #15696
Category grades
Schools grade is shown separately in the Schools card above.
Census & demographics
- Population (ZIP)
- 17,969
Population outlook (Gloucester County) Hauer SSP2
- Today (2025)
- 298,895 people
- By 2030
- 299,031 · +0.0%
- By 2040
- 294,020 · -1.6%
- By 2050
- 284,188 · -4.9%
- By 2075
- 260,720 · -12.8%
- By 2100
- 229,565 · -23.2%
Race, ethnicity, and origin ACS 2023
- Neighborhood character
- Predominantly White (84%)
- Race & ethnicity
- White 84% Hispanic / Latino 4% Asian 4% Two or more races 4% Black 4%
- Common ancestry
- Romanian 7% Lithuanian 2% Subsaharan African 1%
- Foreign-born
- 6% · Canada, South Korea
- Languages at home
- 92% English-only · Other Indo-European 4% Spanish 2% Other Asian/Pacific 1%
Political lean MEDSL · Gloucester
- 2024 margin
- Toss-up / Even · D 47.8% · R 50.6% · Other 1.6%
- 2008→2024 swing
- -15.0pp toward R · 2008: 12.2pp · 2024: -2.8pp
- All cycles
- 2024: R+2.8 2020: D+1.9 2016: R+0.4 2012: D+10.5 2008: D+12.2
Not yet ingested
- Civics
- —
Market trends
- HPI YoY
- ▼ -69.12%
- Current HPI
- 300.2469
- Rent YoY
- —
- Metro
- —
- State GDP YoY
- ▲ 2.05%
- F500 in state
- 34
Industry mix (Fortune 500 HQ in NJ)
| Industry | F500 HQs | Revenue |
|---|---|---|
| Consumer Goods | 3 | $31B |
|
||
| Pharmaceuticals | 2 | $153B |
|
||
| Technology | 2 | $21B |
|
||
| Insurance | 2 | $20B |
|
||
| Healthcare | 2 | $19B |
|
||
| Financial Services | 1 | $70B |
|
||
Price history
+366.3% since first listed17 events — show timeline
- 2026-05-14 Pending — BRIGHT MLS
- 2026-04-12 Relisted — BRIGHT MLS
- 2026-03-31 Listing Removed — BRIGHT MLS
- 2026-03-16 Price Changed $139,900 BRIGHT MLS
- 2025-12-16 Price Changed $149,000 BRIGHT MLS
- 2025-12-16 Relisted — BRIGHT MLS
- 2025-11-10 Pending — BRIGHT MLS
- 2025-11-10 Listing Removed — BRIGHT MLS
- 2025-10-25 Listed $159,000 BRIGHT MLS
- 2025-10-20 Coming Soon $159,000 BRIGHT MLS
- 2018-10-30 Pending — BRIGHT MLS
- 2018-10-27 Sold (MLS) $11,000 BRIGHT MLS
- 2018-10-26 Price Changed $12,000 BRIGHT MLS
- 2018-10-03 Price Changed $17,500 BRIGHT MLS
- 2018-08-14 Price Changed $19,900 BRIGHT MLS
- 2018-06-13 Price Changed $22,000 BRIGHT MLS
- 2018-05-21 Listed $30,000 BRIGHT MLS
Cash-flow waterfall
monthlySold comps — $/sqft
last 12 mo · ≤1 miLoading sold comps…