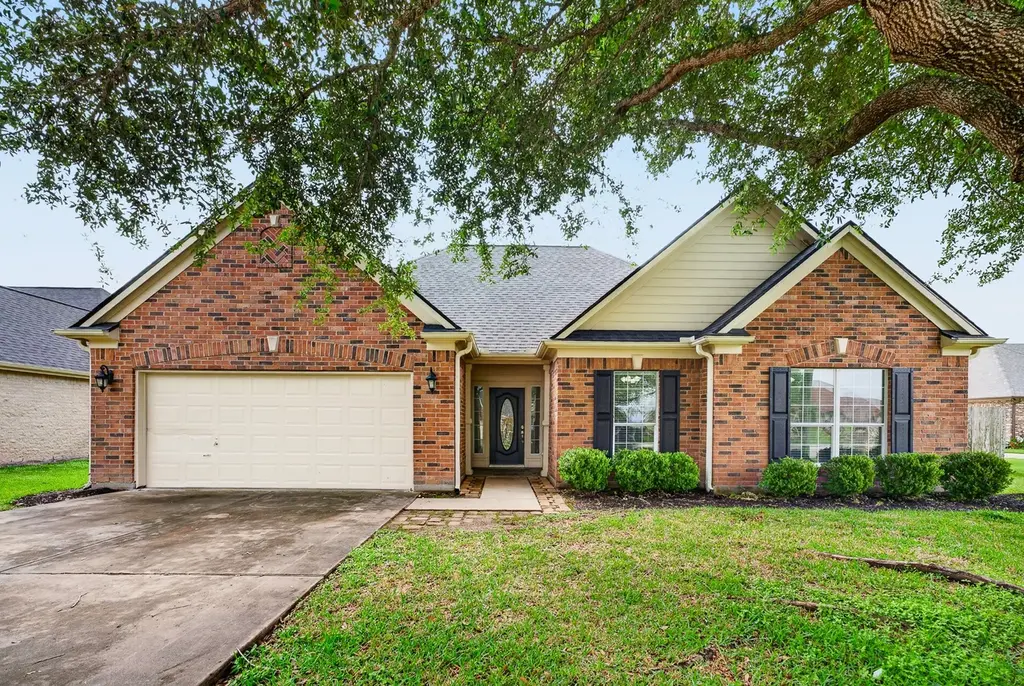
3823 Founders Dr · Needville, TX
Flood risk 1/10 · Minimal
- FEMA flood zone
- X (unshaded)
- Chance of flooding over 30 yrs
- 0.0%
- Est. flood insurance / yr
- $507 – $1,088
Fire risk 3/10 · Minor
- Est. fire insurance / yr
- $1,222 – $2,270
Heat risk 9/10 · Severe
- Hot days now (above 109°F)
- 7 days/yr
- Hot days in 30 yrs
- 23 days/yr
Wind risk 9/10 · Severe
- Chance of severe wind over 30 yrs
- 99.0%
Air-quality risk 2/10 · Minimal
- Unhealthy air days now
- 1 days/yr
- Unhealthy air days in 30 yrs
- 1 days/yr
Risk factors via First Street. Map © Google.
Why this score? — see what drove the D grade
The composite is a weighted blend of 9 inputs, each scored 0–100. Each bar is that input's sub-score; the figure is the points it added to the 100-point composite (weight × sub-score).
- ARV discount +14.4/15.0
- Cash flow +7.7/30.0
- Schools +4.8/10.0
- Livability +3.8/5.0
- 1% rule +3.3/10.0
- Rent growth +2.5/5.0
- Condition / age +2.5/5.0
- DSCR +1.8/10.0
- Appreciation +0.0/10.0
$274,999
🖨 Deal sheet (PDF) 📄 Offer letter ✓ Due diligence
Listing remarks
Welcome to 3823 Founders Dr—where comfort, updates, and functionality come together! This spacious 1 story all-brick home sits on an oversized lot and features a large side gate, making it ideal for storing a trailer, boat, or camper. Step outside to enjoy the covered back patio, perfect for entertaining or relaxing with friends and family year-round. Inside, you’ll appreciate the fresh interior paint and new luxury vinyl flooring that give the home a clean, modern feel. The living room boasts soaring high ceilings and a cozy gas-burning fireplace, creating a warm and inviting space. The kitchen is equipped with stainless steel appliances, granite countertops, and plenty of roo
Key facts
- Large side gate
- Covered back patio
- Oversized lot
Tags
Property features AI
Finance
- HOA & community: Highland Pointe HOA with $75 annual fee
Exterior
- Parking: Attached garage with 2 spaces
- Utilities: Public water; Public sewer
- Home design: Residential property; Single-story (all rooms listed on first level)
- Construction: Brick construction; Built in 2007; Composition roof; Slab foundation
- Exterior features: Located in a subdivision
Interior
- Kitchen: Dishwasher; Garbage disposal; Gas range; Microwave
- Bedrooms: Primary bedroom (first level) — 16 x 12; Bedroom (first level) — 13 x 12; Bedroom (first level) — 11 x 10
- Flooring: Carpet; Plank; Vinyl
- Bathrooms: 2 full bathrooms; Primary bathroom (first level) — 8 x 10; Bathroom (first level) — 8 x 8
- Heating & cooling: Central heating (gas); Central electric air conditioning
- Interior features: Granite counters; Fireplace
- Laundry & utility: (No specific laundry/utility details provided)
Neighborhood map
What this means for you Summary
Snapshot
- This is a 3-bed/2.0-bath single-family listed at $275k.
Deal economics
- At list price, monthly cash flow is $-316 ($-4k/yr) — negative.
- To cash-flow at today's rent, offer at most $219k (20.3% below list).
- To meet the 1% rule (rent ≥ 1% of price), the offer needs to be $230k (16.5% below list).
- Recommended offer: $219k (20.3% below list) — sets the bar for cash-flow.
- Cap rate 4.9% vs local median 3.0% in Needville — top-decile yield for the area; either an underpriced asset or a hidden risk that comps aren't pricing in. Stress-test before assuming the spread holds.
Location & tenants
- Location reads 75/100 on livability (#137 in TX, #3,992 nationally) — a middle-class / working-renter tenant base. Strengths: crime A+, cost of living A+, housing A+; Watch: amenities F, commute F.
- Needville ISD (rural): math 55% / reading 55% proficiency, ranked #95 of 826 in TX (top 12%) — acceptable for families but not a draw, mixed tenant base, ~2y average lease.
- Zoned schools: Needville El (math 58% / reading 53%, grade C, #587 of 4,322 statewide, top 14%, 1,129 students, 49% FRL); Needville Middle (math 56% / reading 56%, grade B-, #234 of 1,662 statewide, top 14%, 819 students, 45% FRL); Needville H S (math 50% / reading 56%, grade C-, #437 of 1,632 statewide, top 27%, 1,067 students, 41% FRL).
- Market conditions: 350 active listings in the ZIP; 1 comparable units currently listed for rent nearby; 12,093 units permitted in Fort Bend County in 2024 (815 in 5+ unit buildings).
Forward outlook
- Local home prices are declining (-3.0%/yr); year-one equity from $2k of loan paydown is wiped out by about $8k of value loss. Plan a longer hold.
- Fort Bend County population projected at +75% by 2050 — long-run rental-demand tailwind backs the buy-and-hold thesis.
Negotiation context
- It's been on market 20 days — a 2% lower offer ($271k) is reasonable based on typical stale-listing flexibility.
- 3 sale attempts since 20y ago with the ask held roughly flat each time — persistent listings suggest the price (not the market) is what's stuck; bring a comps-based counter.
Risks & watch-outs
- Climate carrying-cost: severe wind risk, 99% chance of damaging wind over 30y; extreme-heat days projected 7→23/yr by 2055 (HVAC capex compounding) — expect insurance premiums to compound above CPI over the hold.
Questions for the listing agent
- What do current leases actually rent for vs. the listed asking? Can we see a recent rent roll and the last 12 months of T-12 income?
- What does the HOA fee cover, when was the last increase, and are there any pending special assessments or reserve-fund shortfalls?
- Is there a deadline driving the sale (1031 exchange, divorce, estate, relocation)? That informs how much negotiation room exists.
- The area grade is low — what's the realistic commute time and amenity access for the typical tenant pool here? Any planned neighborhood developments (good or bad) we should know about?
- What's the average days-on-market for RENTAL listings here right now (not sales)? A rising rental-DOM trend means longer vacancies and softer asking-rent achievability than the comps imply.
- What's the recent tenant-quality profile in this submarket — average credit score on applications, eviction rate, late-payment / NSF rate, and stable-employment percentage? A property-management company in the area should have these aggregated.
- How much new for-sale + rental construction is in the pipeline within 1–3 miles? Heavy new supply typically softens prices + rents 12–24 months out; constrained supply supports both.
Investment metrics
- 1% rule
- 0.83% ✗
- Cap rate
- 4.92%
- Cash-on-cash
- -4.92%
- DSCR
- 0.78
- GRM
- 10.0
CMA / ARV
- ARV (median comp)
- $324,746
- List price
- $274,999
- Delta
- -15.32%
- Verdict
- UNDERPRICED
- Comps
- 20 within 1.0 mi
Show comp detail 12 sales within ~0.75 mi
| Address | Dist | Beds/Ba | Sqft | Sold | Price | $/sf | Match |
|---|---|---|---|---|---|---|---|
| 3823 Founders Dr | 0.00mi | 3/2.0 | 1,683 (0%) | 1mo | $274,999 | $163 | 100 |
| 9723 Highland Pointe Dr | 0.15mi | 3/2.0 | 1,600 (-5%) | 4mo | $300,000 | $188 | 82 |
| 3818 Founders Dr | 0.03mi | 4/2.0 (+1) | 1,855 (+10%) | 1mo | $324,900 | $175 | 76 |
| 14210 Cally Cir | 0.47mi | 3/2.0 | 1,712 (+2%) | 4mo | $335,000 | $196 | 72 |
| 3815 Founders Dr | 0.03mi | 4/2.0 (+1) | 1,855 (+10%) | 10mo | $314,900 | $170 | 68 |
| 3819 Willow Breeze | 0.16mi | 4/2.5 (+1) | 1,876 (+12%) | 3mo | $344,900 | $184 | 64 |
| 9206 Gene St | 0.55mi | 3/2.0 | 1,646 (-2%) | 9mo | $319,900 | $194 | 63 |
| 9525 Gene St | 0.37mi | 3/2.0 | 1,852 (+10%) | 4mo | $297,500 | $161 | 63 |
| 14431 Joyce St | 0.45mi | 3/2.0 | 1,508 (-10%) | 9mo | $285,000 | $189 | 54 |
| 8903 Milby St | 0.67mi | 3/3.5 | 1,600 (-5%) | 2mo | $279,999 | $175 | 53 |
| 14120 Fm1236 Rd | 0.68mi | 3/3.5 | 1,583 (-6%) | 1mo | $279,999 | $177 | 52 |
| 9422 Union St | 0.44mi | 3/2.0 | 1,442 (-14%) | 10mo | $255,000 | $177 | 47 |
Match score weights: distance 35% · size 25% · config 20% · recency 20%. Top-matched comps best support the ARV.
Projected returns pro-forma
-3.0% appreciation · 3.0% rent growth · sell at horizon
- IRR
- -24.6%
- Equity multiple
- 0.16×
- Total profit
- $-64,494
- Equity at exit
- $41,003
- IRR
- -19.9%
- Equity multiple
- -0.06×
- Total profit
- $-81,340
- Equity at exit
- $23,777
Cash invested: $77,000 (down + closing). Projections, not guarantees.
Landlord ↔ Tenant lean methodology
- Overall (STATE)
- 87 Strongly Landlord-Friendly
- State Texas
- 87 Strongly Landlord-Friendly · R+5
- County
- — inherits STATE
- City
- — inherits STATE
ZIP-level market 77461
- Home prices YoY
- -22.9%
- Active inventory
- 350
- Price-to-rent
- 10.0×
Monthly cashflow live
- Estimated rent
- $2,295 medium interval (Pro) →
- Mortgage (P&I)
- −$1,442
- Tax from tax record
- −$566 /mo · $6,792/yr
- Insurance
- −$115
- HOA
- −$6
- Vacancy / Maint / Mgmt
- −$482
- Net cashflow
- $-316
Break-even live
Sensitivity live
| Price | -10% $-160 | -5% $-238 | +0% $-316 | +5% $-394 | +10% $-471 |
|---|---|---|---|---|---|
| Rent | -10% $-497 | -5% $-406 | +0% $-316 | +5% $-225 | +10% $-134 |
| Rate | -1.0pp $-177 | -0.5pp $-246 | base $-316 | +0.5pp $-387 | +1.0pp $-459 |
UW: 25.0% down · 7.5% · 30yr · 1.5% tax · 5.0% vac · 8.0% maint · 8.0% mgmt
Financing live
Cash to close
- Down payment
- $68,750
- Closing costs
- $8,250
- Reserves months
- —
- Total cash needed
- —
Loan-product check · same deal, 3 products live
Conventional
25% down · 7.5% · 30yr
- Down + closing
- —
- Monthly P&I
- —
- Monthly cashflow
- —
- DSCR
- —
- Eligible?
- —
Personal DTI + credit; lowest rate.
DSCR
20% down · 8.5% · 30yr
- Down + closing
- —
- Monthly P&I
- —
- Monthly cashflow
- —
- DSCR
- —
- Eligible?
- —
No personal income docs; deal must DSCR.
Hard money
10% down · 12.0% · 12mo
- Down + closing
- —
- Monthly P&I
- —
- Monthly cashflow
- —
- DSCR
- —
- Eligible?
- —
Short-term bridge; refi at stabilization.
Rent comps 1 comps
| Address | Beds | Baths | Sqft | Rent | $/sqft | DOM | Units | Dist |
|---|---|---|---|---|---|---|---|---|
| 9723 Highland Pointe Dr Needville, TX | 3.0 | 2.0 | 1600 | $2,295 | $1.43 | 7d | 1 | 0.17mi |
HOA detail
- Monthly dues
- $6 · $72/yr
- Likely covers
- gas
Listing history 10 events
-
2026-05-13status Pending 990-char remark
-
2026-05-06status Pending 990-char remark
-
2026-04-22$274,999 Active 990-char remark
-
2026-02-25soldstatus
-
2010-11-23soldstatus
-
2008-01-02soldstatus
-
2007-10-12historical
-
2007-05-16$158,900
-
2007-03-14historical
-
2006-11-14$22,000
ⓘ Source: listings_history table (triggers on properties + properties_extension) + one-shot
backfill from property_details.listing_events for pre-trigger history.
Tax reassessment forecast TX · Resets to sale price
- Current annual tax
- $6,792 · $566/mo
- Projected year-2 tax
- $6,792 · $566/mo
- Expected delta
- $0/yr ($0/mo · 0.0%)
ⓘ Screening estimate from a state-policy table — verify with the county assessor before closing.
Climate risk First Street
- Flood 1/10 Low FEMA zone X (unshaded) · 0% chance over 30 yrs
- Wildfire 3/10 Moderate
- Heat 9/10 Extreme 7 d/yr ≥109°F today · 23 d/yr by 30 yrs out
- Wind 9/10 Extreme 99% chance of damaging wind over 30 yrs
- Air quality 2/10 Low 1 unhealthy d/yr today · 1 by 30 yrs out
Nearby sold comps map
Loading sold comps map…
Walkable amenities ~0.75 mi
Loading nearby amenities…
Taxation est. · year 1
- Rental income
- $27,540
- − Mortgage interest
- −$15,404
- − Property taxes
- −$6,792
- − Insurance
- −$1,375
- − Repairs & maintenance
- −$2,203
- − Management
- −$2,203
- − HOA
- −$72
- − Depreciation
- −$8,000
- Taxable loss
- −$8,510
- Est. tax savings @ 24.0%
- +$2,042
- After-tax cash flow
- $-1,746/yr
For passive investors: Depreciation is non-cash, so a rental often shows a tax loss while cash-flowing — sheltering income. Rental losses are passive: they offset passive income freely, and up to $25,000/yr can offset ordinary (W-2) income if you actively participate and your MAGI is under $100k (phasing out to $0 by $150k); unused losses carry forward. On sale, claimed depreciation is recaptured at up to 25%, and gains may owe capital-gains tax (a 1031 exchange can defer both). Figures are a year-1 estimate at your 24.0% rate — not tax advice; consult a CPA.
Schools (NCES district)
- District
- Needville ISD
- NCES district ID
- 4832310
- Math proficiency
- 55% ▲ 1.00%
- Reading proficiency
- 55% ▬ 0.00%
- Median HH income
- $62,900
- Composite
- 48.17/100
- National rank
- #2176
- State rank
- #95 of 826 in TX
Livability — Needville
- Score
- 75/100
- State rank
- #137
- US rank
- #3992
Category grades
Schools grade is shown separately in the Schools card above.
Census & demographics
- Census place
- Needville, TX
- Population (ZIP)
- 12,397
Population outlook (Fort Bend County) Hauer SSP2
- Today (2025)
- 1,004,526 people
- By 2030
- 1,153,104 · +14.8%
- By 2040
- 1,453,718 · +44.7%
- By 2050
- 1,753,781 · +74.6%
- By 2075
- 2,455,772 · +144.5%
- By 2100
- 2,930,528 · +191.7%
Race, ethnicity, and origin ACS 2023
- Neighborhood character
- Majority White (50%)
- Race & ethnicity
- White 50% Hispanic / Latino 45% Two or more races 18% Black 2% Native American 1%
- Hispanic origin (detail)
- Mexican 42%
- Common ancestry
- Lithuanian 2% Slovak 1% Portuguese 1%
- Foreign-born
- 15% · Canada, China
- Languages at home
- 69% English-only · Spanish 28% German/W. Germanic 2%
Political lean MEDSL · Fort Bend
- 2024 margin
- Toss-up / Even · D 49.5% · R 47.9% · Other 2.6%
- 2008→2024 swing
- +4.0pp toward D · 2008: -2.4pp · 2024: 1.6pp
- All cycles
- 2024: D+1.6 2020: D+10.6 2016: D+6.6 2012: R+6.8 2008: R+2.4
Not yet ingested
- Civics
- —
Market trends
- HPI YoY
- ▼ -96.17%
- Current HPI
- 324.3807
- Rent YoY
- —
- Metro
- —
- State GDP YoY
- ▲ 3.95%
- F500 in state
- 110
Industry mix (Fortune 500 HQ in TX)
| Industry | F500 HQs | Revenue |
|---|---|---|
| Energy | 16 | $1,198B |
|
||
| Technology | 5 | $198B |
|
||
| Engineering / Construction | 4 | $72B |
|
||
| Energy Services | 3 | $60B |
|
||
| Utilities | 3 | $41B |
|
||
| Healthcare | 2 | $330B |
|
||
Price history
+1150.0% since first listed11 events — show timeline
- 2026-06-03 Sold (MLS) — HARMLS
- 2026-05-13 Pending — HARMLS
- 2026-05-06 Pending — HARMLS
- 2026-04-22 Listed $274,999 HARMLS
- 2026-02-25 Sold (Public Records) — Public Records
- 2010-11-23 Sold (Public Records) — Public Records
- 2008-01-02 Sold (Public Records) — Public Records
- 2007-10-12 Listing Removed — HARMLS
- 2007-05-16 Listed $158,900 HARMLS
- 2007-03-14 Listing Removed — HARMLS
- 2006-11-14 Listed $22,000 HARMLS
Property tax history
+3.5%/yrLatest (2025): $6,792 · +5.8% YoY. Source: county tax records.
Cash-flow waterfall
monthlySold comps — $/sqft
last 12 mo · ≤1 miLoading sold comps…